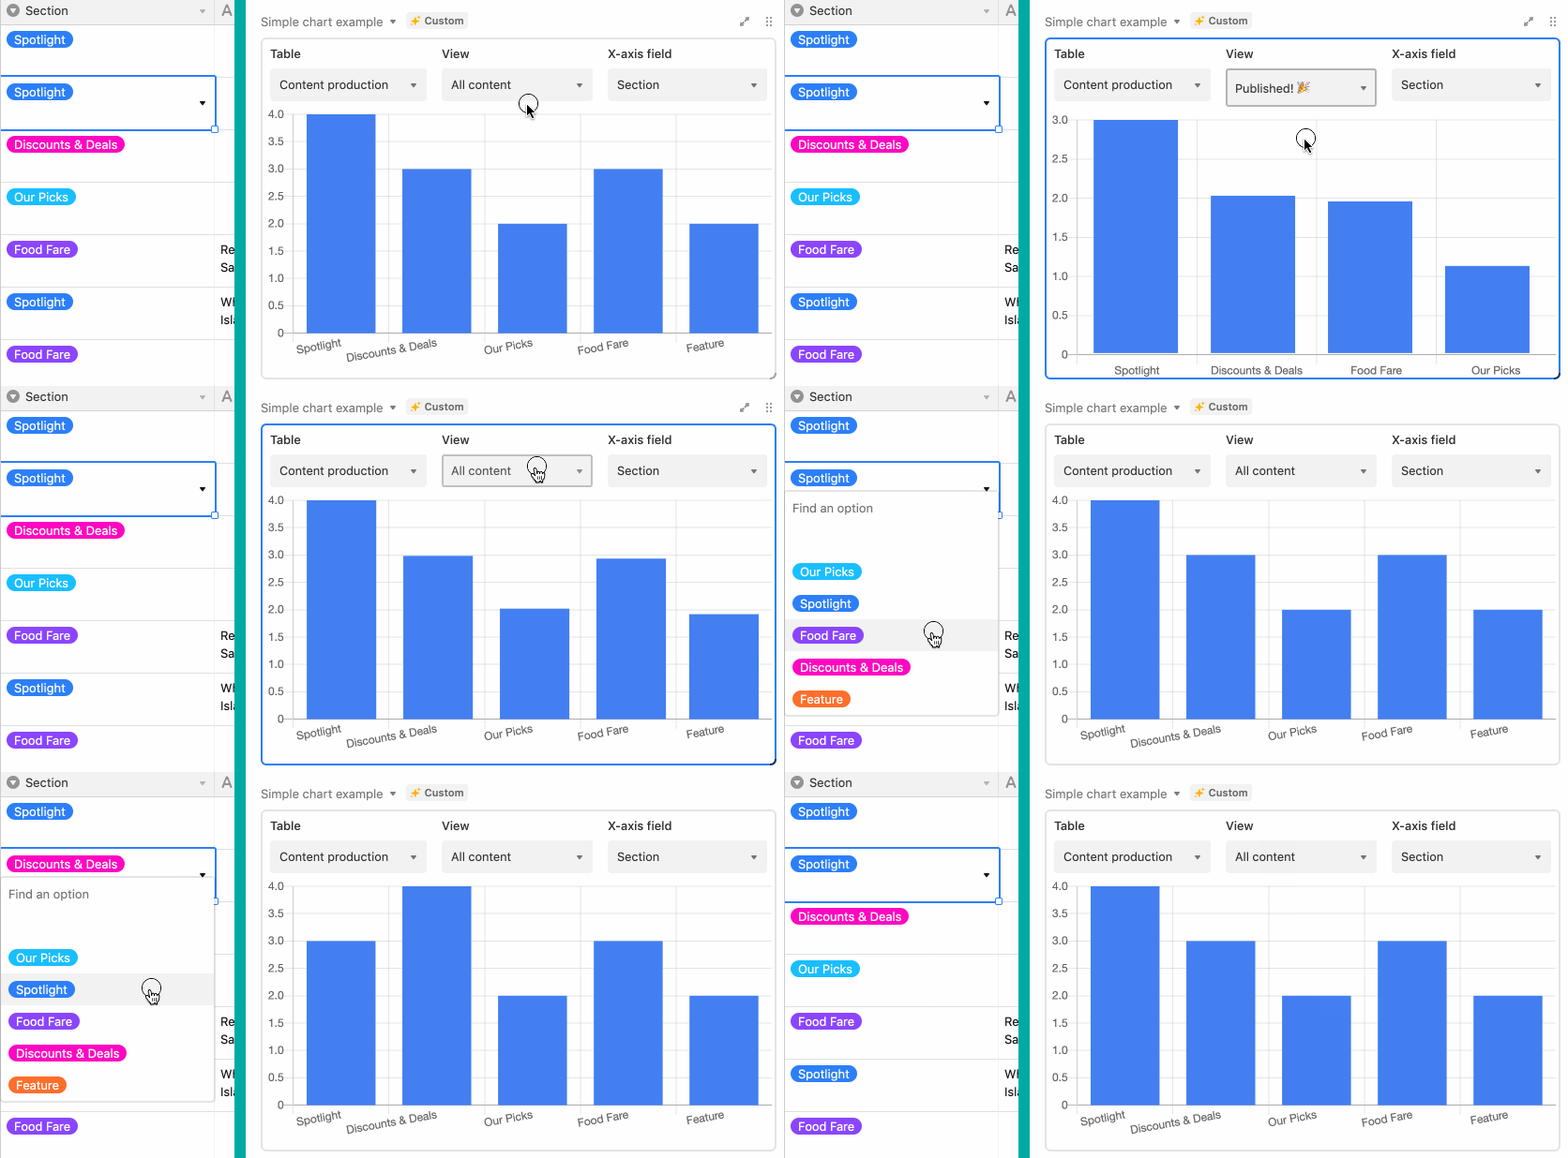
This example app shows a bar chart of data from a table.
The code shows:
-
How to use the Chart.js external library.
-
How to store app-related data using
globalConfigandSyncedUI components.
-
Create a new base using the Sales CRM template.
-
Create a new app in your new base (see Create a new app), selecting "Simple chart" as your template.
-
From the root of your new app, run
block run.
