Implementation of classification models on the CheXpert dataset aiming to replicate the results in CheXpert: A Large Chest Radiograph Dataset with Uncertainty Labels and Expert Comparison.
- python 3.5+
- pytorch 1.0+
- torchvision
- numpy
- pandas
- sklearn
- matplotlib
- tensorboardX
- tqdm
To train a model using default batch size, learning:
python chexpert.py  --train
                    --data_path         # location of dataset
                    --model             # choice of densenet121 or resnet152 or efficientnet-b[0-7]
                    --pretrained        # flag if pretrained model should be downloaded (only for densenet and resnet)
                    --cuda              # number of cuda device to train on
To evaluate a single model:
python chexpert.py  --evaluate_single_model / evaluate_ensemble
                    --model             # architecture of the saved model
                    --data_path         # location of dataset
                    --output_dir        # folder where experiment results and tensorboard tracking are saved
                    --restore           # if evaluate_single_model - file path to the saved model checkpoint,
                                          if evaluate_ensemble - folder path to the directory where checkpoints are saved
                    --plot_roc          # flag whether to also plot ROC and PR curves
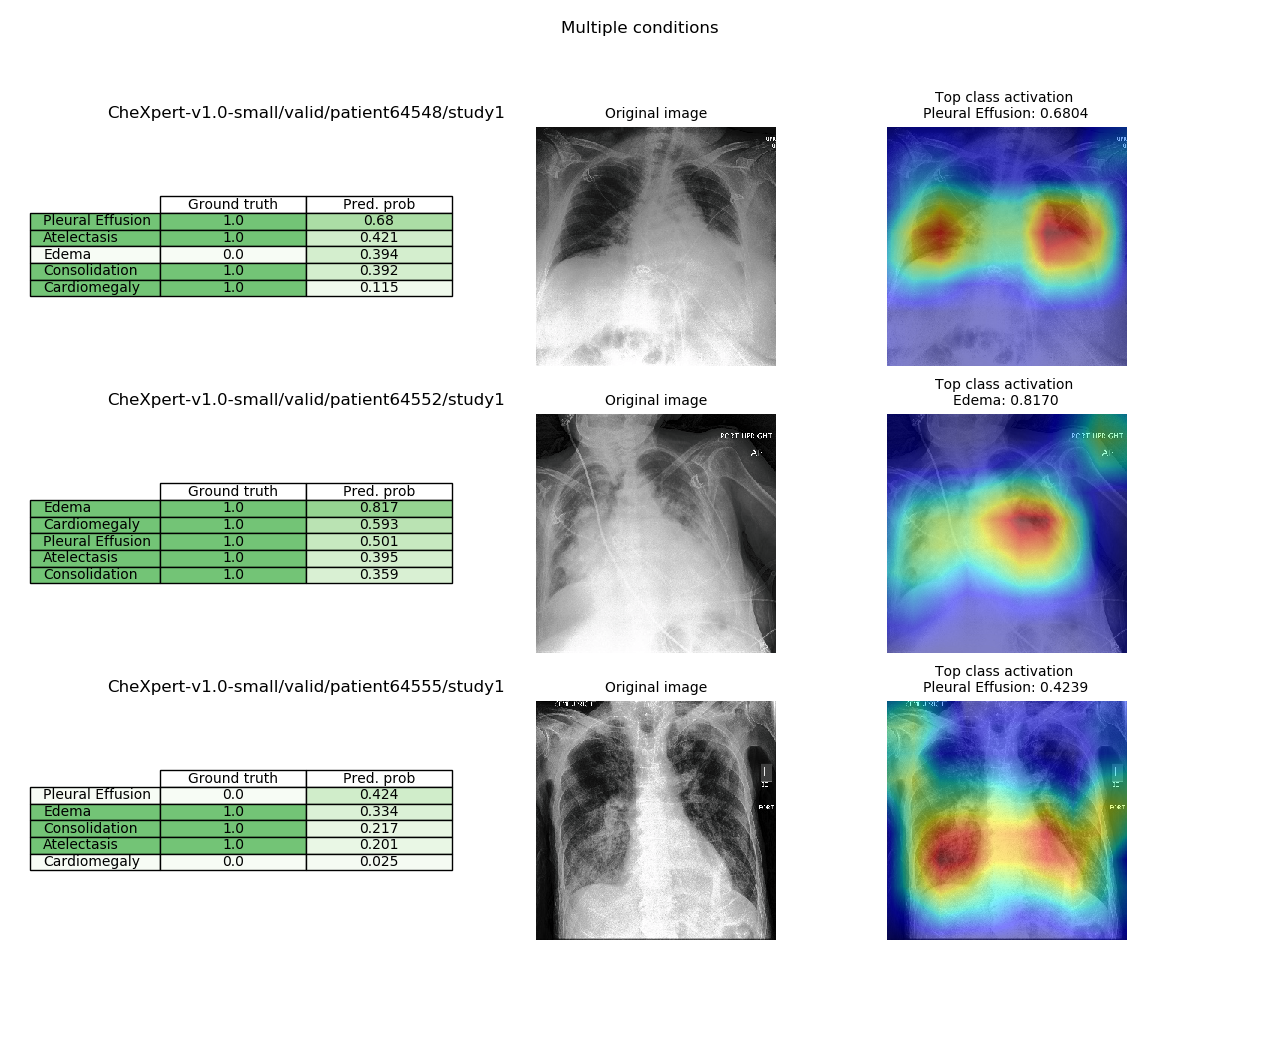
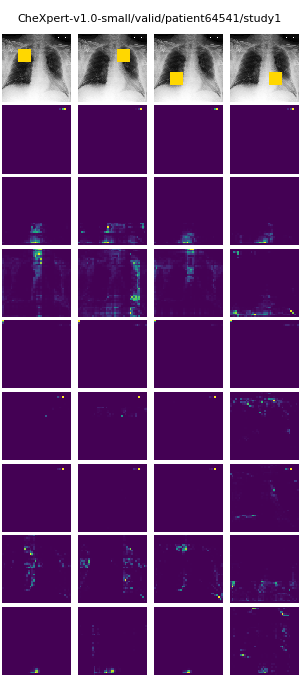
To visualize class activation mappings from the validation set. Saves a grid of model probabilities, original image, and grad-cam visualization for 3 examples for each condition singularly present, 2 present conditions, >2 present conditions, and no present conditions; example below. Additionally for the same images, if attention model, saves a visualization of attention probabilities at each attention layer, example below.
python chexpert.py  --visualize
                    --model             # choice of densenet121 or resnet152 of the saved model
                    --data_path         # location of dataset
                    --output_dir        # folder where experiment results are saved
                    --restore           # file path to the saved model checkpoint
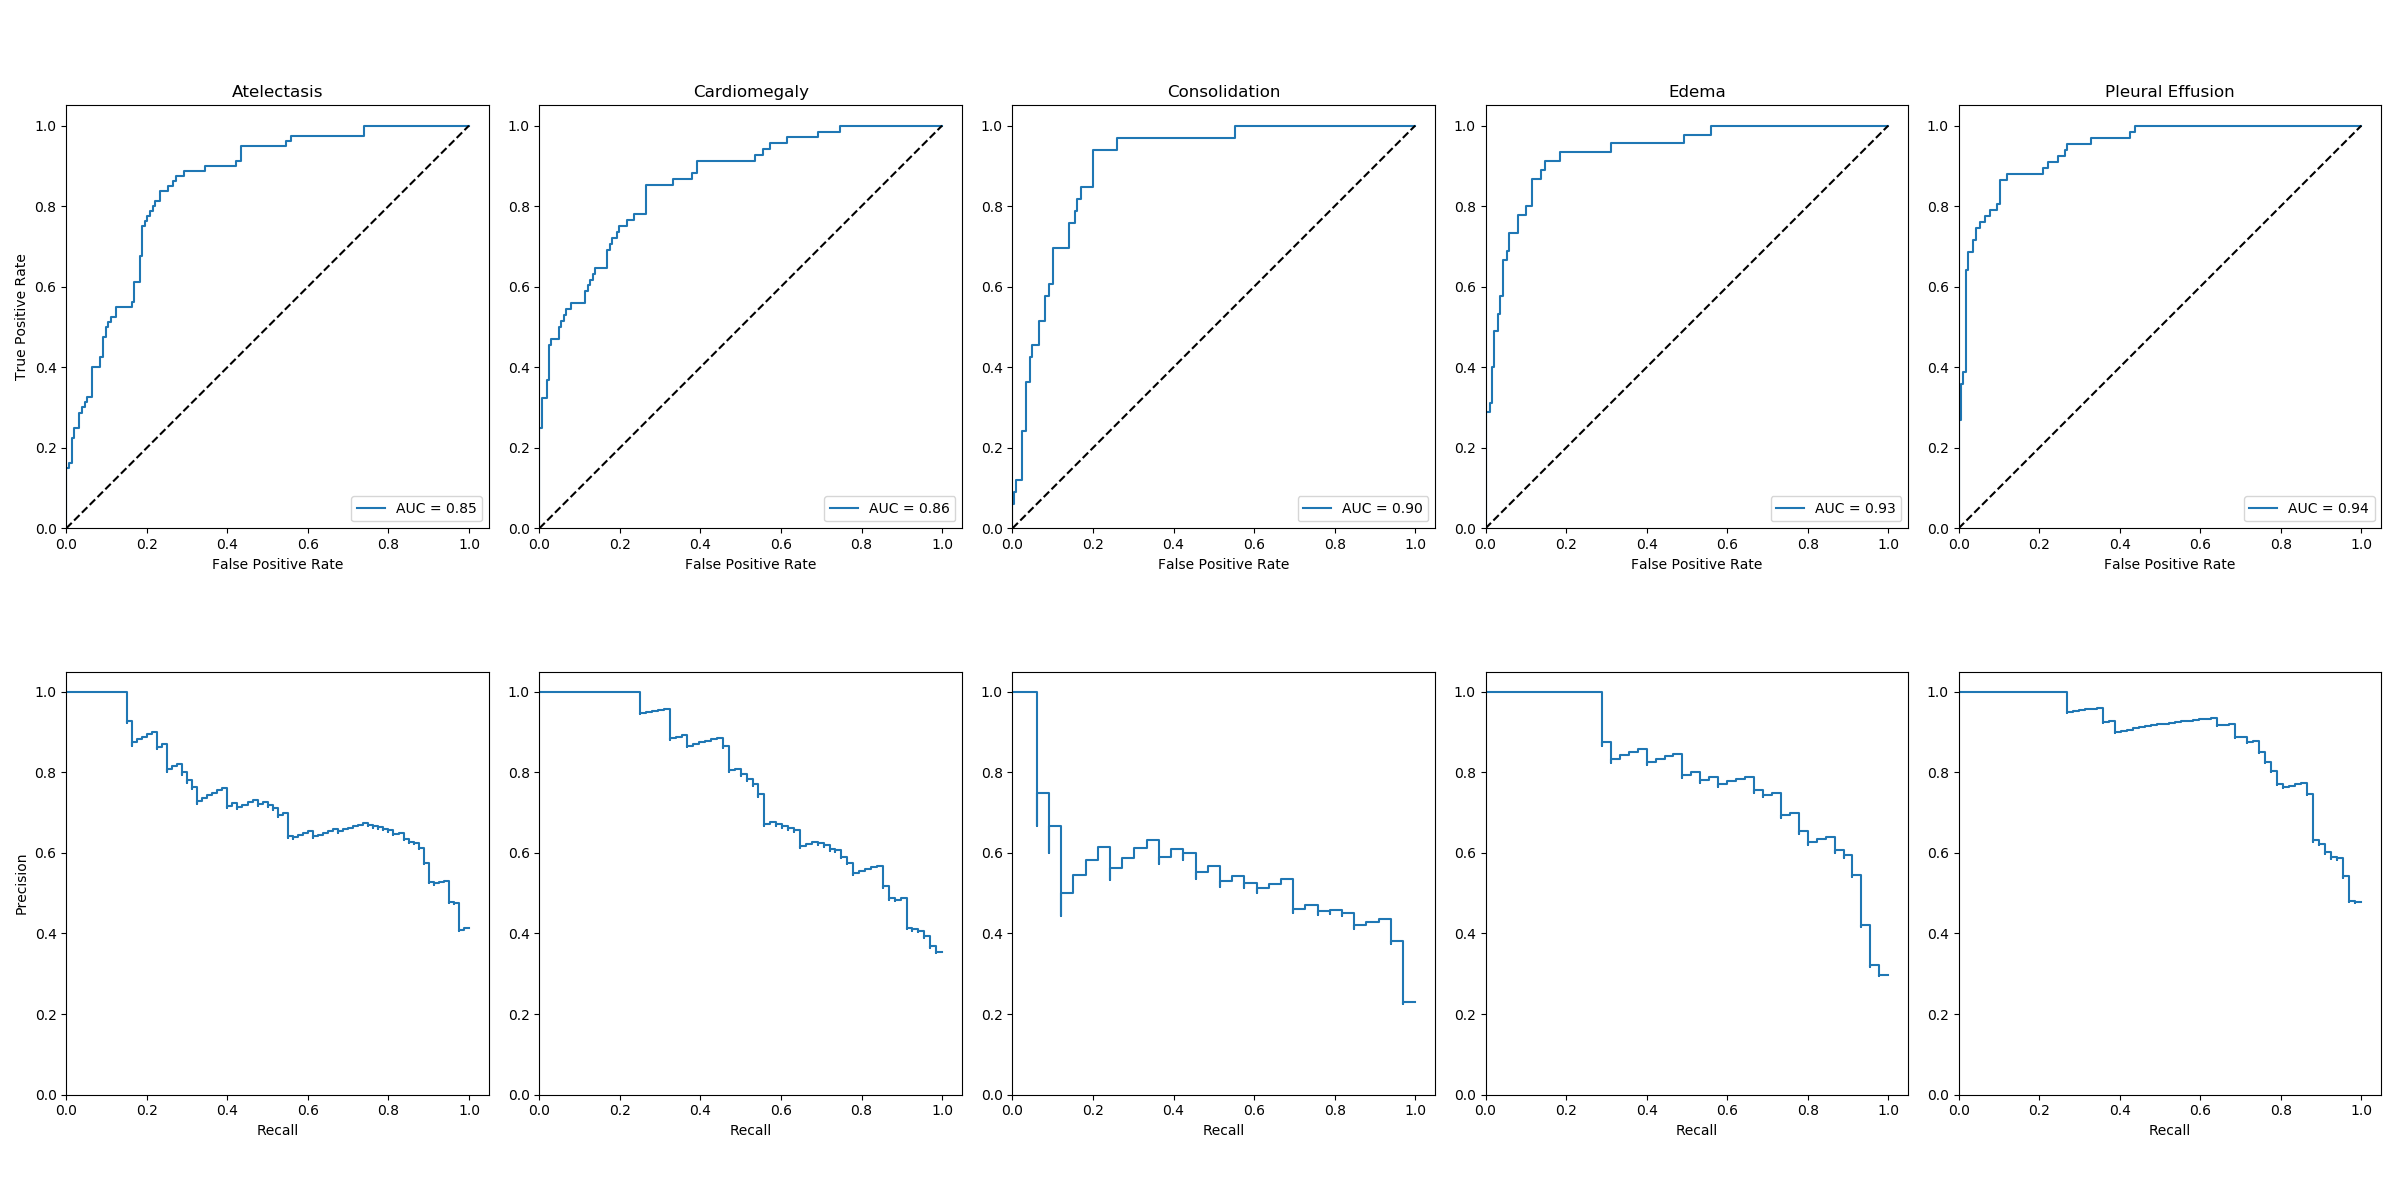
Models were trained with the hyperparameters described in the paper (Training Procedure section). The results below are an ensemble of the 10 best checkpoints on the validation set computing the mean of the output scores over the 10 models. pretrained refers to ImageNet pretraining and subsequent fine-tuning of the entire model. densenet121_attn_aug refers to attention augmented DenseNet where in each Transition layer the AvgPool and 1x1 convolution are replaced by a 3x3 attention-augmented convolution with stride 2 (cf implementation and reference paper in models; hyperparameters: 8 attn heads, k=0.2, v=0.1).
| Model | Atelectasis | Cardiomegaly | Consolidation | Edema | Pleural Effusion |
|---|---|---|---|---|---|
| densenet121_baseline | 0.847 | 0.845 | 0.912 | 0.905 | 0.938 |
| densenet121_pretrained | 0.847 | 0.859 | 0.900 | 0.936 | 0.940 |
| densenet121_attn_aug | 0.853 | 0.838 | 0.915 | 0.869 | 0.913 |
| efficientnet-b0_data_aug | 0.857 | 0.852 | 0.903 | 0.890 | 0.932 |
| efficientnet-b4_data_aug | 0.851 | 0.844 | 0.904 | 0.890 | 0.928 |
| resnet152_baseline | 0.861 | 0.852 | 0.908 | 0.894 | 0.919 |
| resnet152_pretrained | 0.849 | 0.859 | 0.916 | 0.934 | 0.944 |
Examples of findings localization using Gradient-weighted Class Activation Mappings using DenseNet121_pretrained:
In the predictions tables below, Pred. prob refers to model prediction probability (uncalibrated).
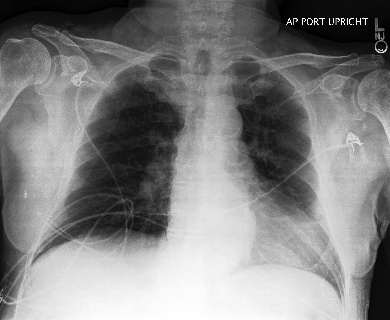
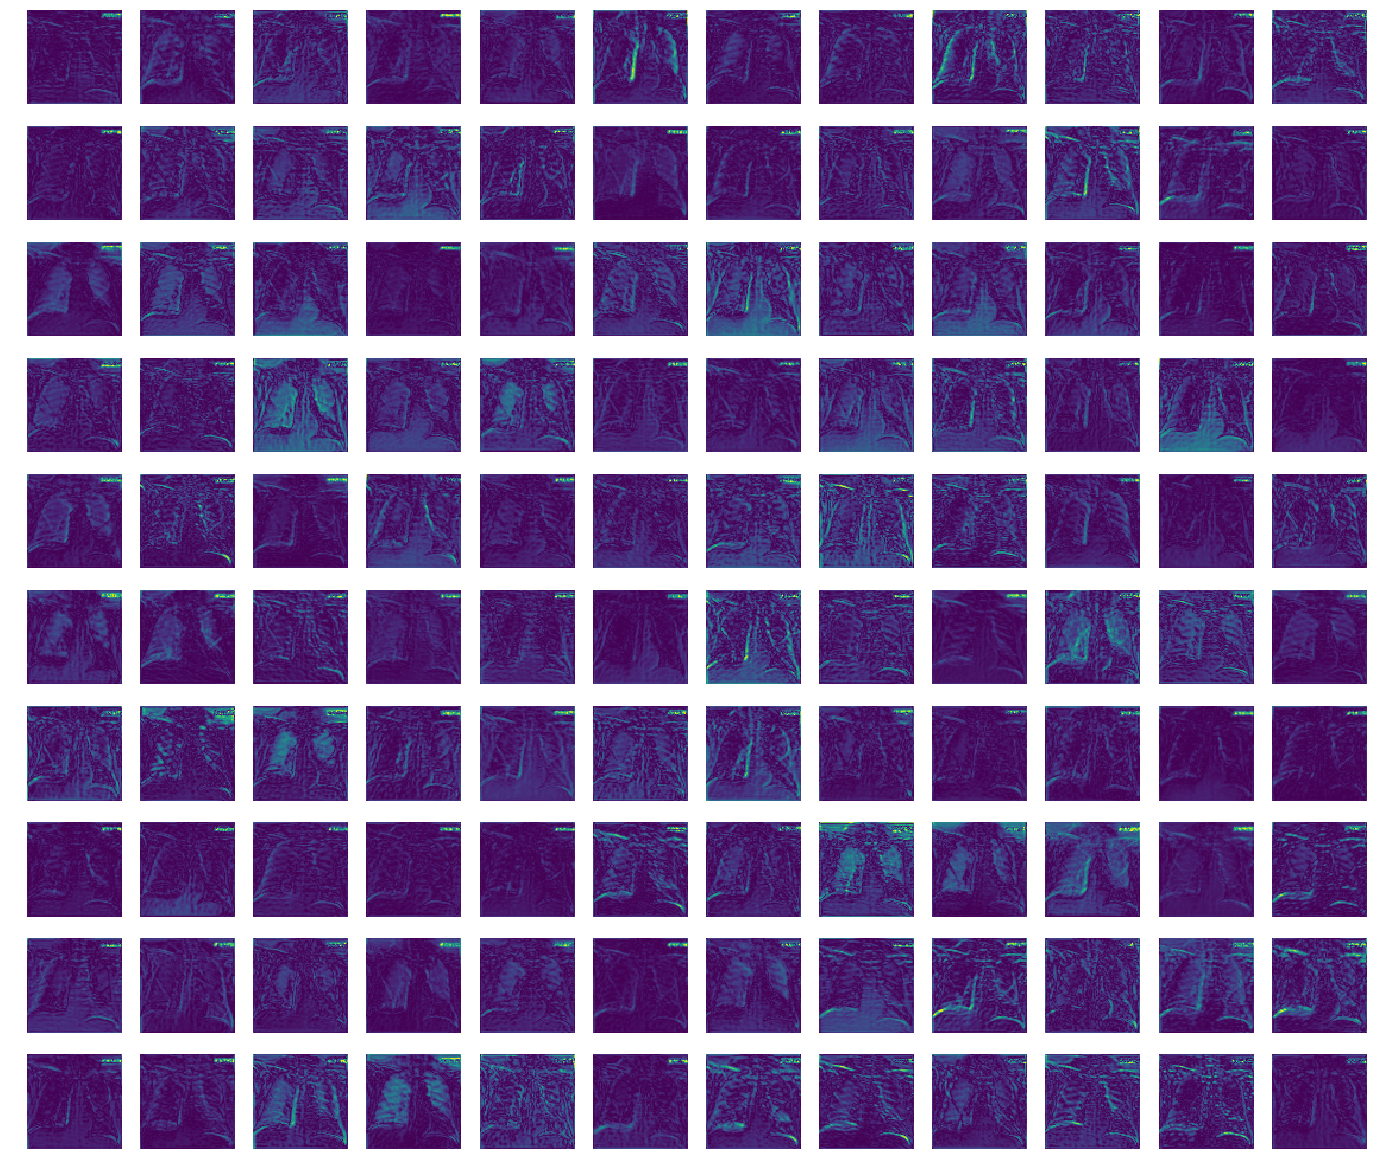
Model is confounded by writing on the radiographs (e.g. L/R in corner). Feature map activations for DenseNet121 below highlight writing in top right corner (see visualize_features); attention maps on the same image but using the attention-augmented DenseNet121 show the model attending to the writing (attention probabilities are averaged over the yellow squares overlaid on image) - specifically attention heads 1, 4, 5, and 6 (rows in image).
