This repo contains all my learnings in Open-CV
The source code is here
Opencv has function cv2.imread(str,channel) it takes the arguments of string(filename or path) and the channel 0 corresponds to B/W and 1 corresponds to Color.
It can open BMP, JPEG, PNG, PPM, RAS file formats and convert them to cv2.Mat which is basically a matrix like
[ [2 3 4 5 6 7 8]
[2 3 4 5 1 8 4]
[6 7 8 9 3 4 5] ]
[ [[100 34 25] [100 34 25] [100 34 25] [100 34 25] [100 34 25] [100 34 25] [100 34 25][100 34 25] [100 34 25] [100 34 25] [100 34 25] [100 34 25]]
cv2.imshow((str),matrix) which can open the martrix to image the string is the name of the window
if the image is to large one can use cv2.namedWindow('image', cv.WINDOW_NORMAL) it allows you to resize the window
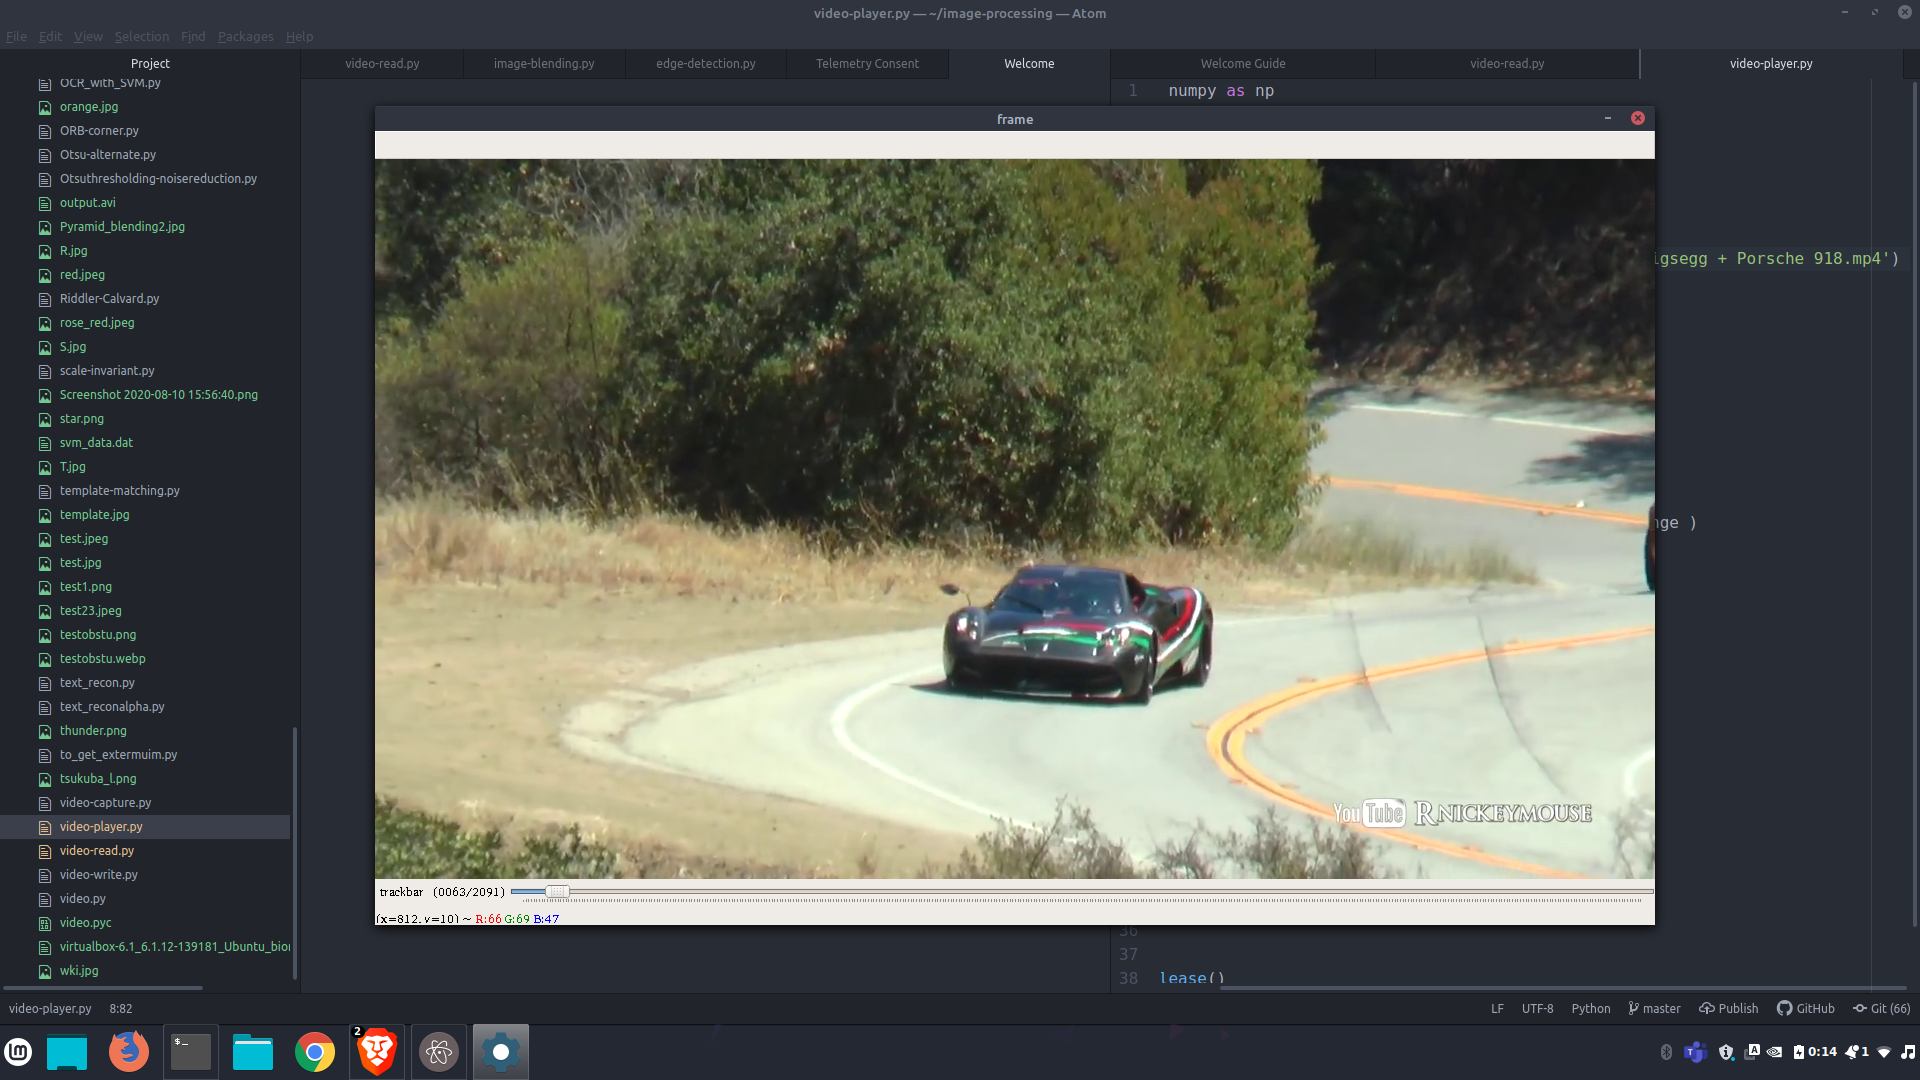
cv2.VideoCapture(str) takes path to a video file or 0 for webcam it returns a stream image which can then be read into matrix and displayed using cv2.imshow((str),matrix)
cv2.cvtColor(frame, cv2.COLOR_BGR2GRAY) this converts the channel to B/W (don't get scared newbies what is channel its basically way you define color like RGB)

Opencv has a function to create a trackbar you can call a function on change
def onChange(trackbarValue):
  global cap
  cap.set(1,trackbarValue)
cv2.createTrackbar( 'trackbar', 'frame', 0, length, onChange)
and then you set the cap to a certain value
For pausing I basically stopped the cap reading new images
So s pause and r runs
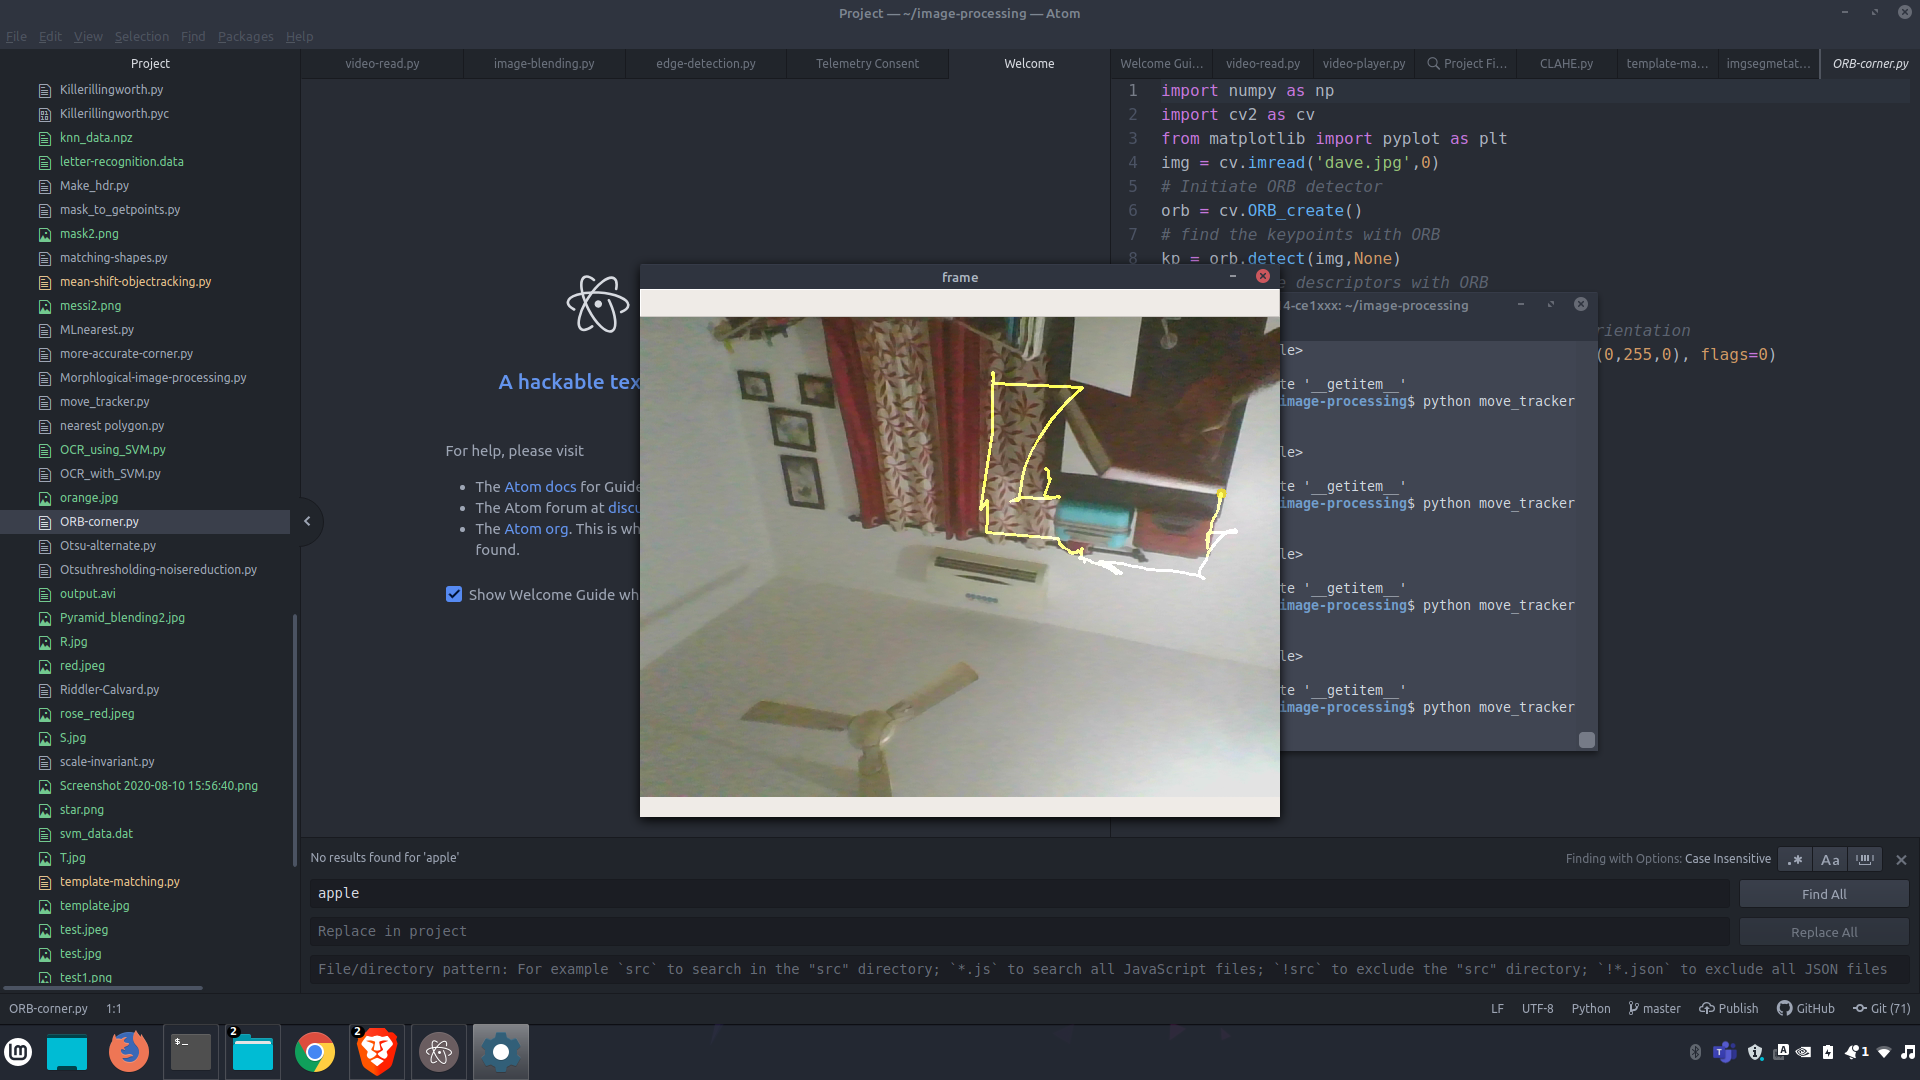
In opencv we can use functions cv2.line() cv2.rectangle() cv2.circle() cv2.ellipise() cv2.polylines()
for more info on the functions go to docs
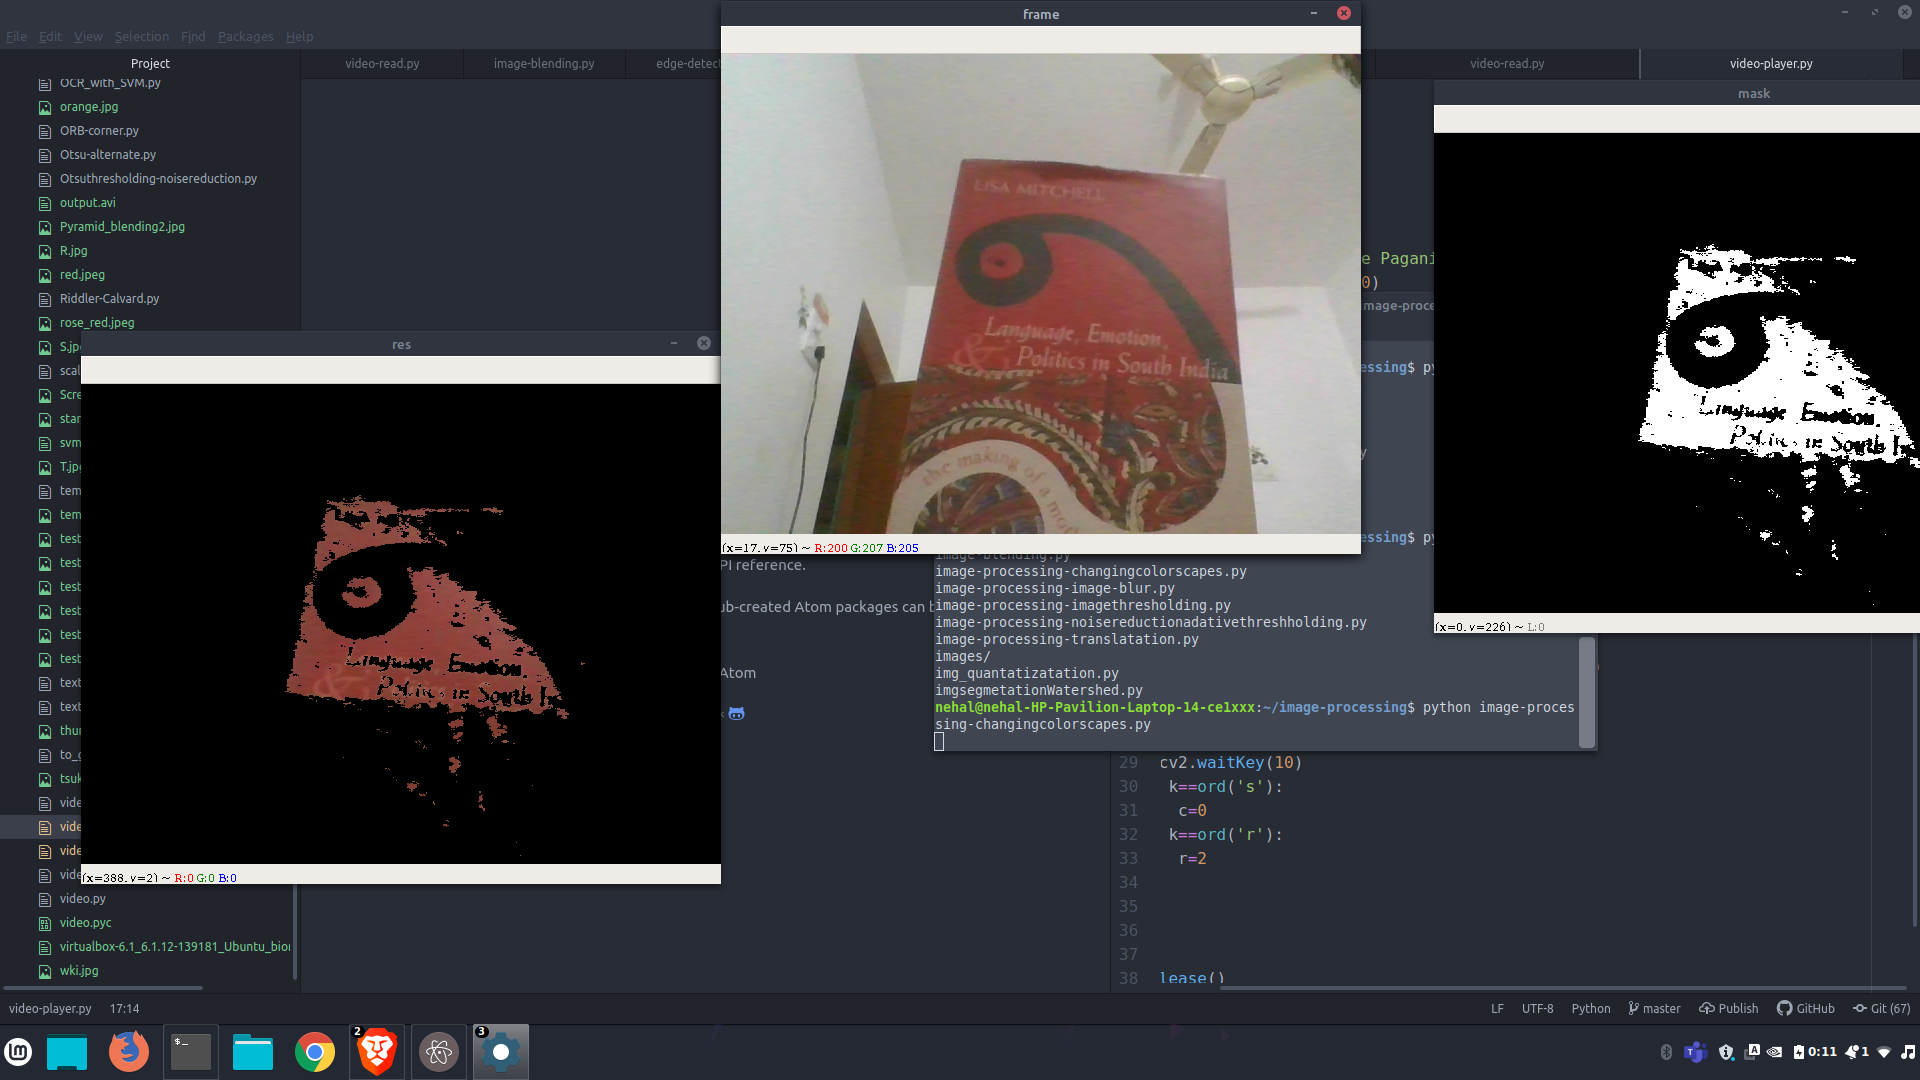
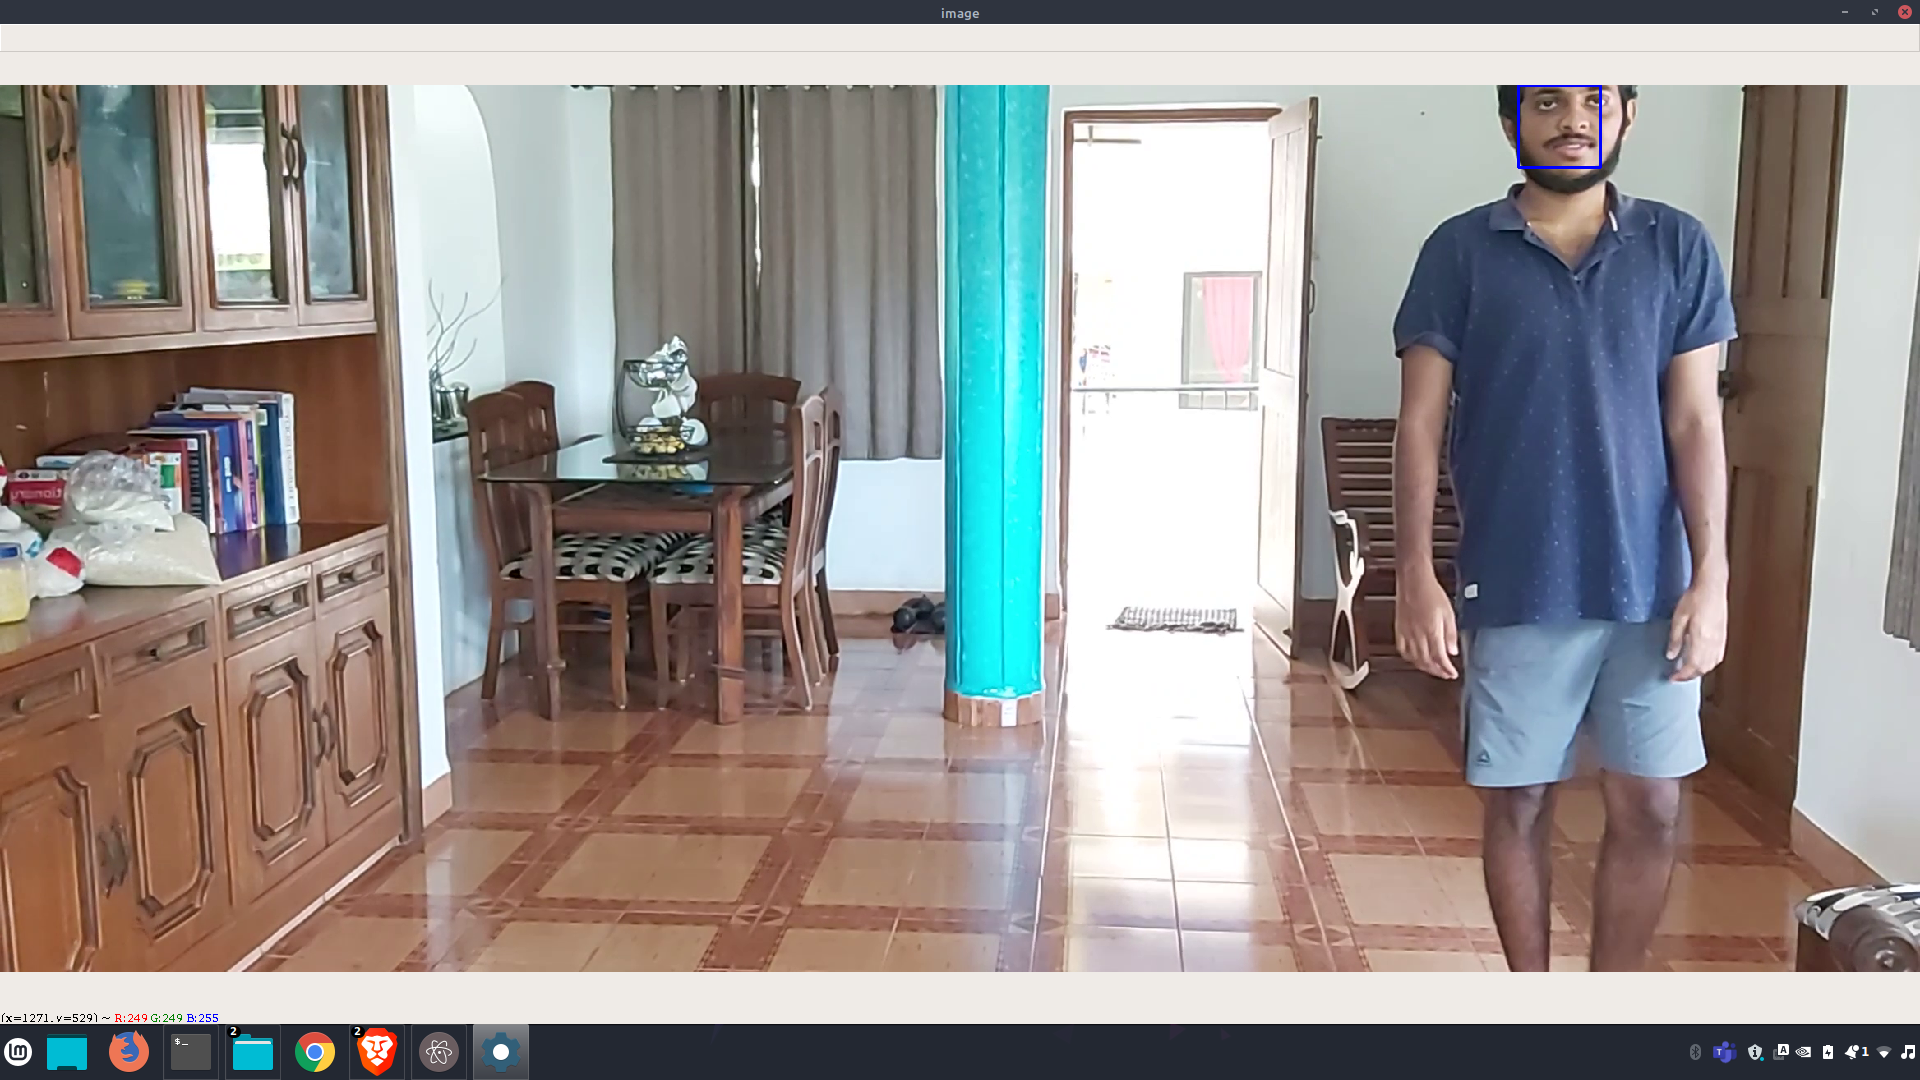
So we convert the image to HSV cv2.cvtColor(frame, cv2.COLOR_BGR2HSV) we changed to HSV because it gives us a range of colors with change of value.
We make a image thresholding cv2.inRange(hsv, lower_blue, upper_blue) with a range and then we and with every pixel of both cv2.bitwise_and() it with the image so results in image only with the object
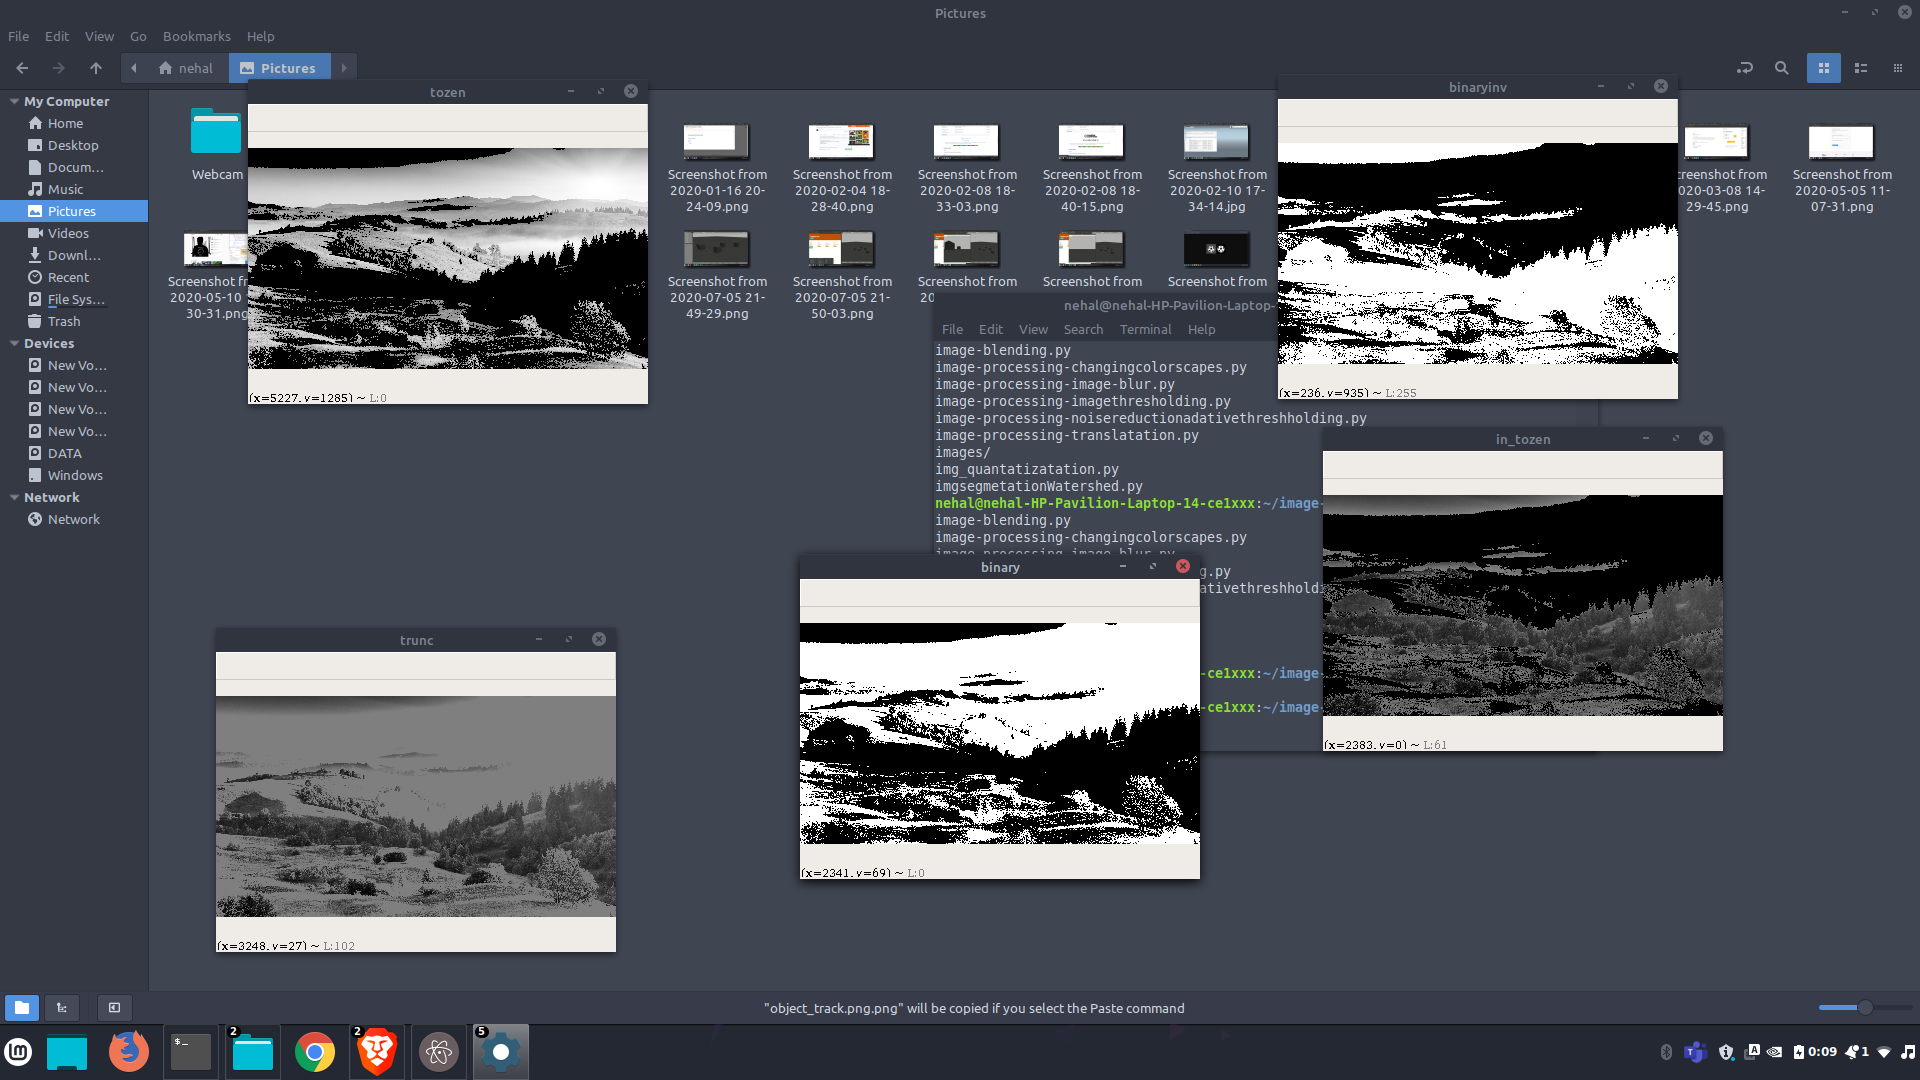
In Opencv we set a pixel value with respect to another pixel value like
if its less than a certain value it will be set to certain if not then to another
if x>125: then x=225 else x=0
There are various ones like THRESH_BINARY,THRESH_BINARY_INV,THRESH_TRUNC,THRESH_TOZERO,THRESH_TOZERO_INV
This is a method where we decide the max value based on region of image
cv2.adaptiveThreshold(img,255,cv2.ADAPTIVE_THRESH_GAUSSIAN_C,\cv2.THRESH_BINARY,11,2)
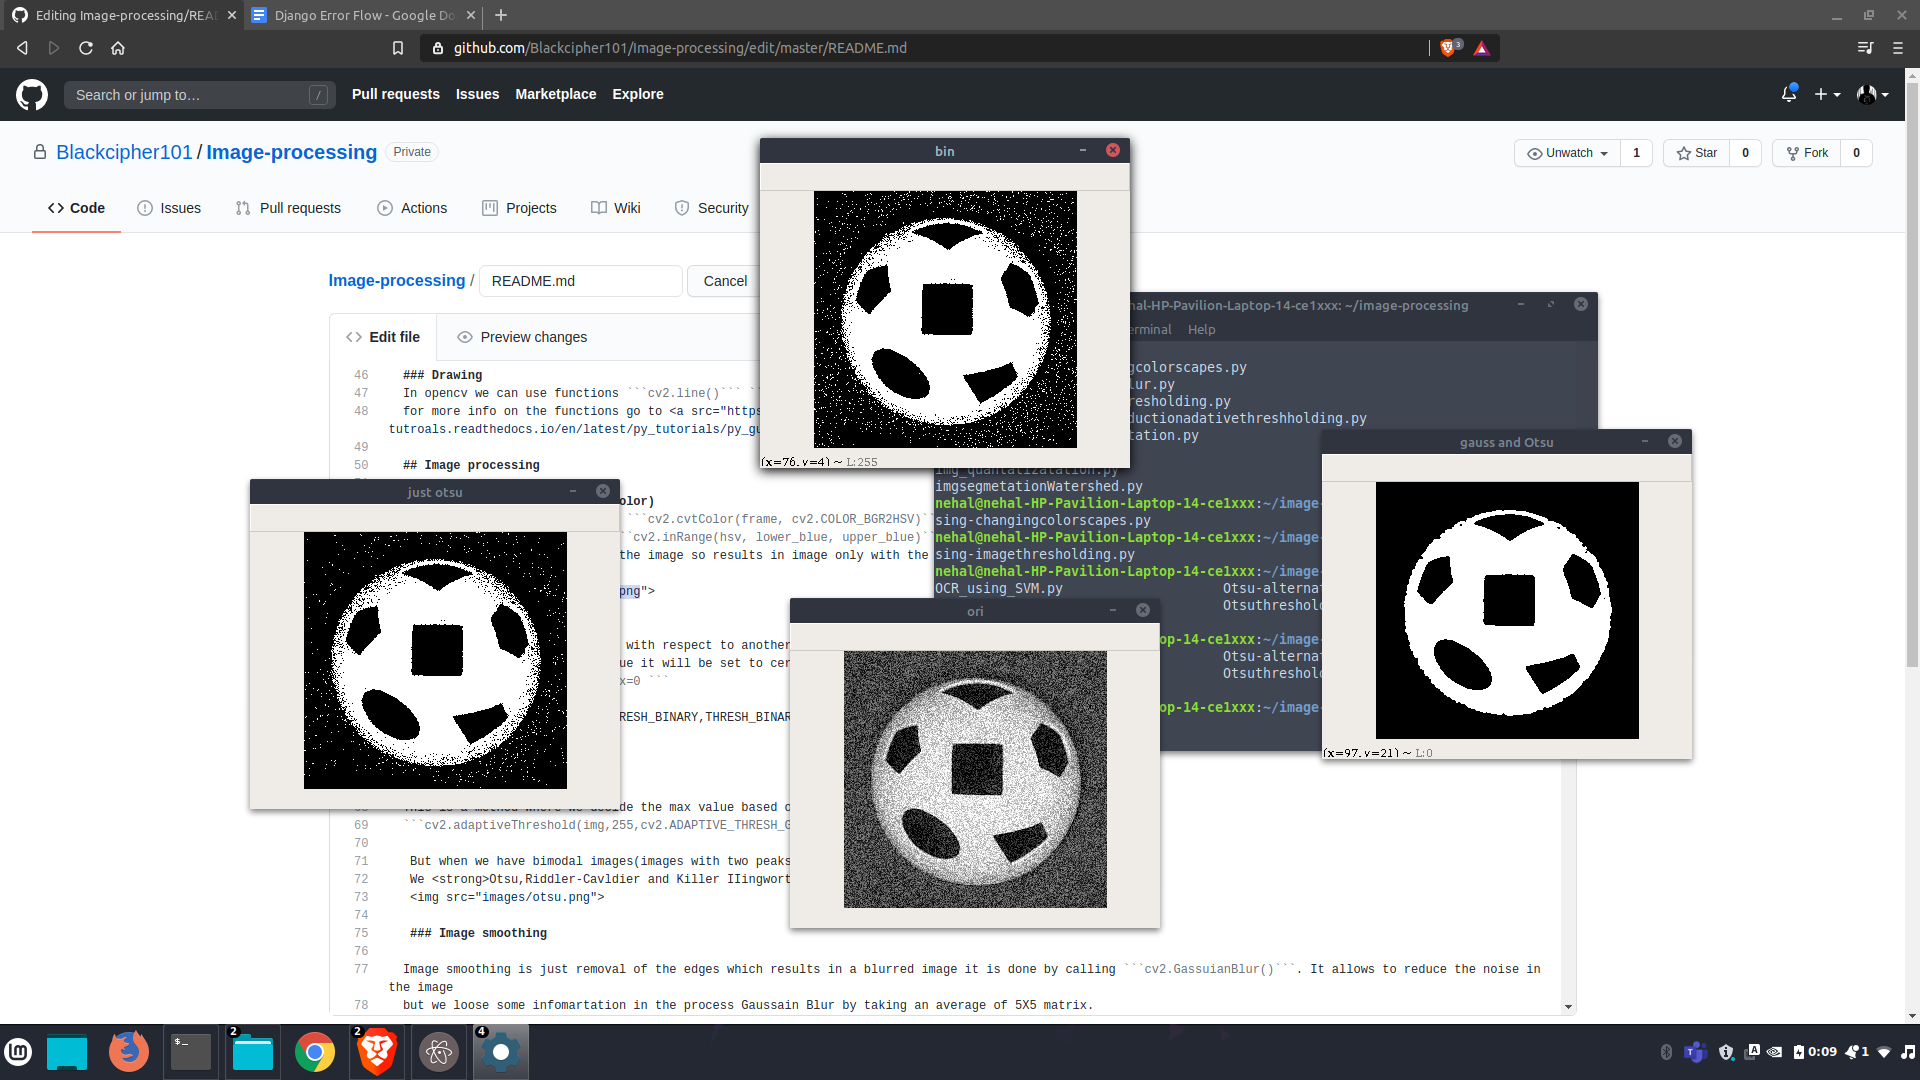
But when we have bimodal images(images with two peaks in a histogram) We Otsu,Riddler-Cavldier and Killer IIingworthmethod.
Image smoothing is just removal of the edges which results in a blurred image it is done by calling cv2.GassuianBlur(). It allows to reduce the noise in the image
but we loose some infomartation in the process Gaussain Blur by taking an average of 5X5 matrix.
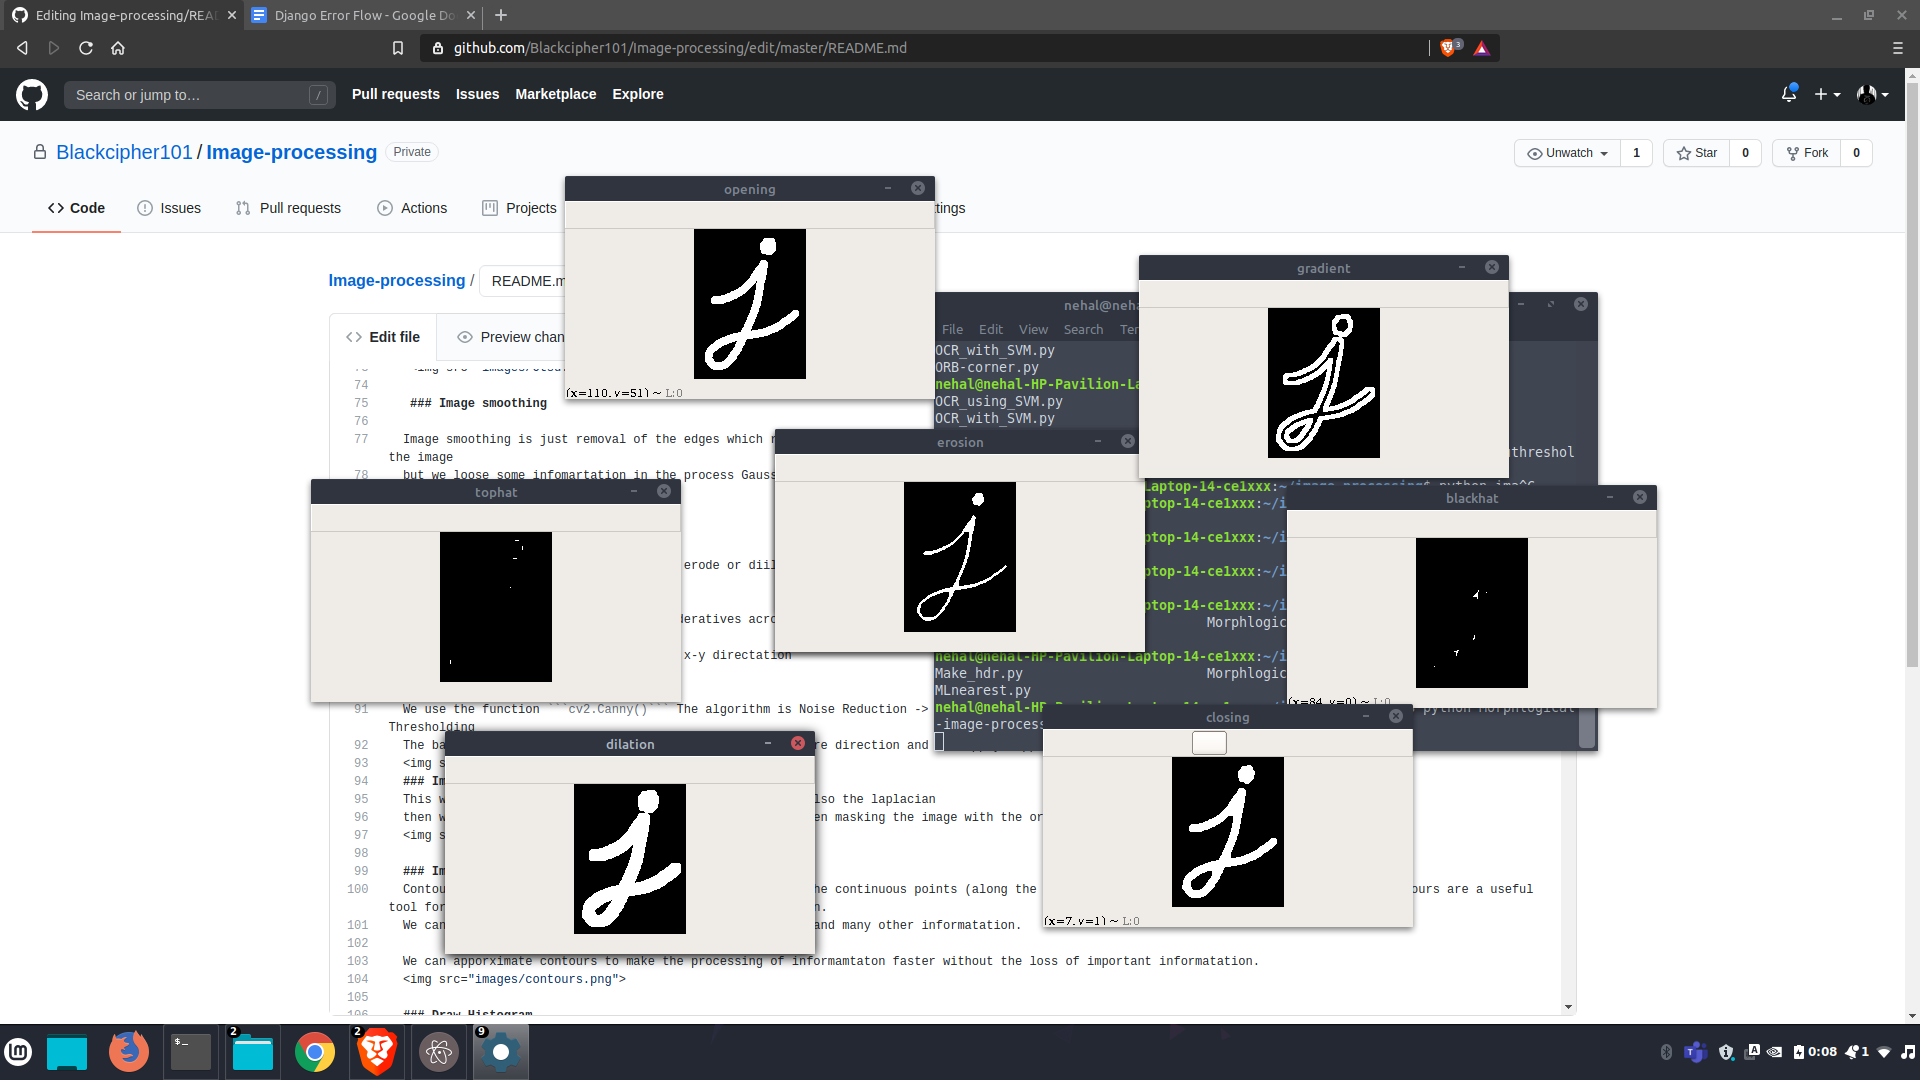
Its a opertation on we do on binary to erode or diilate images
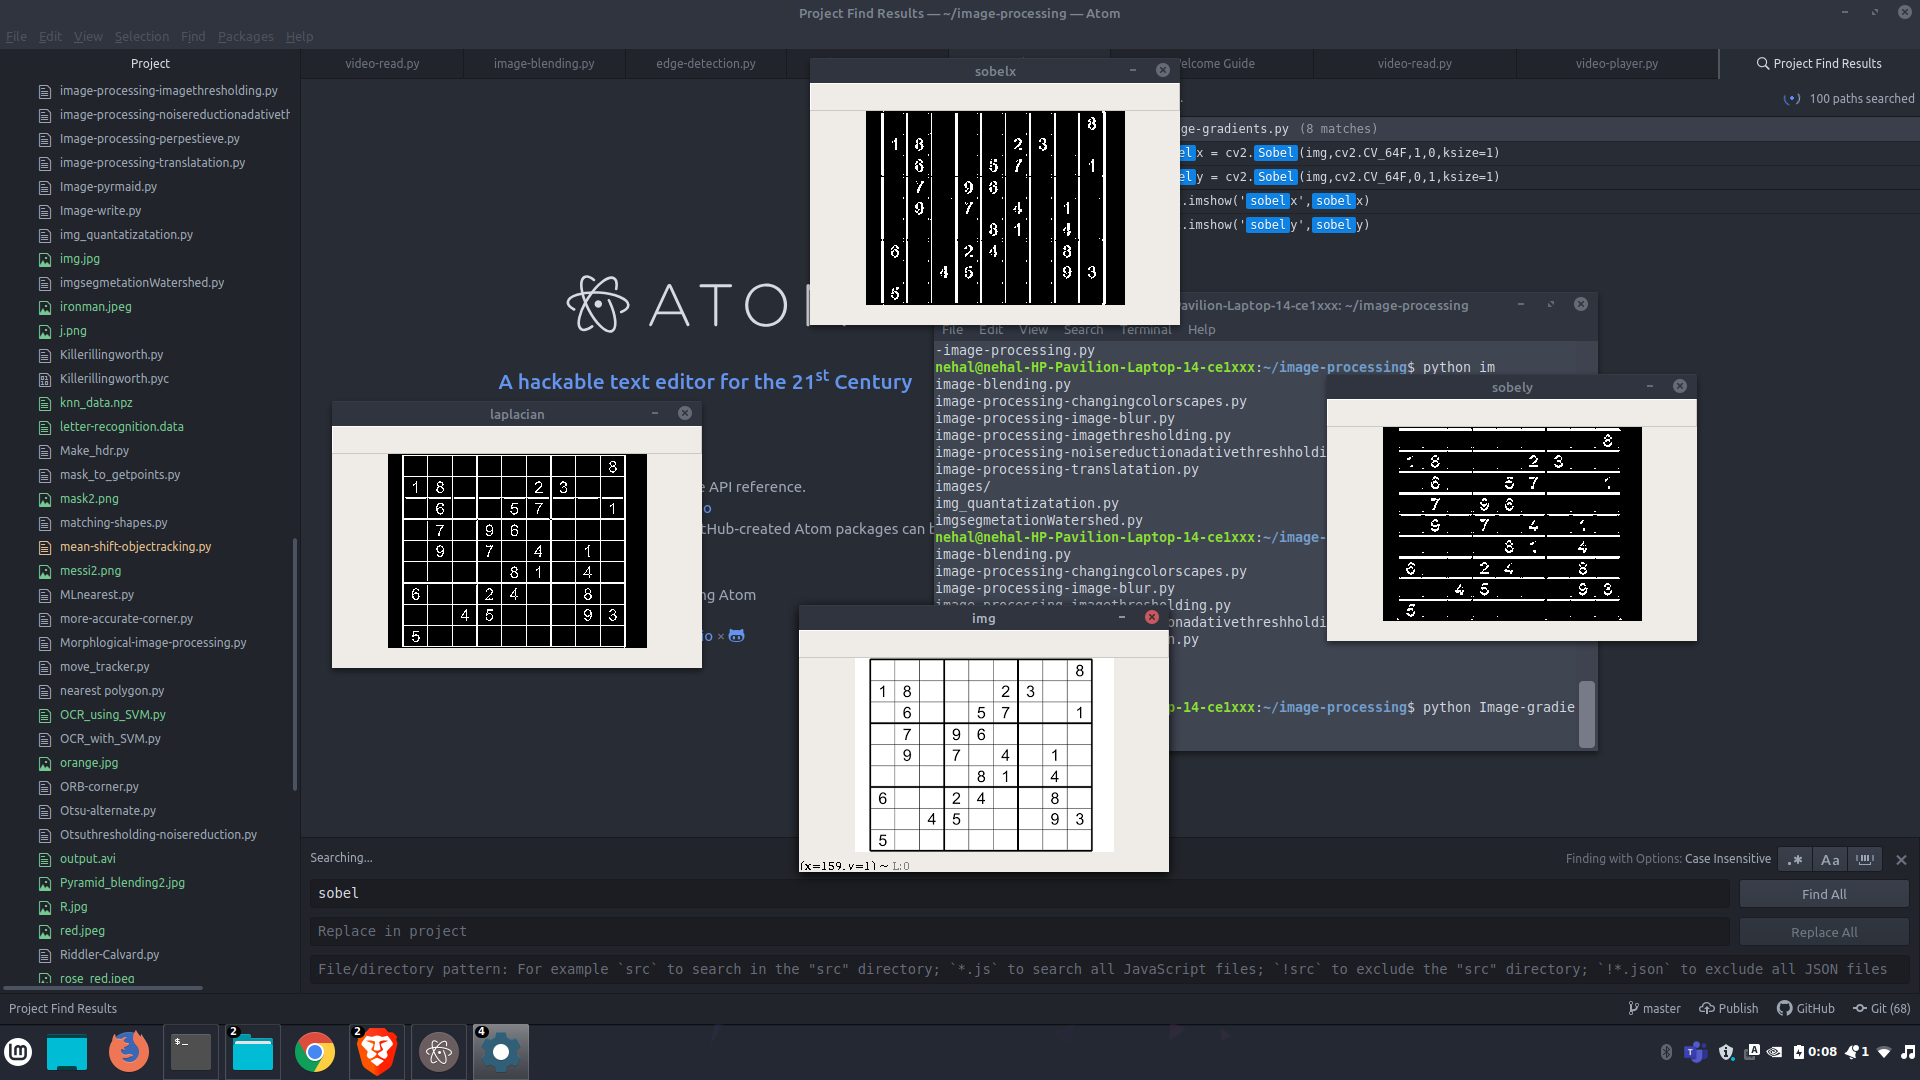
We usecv2.sobel() to find image deratives across a direction it gives us the edges in one direction
We also get edges in both direction in x-y directation
We use the function cv2.Canny() The algorithm is Noise Reduction -> Finding Intensity Gradient of the Image -> Non-maximum Suppression -> Hysteresis Thresholding
The basic method is to apply image in gradient in 4 or more direction and the apply suppersion and then find the sure edges.

This we make images arrays by downscaling the image and also the laplacian
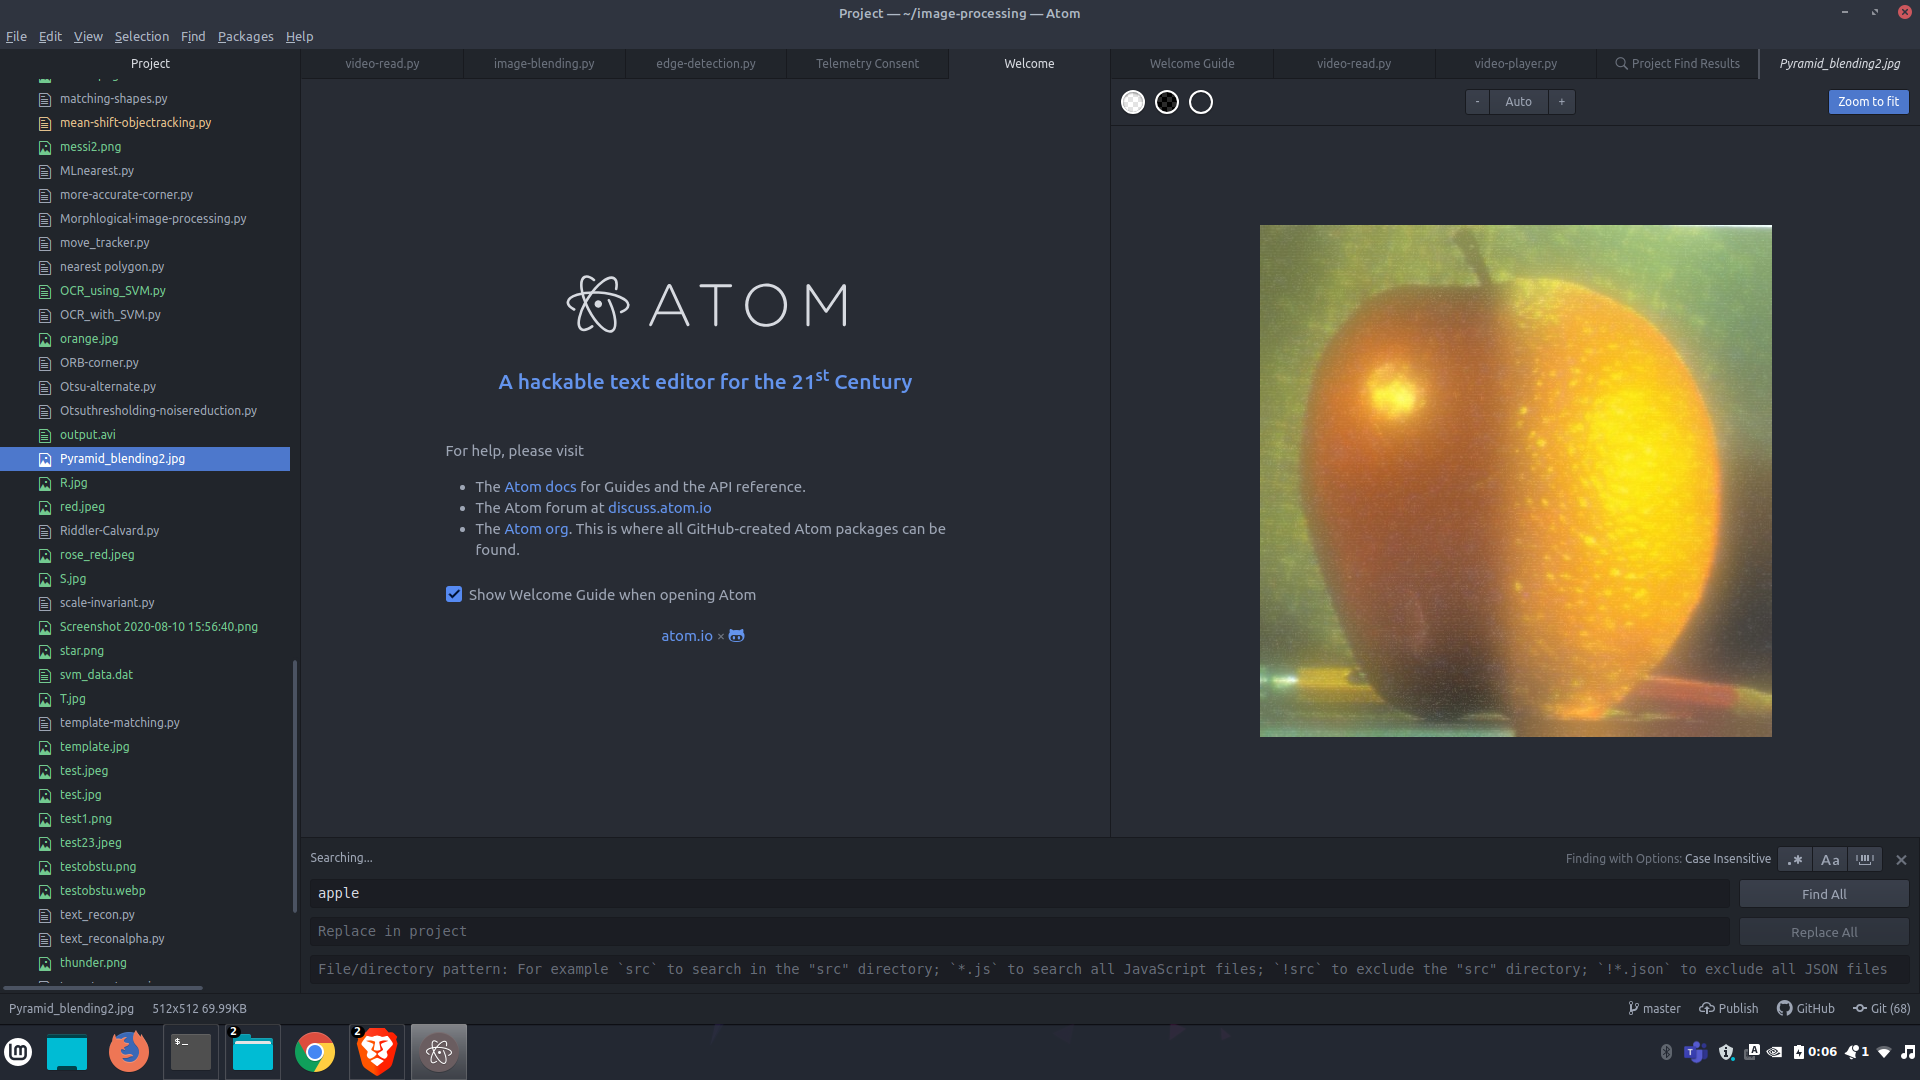
then we keep adding the half of both the laplacian and then masking the image with the orginal
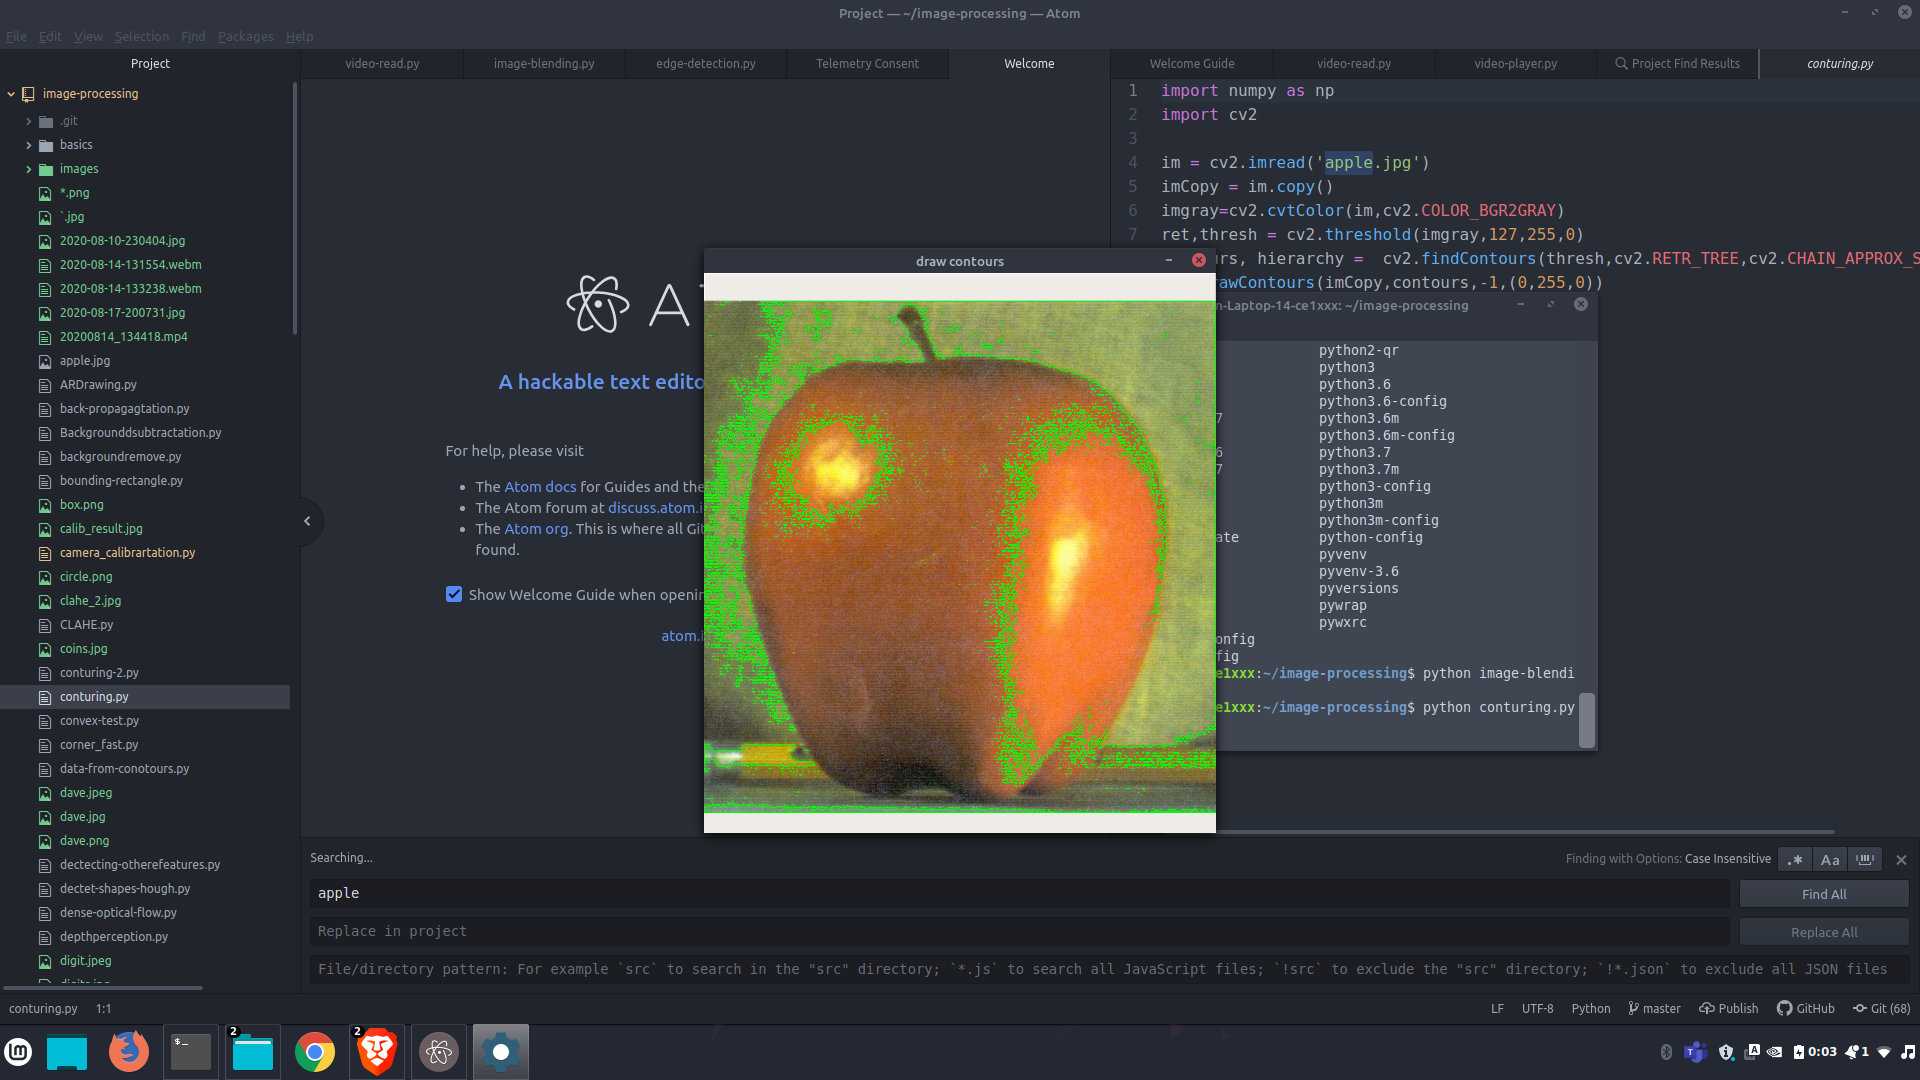
Contours can be explained simply as a curve joining all the continuous points (along the boundary), having same color or intensity. The contours are a useful tool for shape analysis and object detection and recognition. We can use these contours to find moments,area,perimeter and many other informatation.
We can apporximate contours to make the processing of informamtaton faster without the loss of important informatation.
You can consider histogram as a graph or plot, which gives you an overall idea about the intensity distribution of an image. It is a plot with pixel values (ranging from 0 to 255, not always) in X-axis and corresponding number of pixels in the image on Y-axis.

The image have a better as it improves the image by adding pixels whose frecquency is less.
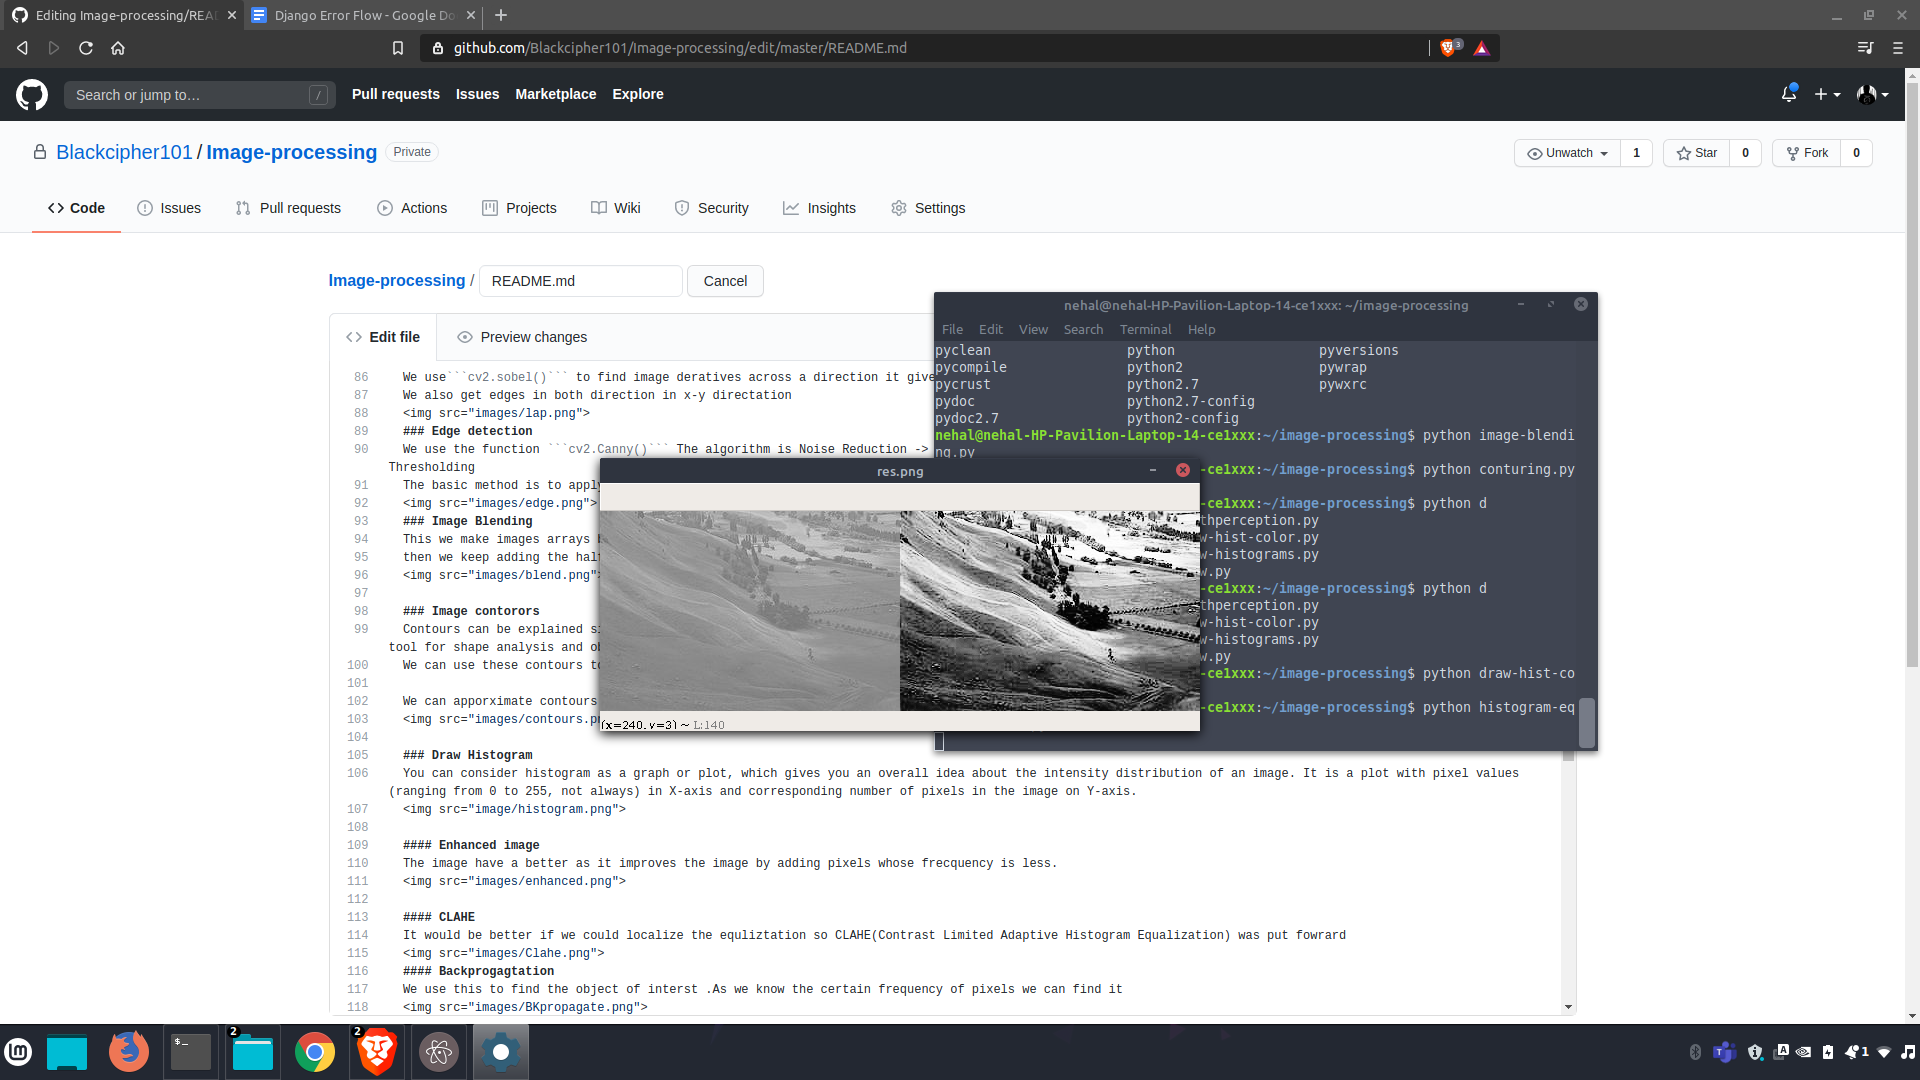
It would be better if we could localize the equliztation so CLAHE(Contrast Limited Adaptive Histogram Equalization) was put fowrard
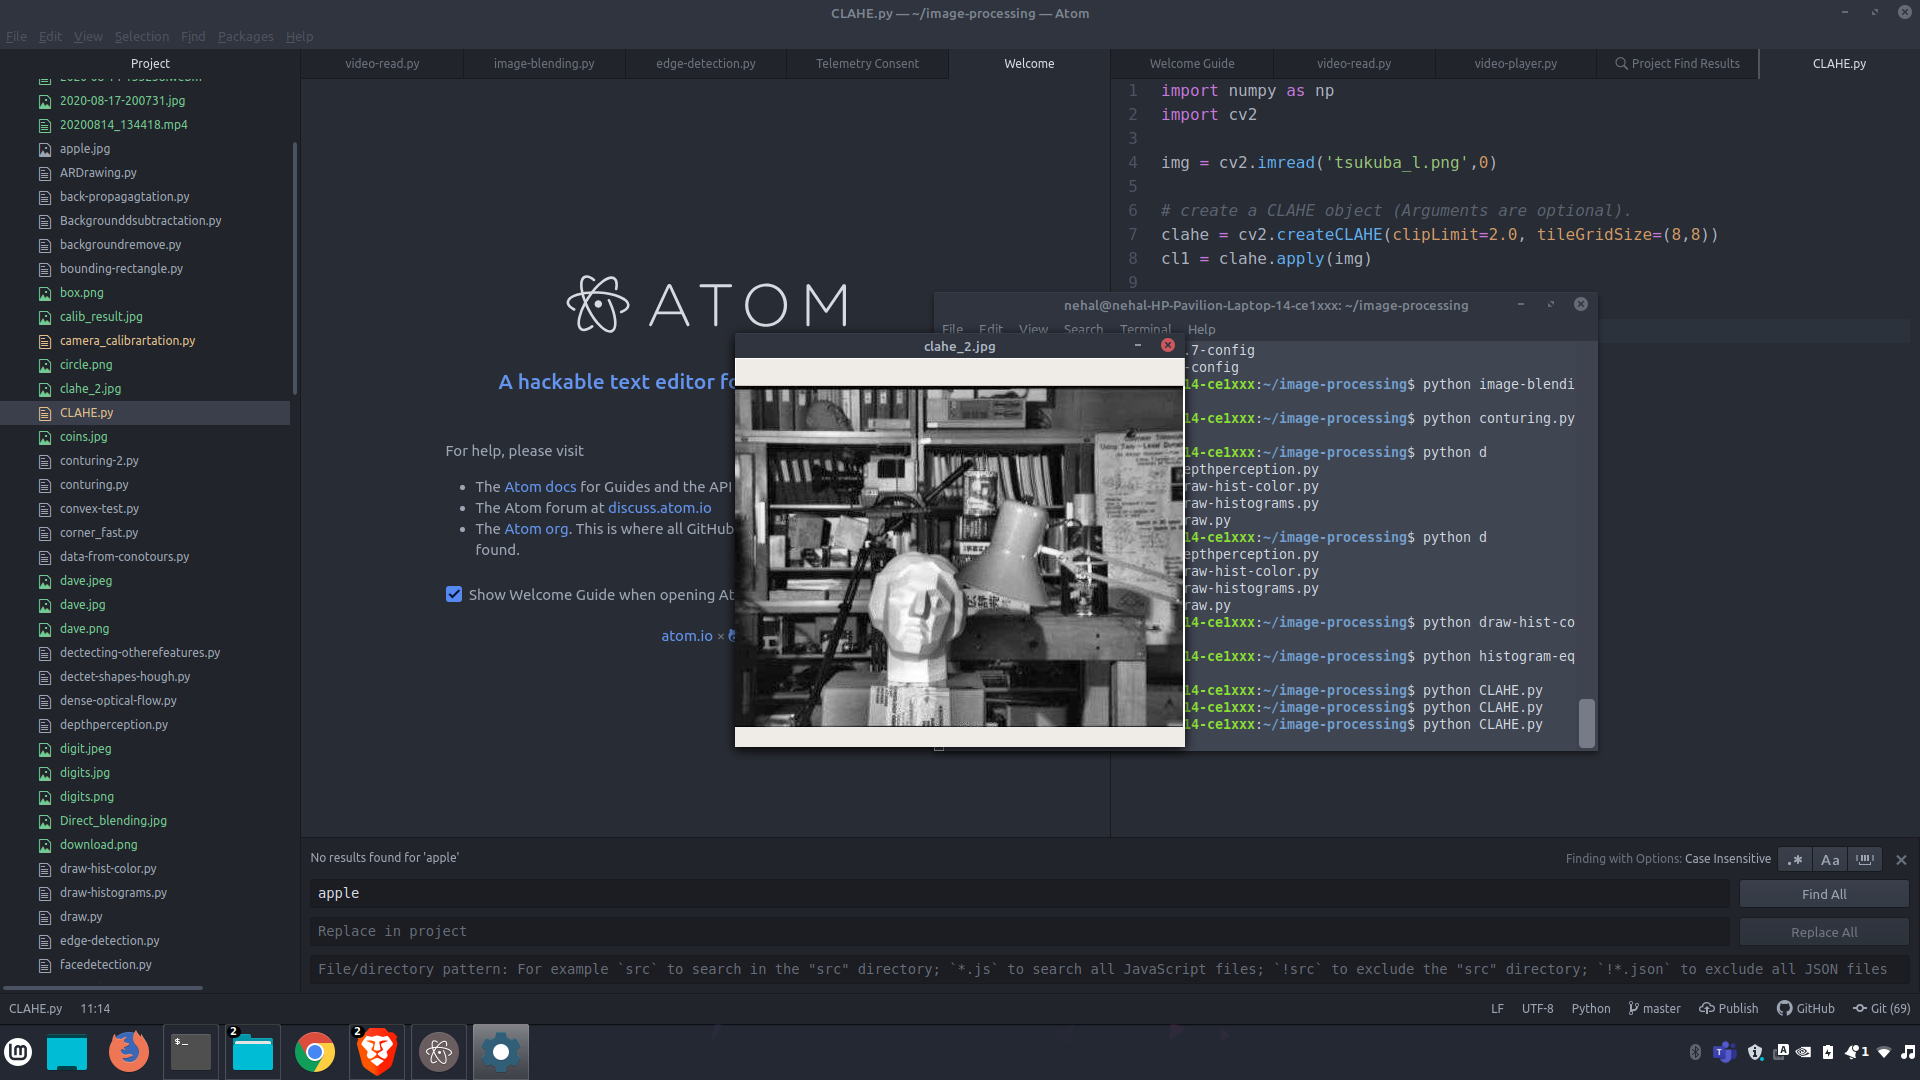
We use this to find the object of interst .As we know the certain frequency of pixels we can find it
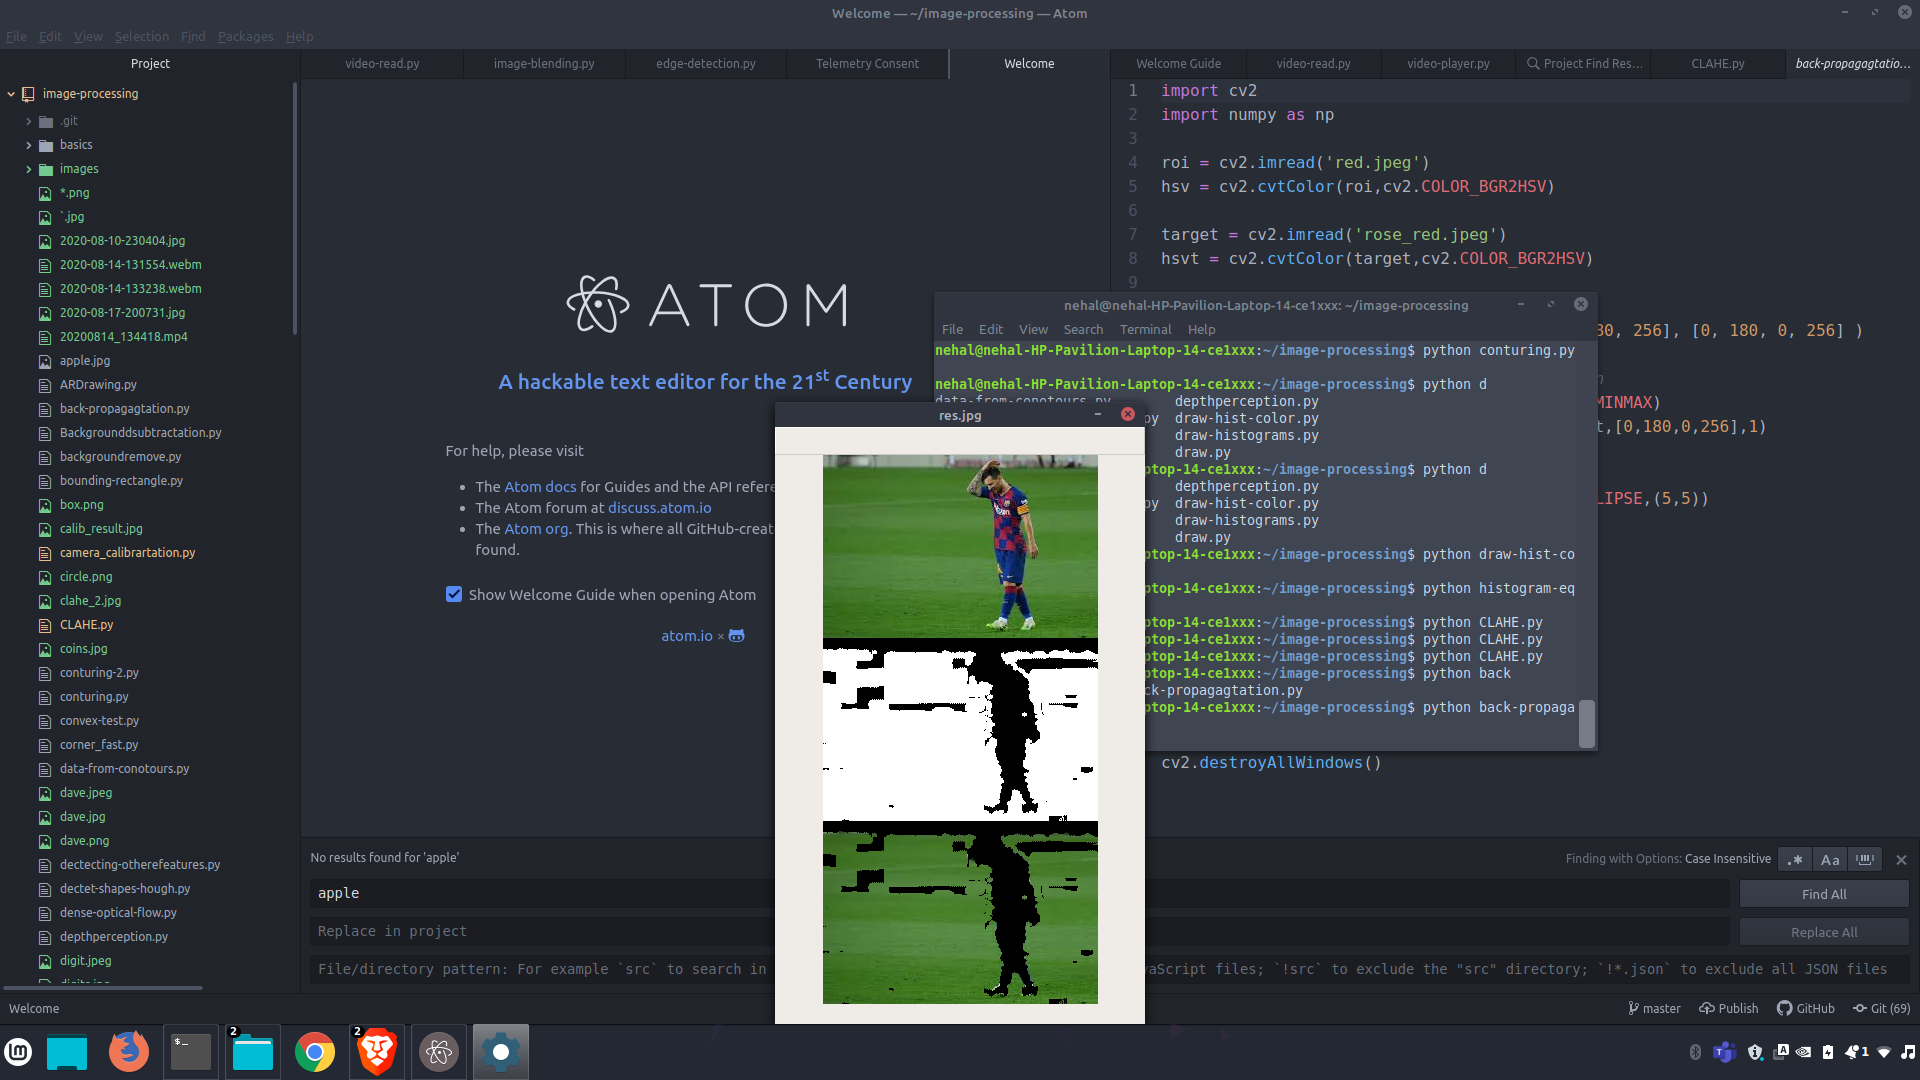
We can find certainpart of a image by matching the image to a current template
They have various methods but most of the times cv2.TM_CCOEFF works best

We have to segment the images into its smallest constuient parts
Algorithm
Threshold->Morphlogical opertations->Transforms->Mask
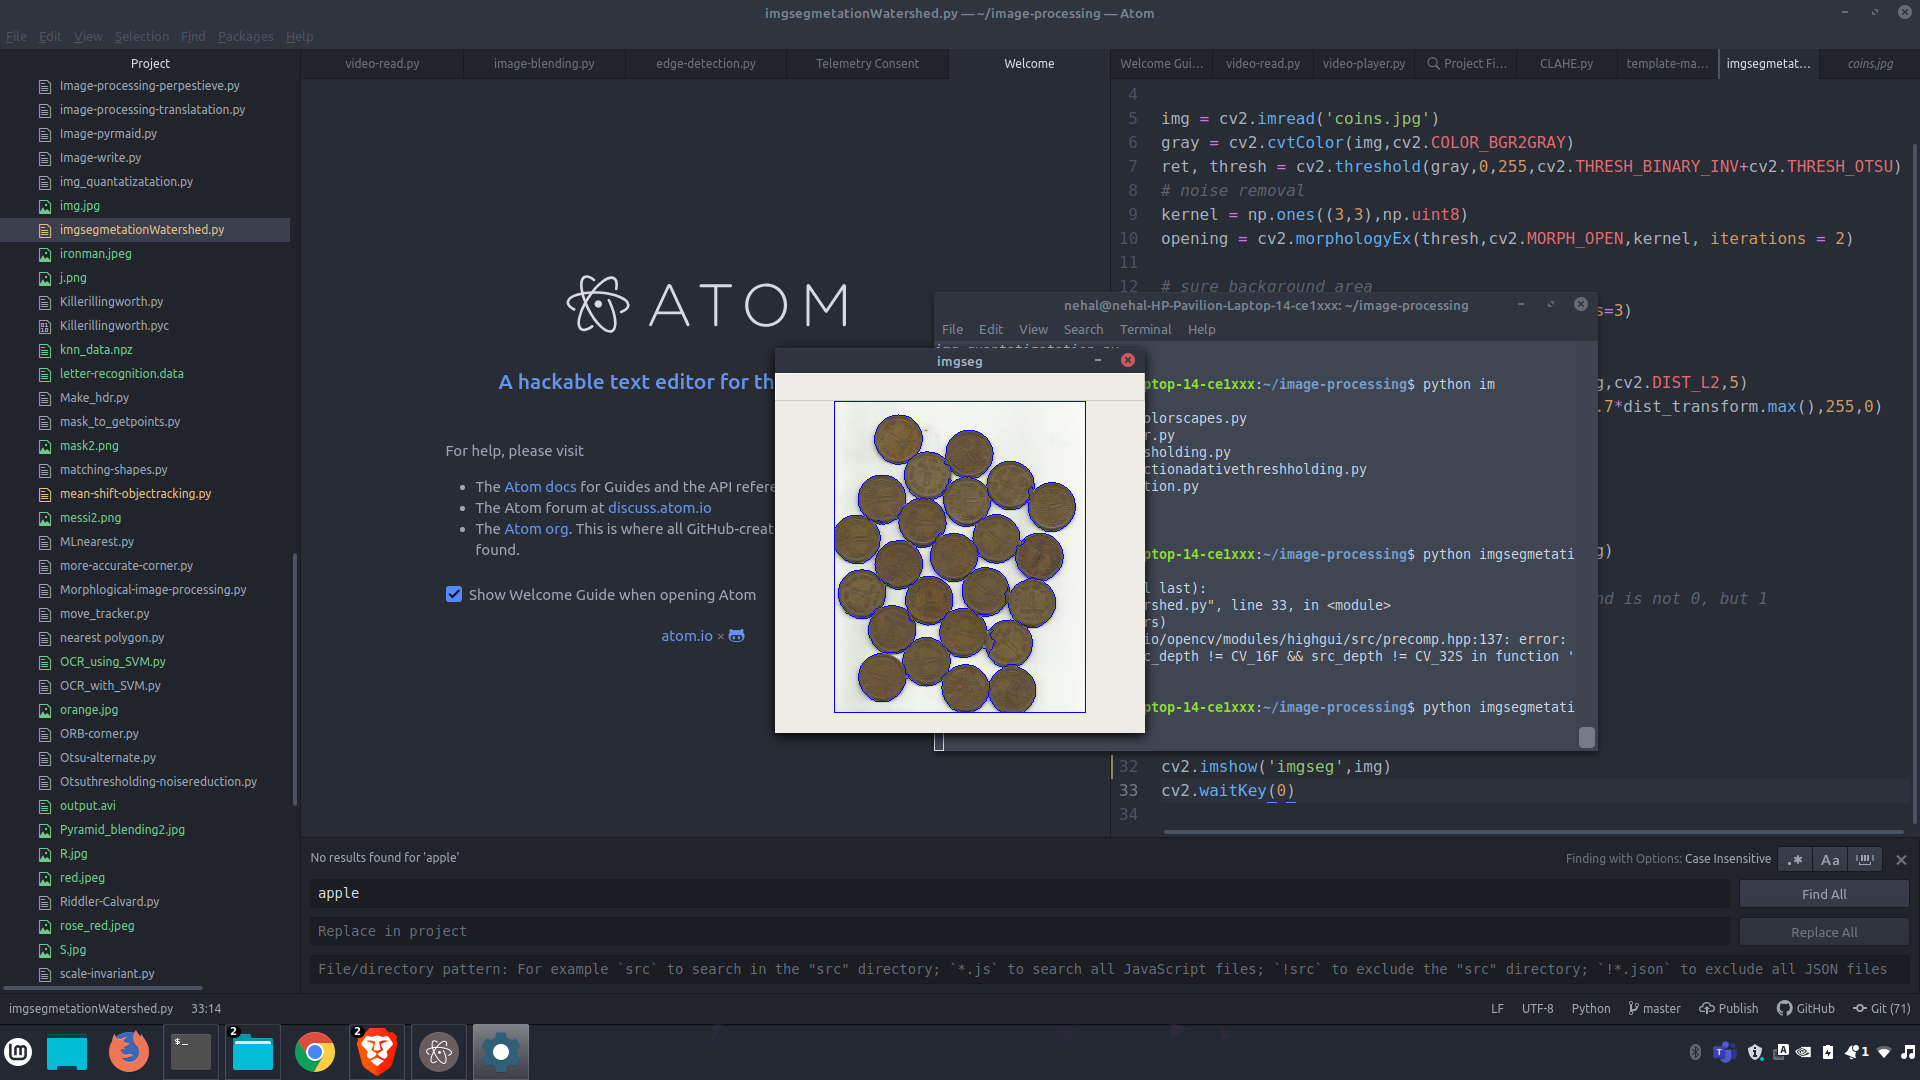
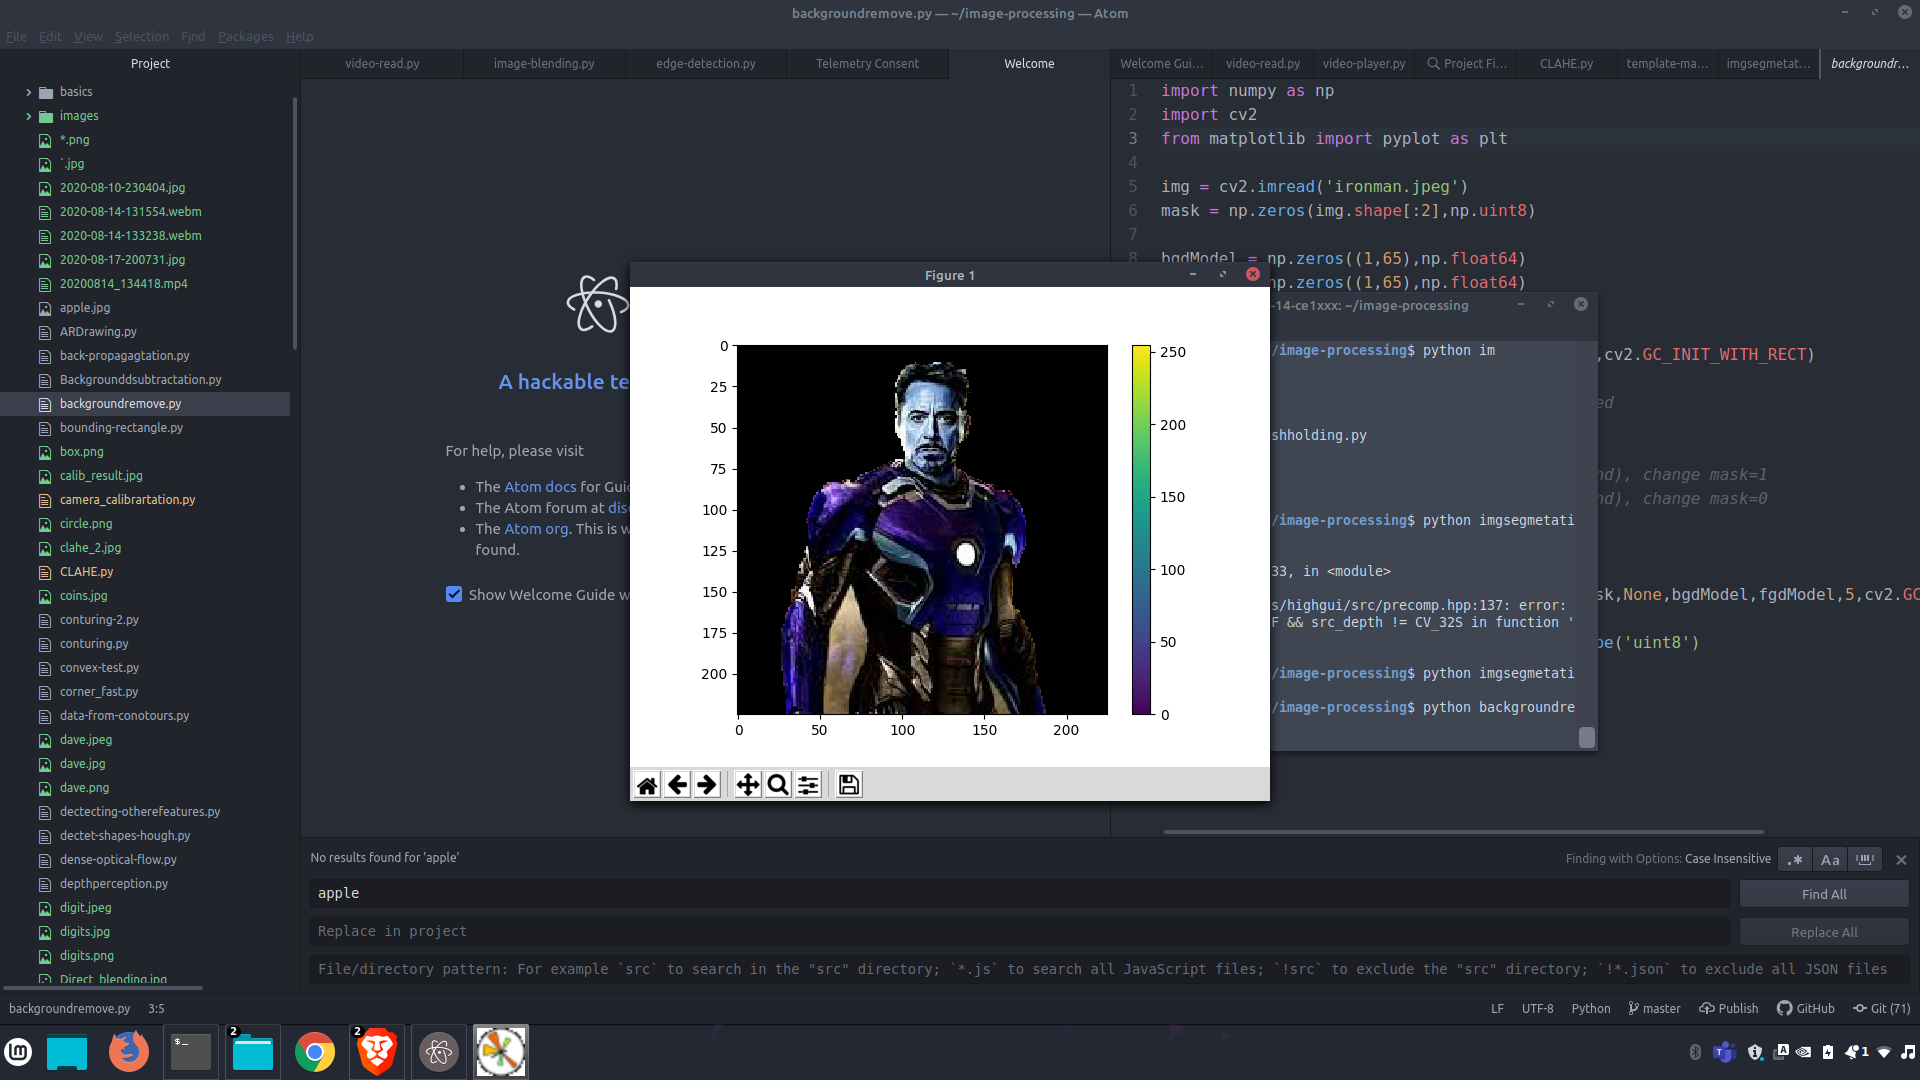
We use the Grabcut algorithm to remove the backgroung image and also apply mask to improve the accuracy
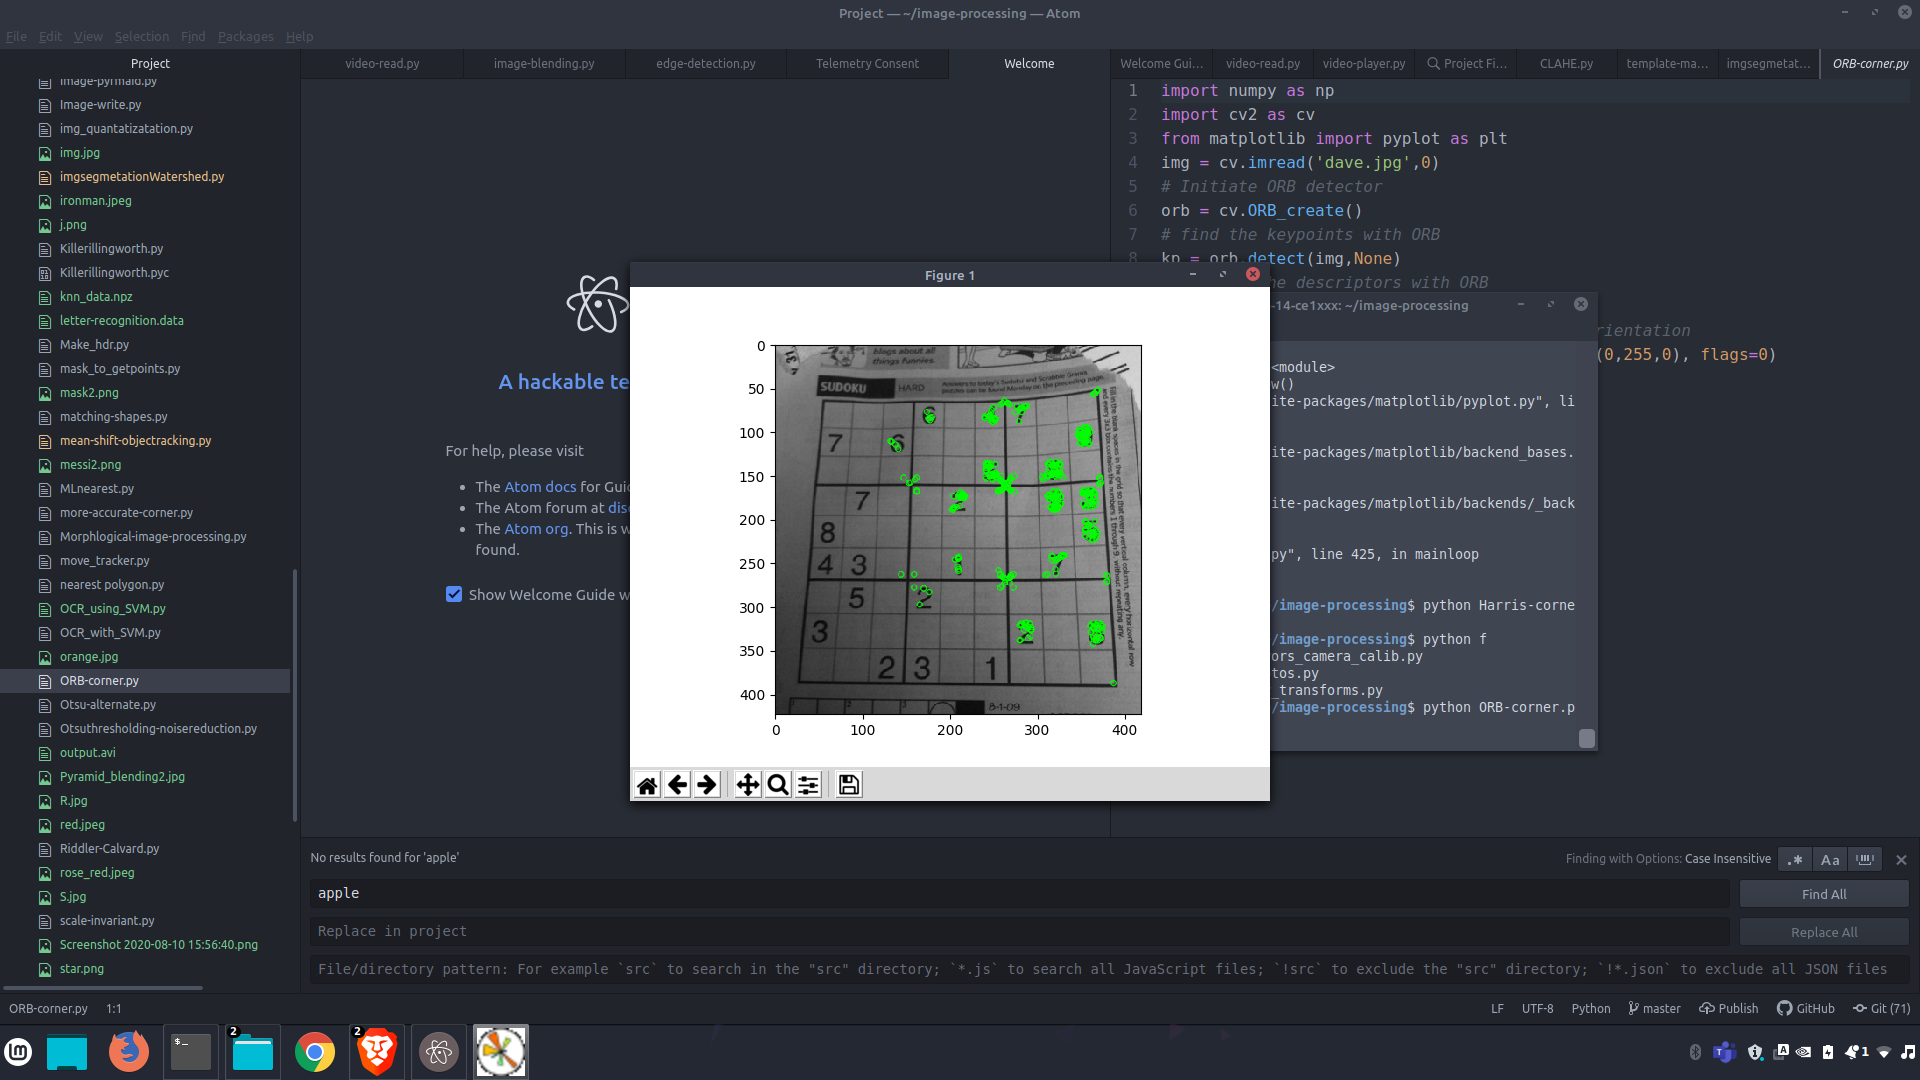
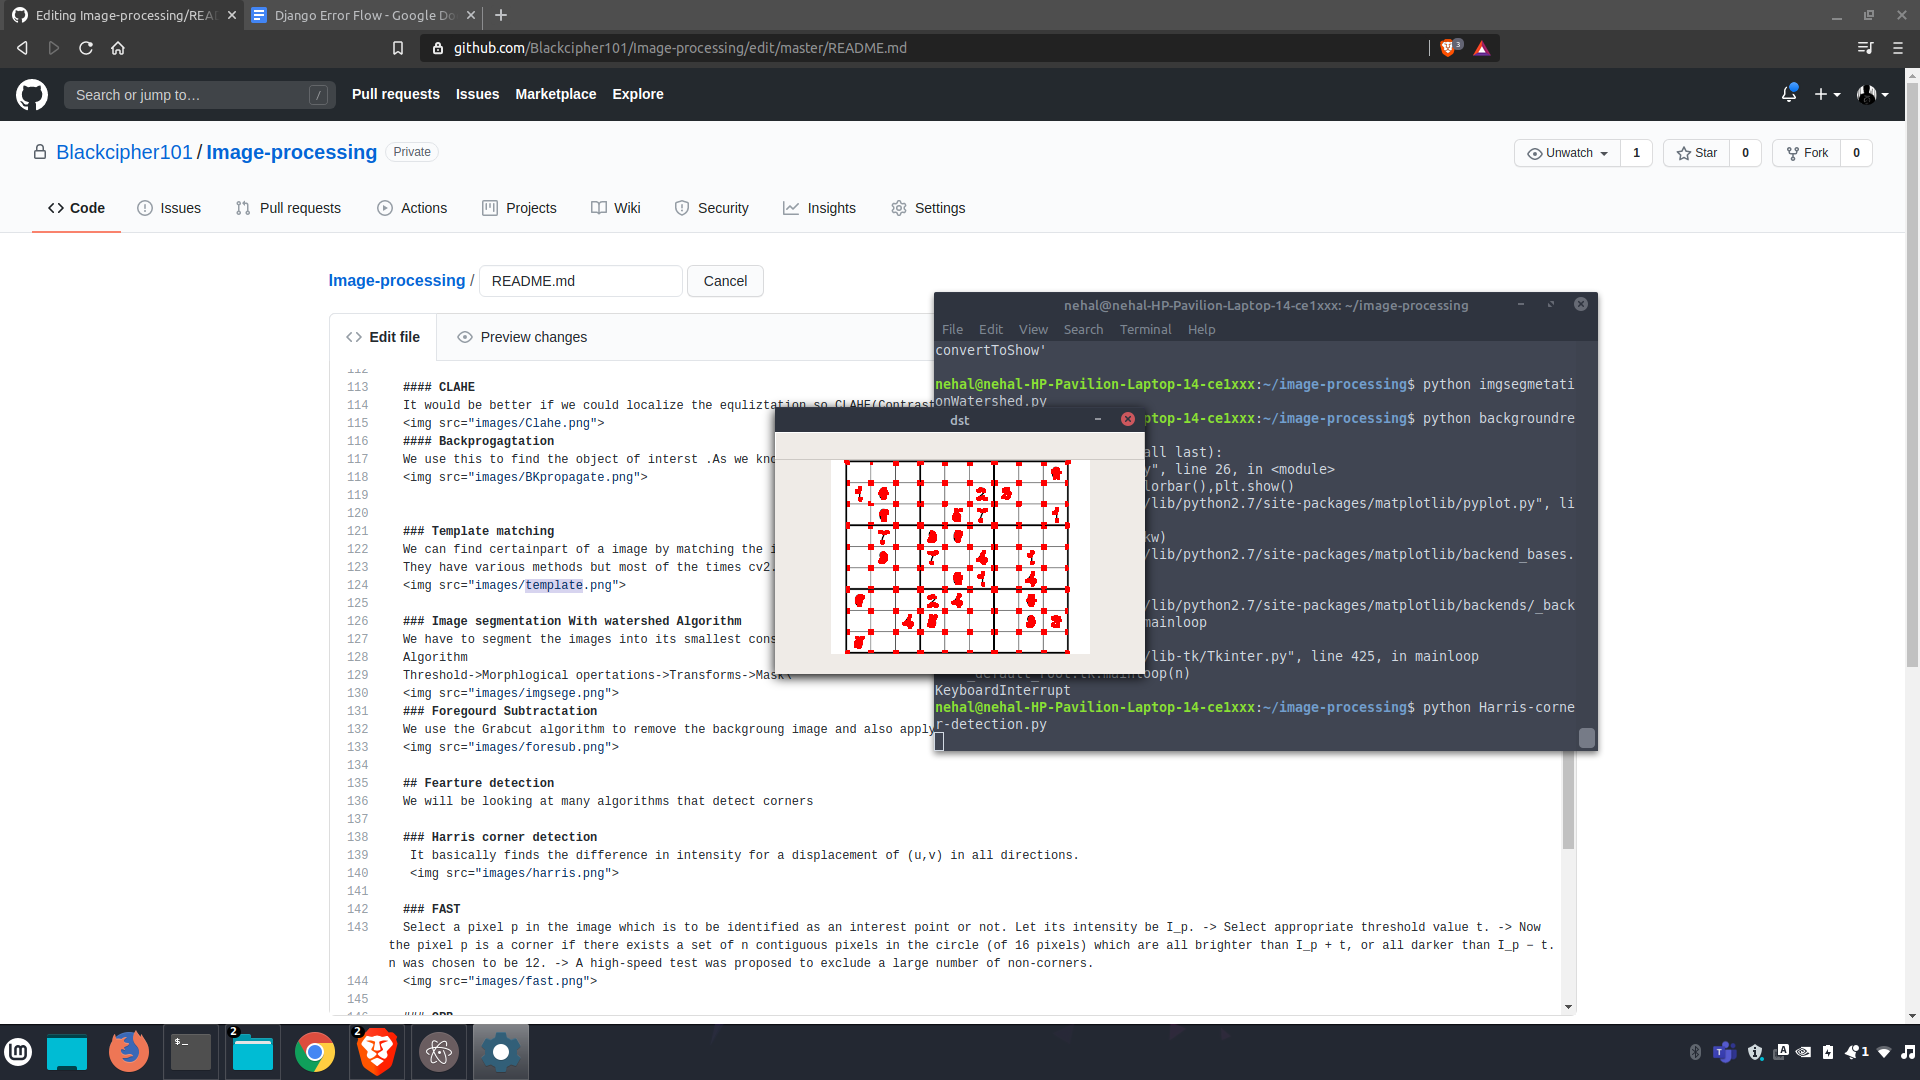
We will be looking at many algorithms that detect corners
It basically finds the difference in intensity for a displacement of (u,v) in all directions.
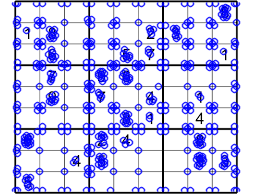
Select a pixel p in the image which is to be identified as an interest point or not. Let its intensity be I_p. -> Select appropriate threshold value t. -> Now the pixel p is a corner if there exists a set of n contiguous pixels in the circle (of 16 pixels) which are all brighter than I_p + t, or all darker than I_p − t. n was chosen to be 12. -> A high-speed test was proposed to exclude a large number of non-corners.
We have a perfect mixture and also the point its not patented
## Video analysisThe intuition behind the meanshift is simple. Consider you have a set of points. (It can be a pixel distribution like histogram backprojection). You are given a small window ( may be a circle) and you have to move that window to the area of maximum pixel density (or maximum number of points).
Optical flow is basically tracking the apparent motion on a object and its patterns to do it we use Lucas-Kanade method.We have seen an assumption before, that all the neighbouring pixels will have similar motion. Lucas-Kanade method takes a 3x3 patch around the point. So all the 9 points have the same motion. We can find (f_x, f_y, f_t) for these 9 points. So now our problem becomes solving 9 equations with two unknown variables which is over-determined. A better solution is obtained with least square fit method. We can track features like corners but when we track a songle corner we can draw in air with our fingers :P
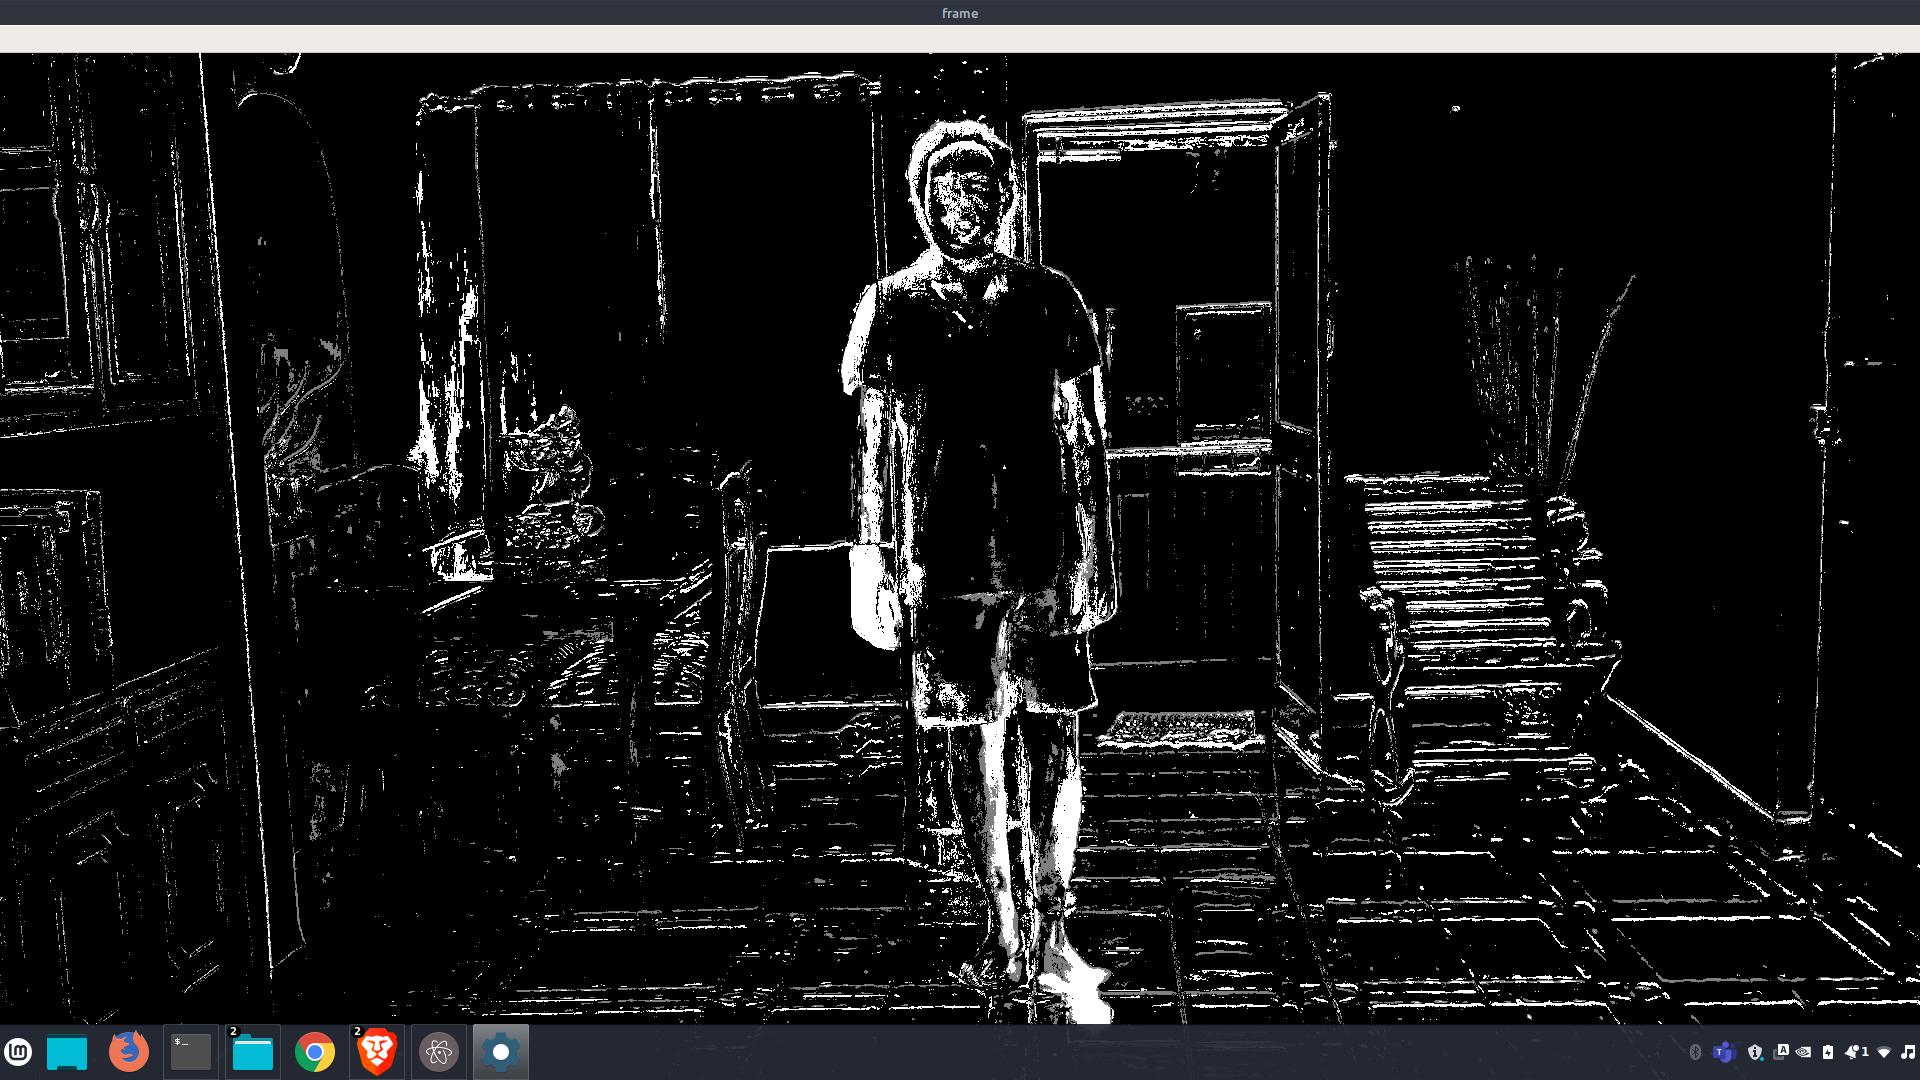
### Background subtracation We subtract the fore ground from the moving objects so we can track them. We can do this using three methods BackgroundSubtractorMOG,BackgroundSubtractorMOG2,BackgroundSubtractorGMG and BackgroundSubtractorGMG proves to be better as it is taken morphological image and reduced noise as a result.This explains the basic idea of ML where find the most probable answer by measuring its varience from the nearest sure dataset.
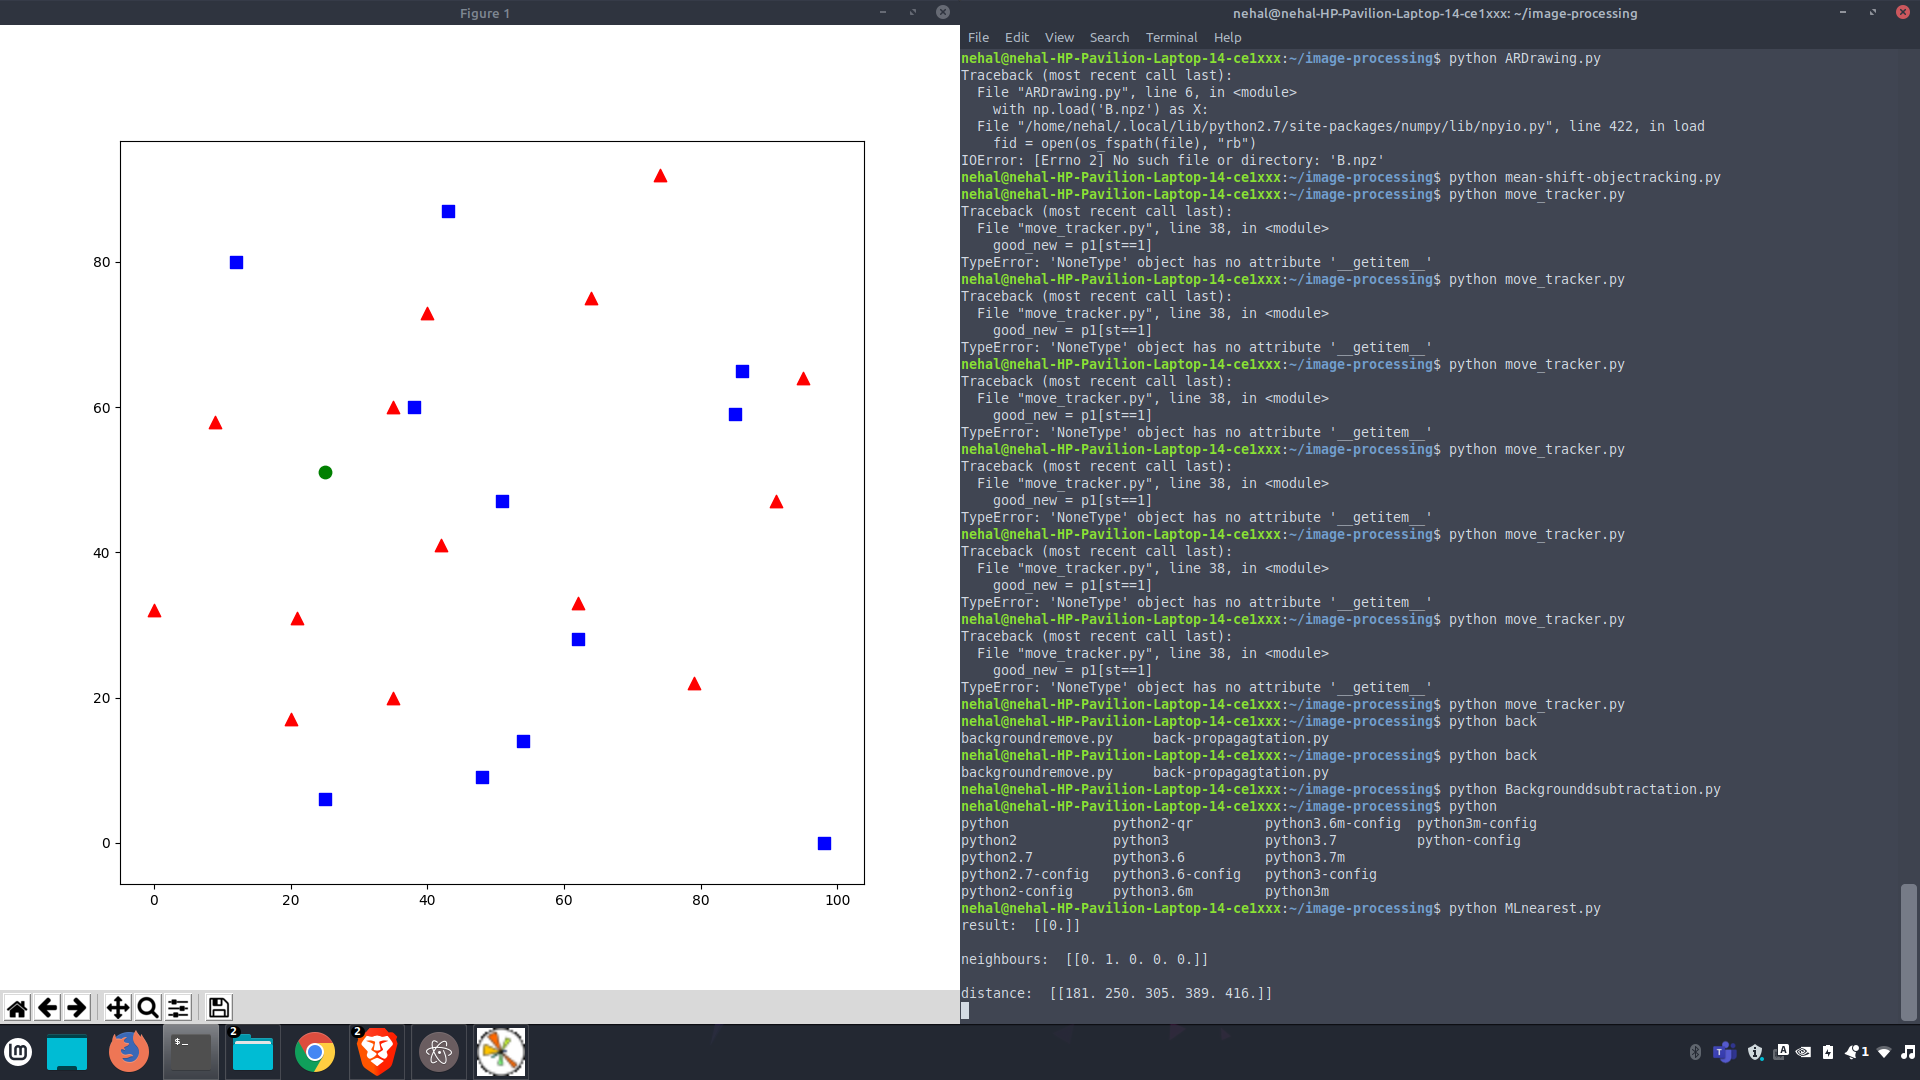
We uses kNN and pre given dataset to train and test the for testing digit detection for explantation it works here
We can quantize colors if want to drop the computation but want to still carry forward the color data. We quantize the colors using kNN clustering.

