Dashboard Link : NovyPro - My Playlists Dashboard
This dashboard analyzes my preferences on music and showcases general patterns in different types of music. It allows the public to judge me based on my music tastes. Through different statistics retrieved or predicted from the previous project (Music Extraction), this project undergoes cleaning, transforming and visualising processes of data analytics using SQL and Power Query (with a bit more Python) to create a dashboard that presents the playlist in a statistical and interesting format.
[https://github.com/Chak-C/Music_Data_Extraction/tree/master]
- Step 1 : Create a new database in SQL Server Management Studio (SSMS) and organise the needed CSV files in a folder (see my Music Extraction Project for sample outputs)
- Step 2 : Run initial processing setup file in SSMS
- Step 3 : Open the runsheet file and slowly load and clean the data in SSMS
- Step 4 : In Power BI Desktop (PBI), connect the the SSMS database and expand + transform the final table.
- Step 5 : Open power query editor & create necessary measures and columns for widget/graph visualisations.
- Step 4 : Create and adjust the visualisations as desired.
- Step 5 : Expand the dashboard to a second page once the page is overfilled with information.
- Step 6 : Add visual filters (Slicers) for deeper analysis and understanding of the data.
- Step 7 : Play test the dashboard and resolve any errors.
These queries are not included in the SQL files.
Calculating the mode key:
  ModeKey =

  MINX(
      TOPN(
          1,
          ADDCOLUMNS(
              VALUES( FinalDataset[Key] ),
              "Frequency", CALCULATE(  COUNT( FinalDataset[Key] ))
          ),
          [Frequency],
          0
      ), FinalDataset[Key]
Calculating the dynamic Y-axis maximum value for the unfiltered vs filtered spectrogram(s):
  Chart End =
  MAXX(
      SUMMARIZE(
          Notes,
          Notes[Attribute],
          "AverageFreq", AVERAGE(Notes[Value])
      ),
      [AverageFreq]
  ) * 1.1
Caclulating average kbps (from bit rate):
AVERAGE(FinalDataset[Bit rate]) / 1000
Calculating track per artist ratio:
Ratio = COUNTROWS(DISTINCT(FinalDataset[Title]))/COUNTROWS(DISTINCT(FinalDataset[Artist]))
The dashboard was created on Power BI Desktop & it was then published to Power BI Service & uploaded to NovyPro for ease of access for the public (reduce need of signing into MicroSoft).
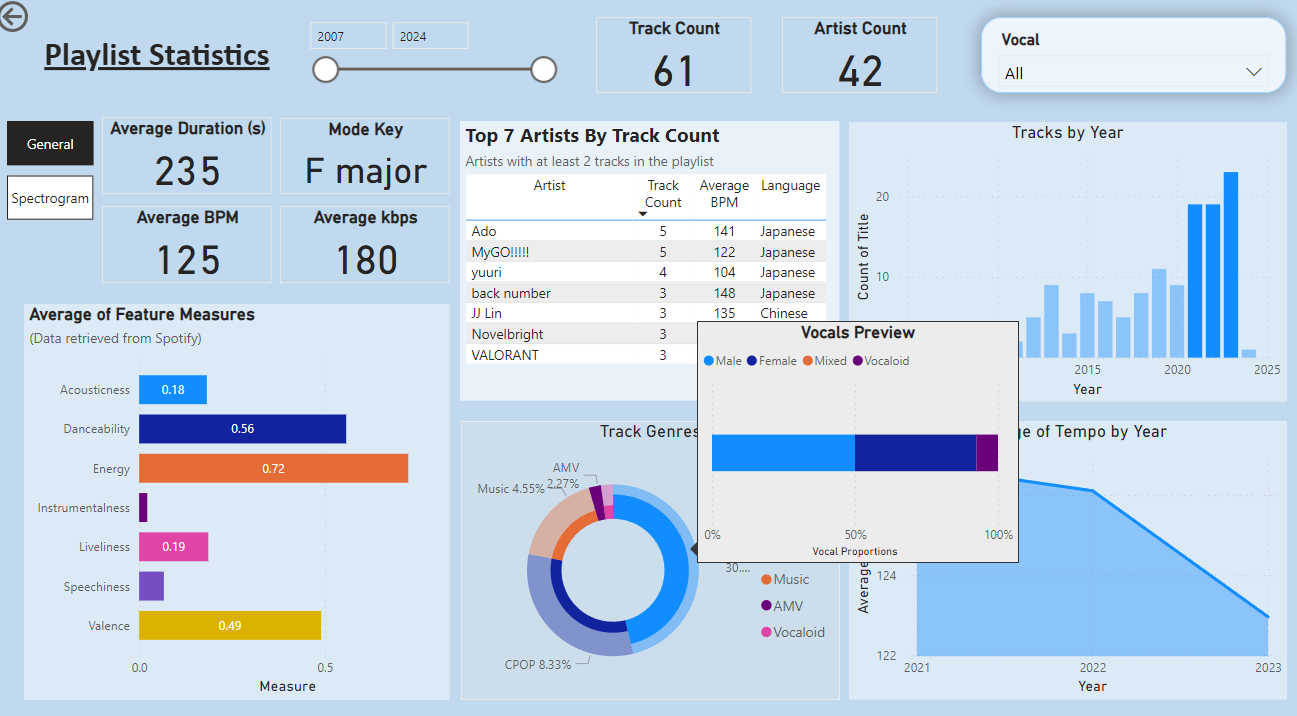
The following inferences, majority depicting my musical preferences, can be drawn from the dashboard;
Number of tracks with male vocals = 90
Number of tracks with female vocals = 32
Number of tracks with mixed vocals = 2
Number of tracks with vocaloids (electronic) = 8
Number of tracks without vocals (instrumental) = 0 (But in actual I have 3, but was not in included in the database yet)
Excluding the 1 track in 2007, general trend of the tempo of music in the playlist seems to be increasing.
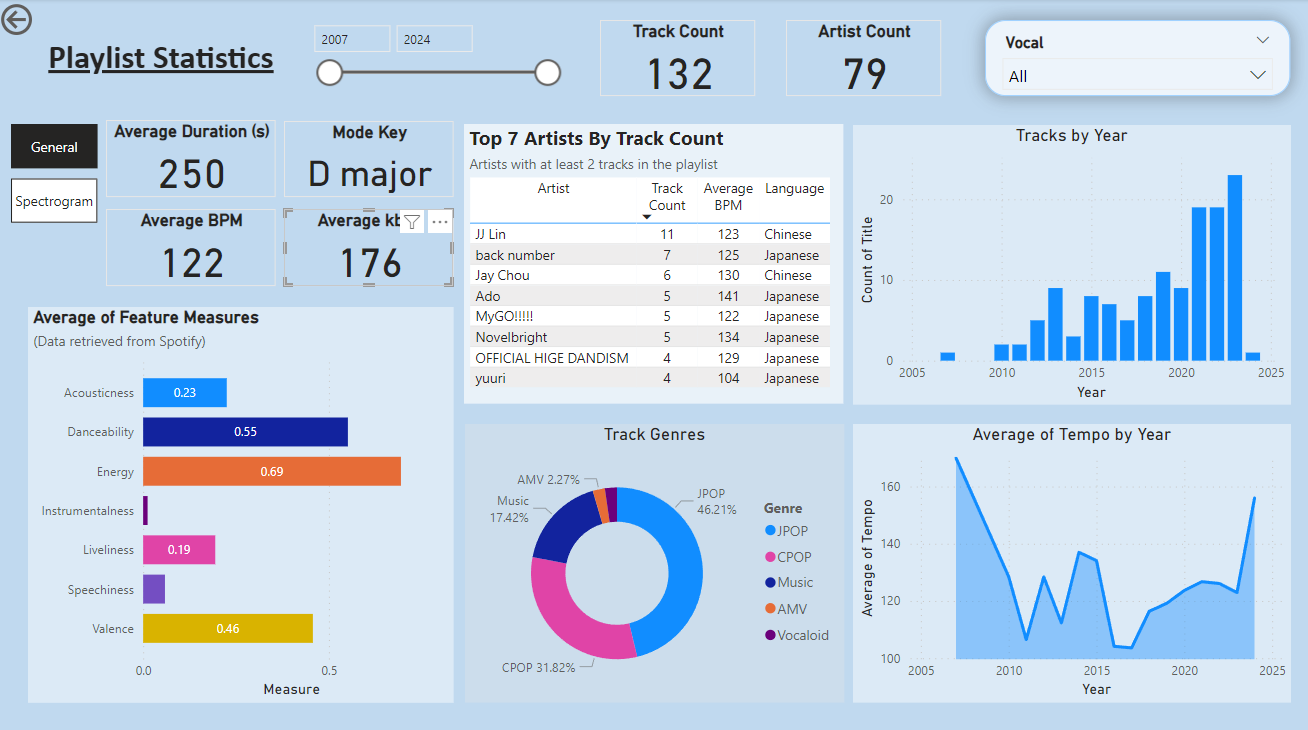
  a) Acousticness, describes how much the music is amplified by electrical sounds:  0.23/1
  b) Danceability, how much one can groove for the song based on its tempo, rhythm stability etc. : 0.55/1
  c) Energy, a perceptual measure of intensity and activity (fast and loudness): 0.69/1
  d) Instrumentalness, how little vocals the song has: 0.01/1
  e) Liveliness, likelihood that the track was recorded with live audiences: 0.19/1
  f) Speechiness, the presense of spoken words (not lyrics) in the track: 0.06/1
  g) Valence, music positiveness conveyed by the track: 0.46/1
I will leave the determination of the meaning of scores for the reader to decide.
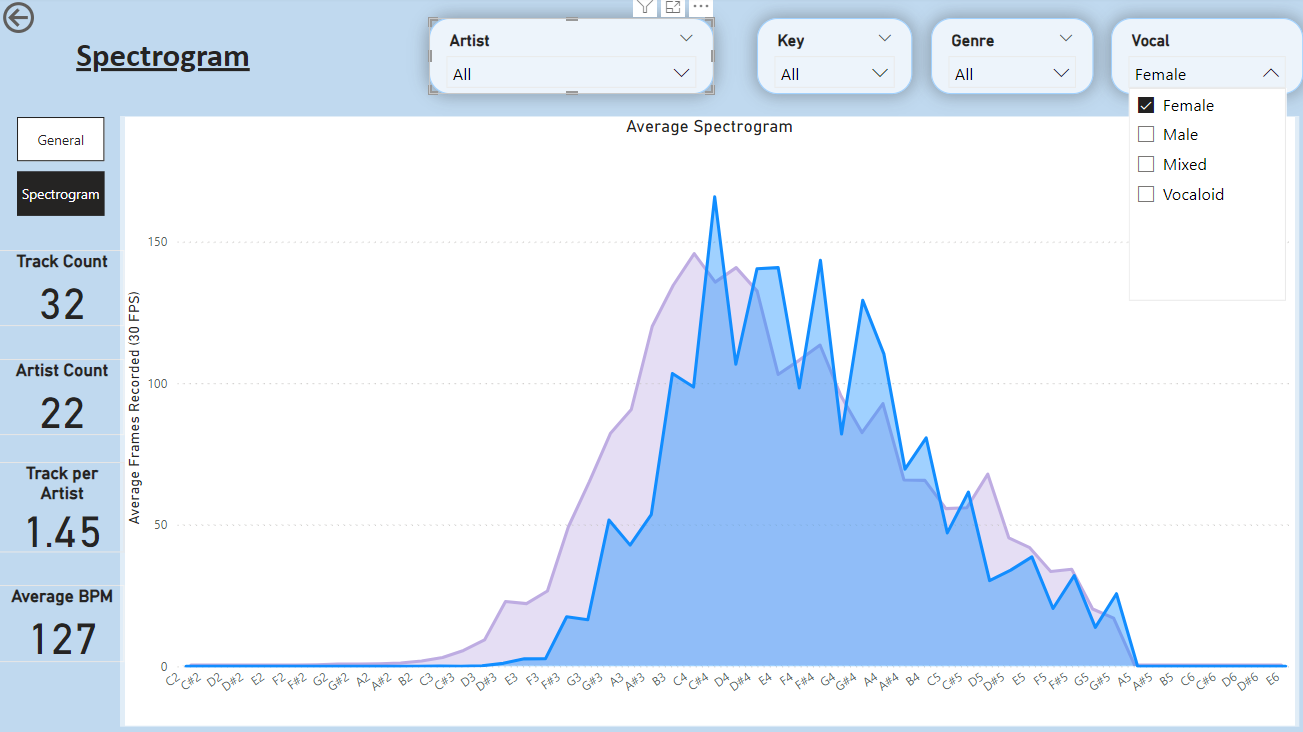
1.1) The note ranges differs between each vocal class, the order is male, mixed/female, vocaloid, from lowest range to highest range.
Results are fairly accurate to general expectations.
1.1) JPOP - 46.21%
1.2) CPOP - 31.82%
1.3) Music (English) - 17.42%
1.4) Other - 4.55%
- Tracks Recorded per Year Increases
- Most Listened to Artist
- Most Common Key and Average duration of Playlist
- Spectrogram shifting when changing keys
- Relationship between Genre and Spectrogram of Music