how to define steps to leftAxis
hape42 opened this issue · 0 comments
hape42 commented
I am trying to create a line chart
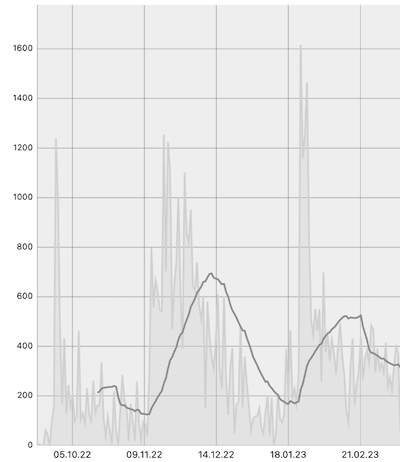
This works quite well so far. However, I cannot set the values on the left axis in 250 steps as desired.You can see my last attempt here:
ChartYAxis *leftAxis = self.lineChartView.leftAxis;
leftAxis.labelTextColor = [UIColor colorNamed:@"ColorGraphSD"];
leftAxis.axisMinimum = 0;
leftAxis.axisMaximum = ceil(maxValue / 250.0) * 250;
leftAxis.drawGridLinesEnabled = YES;
leftAxis.drawZeroLineEnabled = NO;
leftAxis.granularityEnabled = NO;
leftAxis.granularity = .1;
leftAxis.axisRange = 250;
leftAxis.labelCount = ceil(maxValue / 250.0);
Debugger tells me leftAxis.labelCount = 8; and leftAxis.axisMaximum = 2000;
All I want is a line at 259,500,750....
How to do that?