Show network usage graphs
Closed this issue · 6 comments
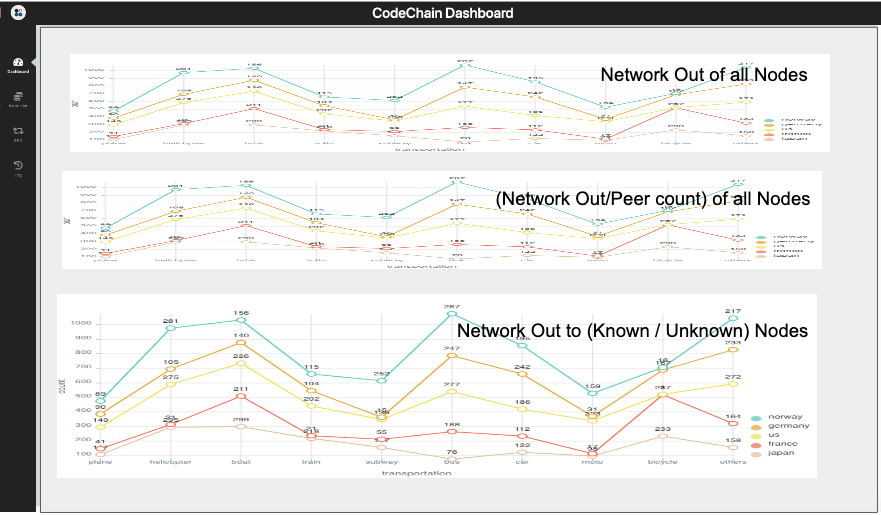
First page
- Network Out bytes of this week(All nodes)
- (Network Out bytes / peer count) of this week(All nodes)
- Network Out bytes of this week(To Known Nodes, To Unknown Nodes)
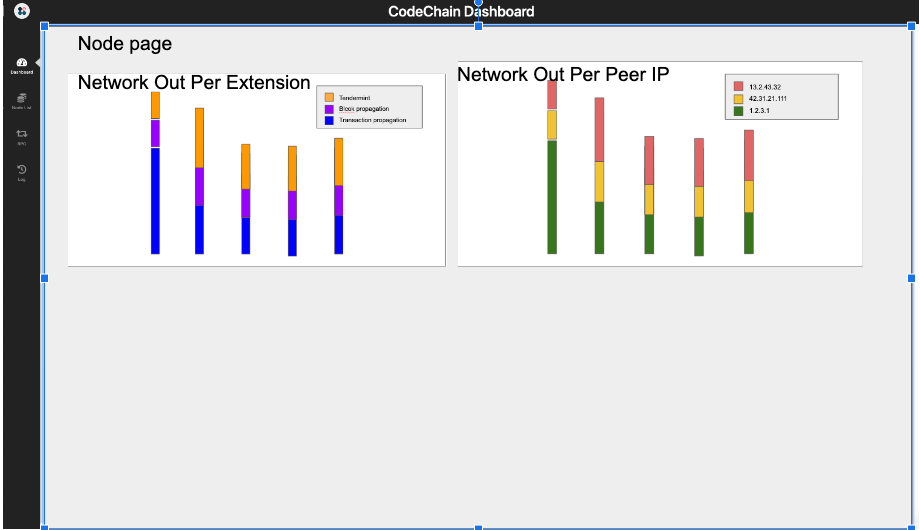
Detail page
If you click a machine's name in the first page, you can see the detail page.
- Network Out bytes of this week(Per network extension)
- Network Out bytes of this week(Per to IP address)
We will select data needed in the graph using SQL's aggregate functions.
Table: network_usage
Column:
- id: BIGSERIAL
- time: TIMESTAMP
- network_extension: VARCHAR
- to_ip: VARCHAR
- bytes: INTEGER
- node_name: VARCHAR
- peer_count: INTEGER
We will select data needed in the graph using SQL's aggregate functions.
Table: network_usage
Column:
- id: BIGSERIAL
- time: TIMESTAMP
- network_extension: VARCHAR
- to_ip: VARCHAR
How about target_ip?
- bytes: INTEGER
- node_name: VARCHAR
- peer_count: INTEGER
And It seems that storing the peer count and traffic per peer and extension in the same table is not a good idea.
"target_ip" is good. I'll use the column name.
The peer_count could be changed anytime. If we save the peer_count in another table, the query would be very complicated.
Do you have a good idea?
Seulgi recommended the table schema below to save the peer_count. I think it is quite a good idea.
Every row in the network_usage table has a peer_count row with the same time field
Table peer_count
- id: BIGSERIAL
- time: TIMESTAMP
- node_name: VARCHAR