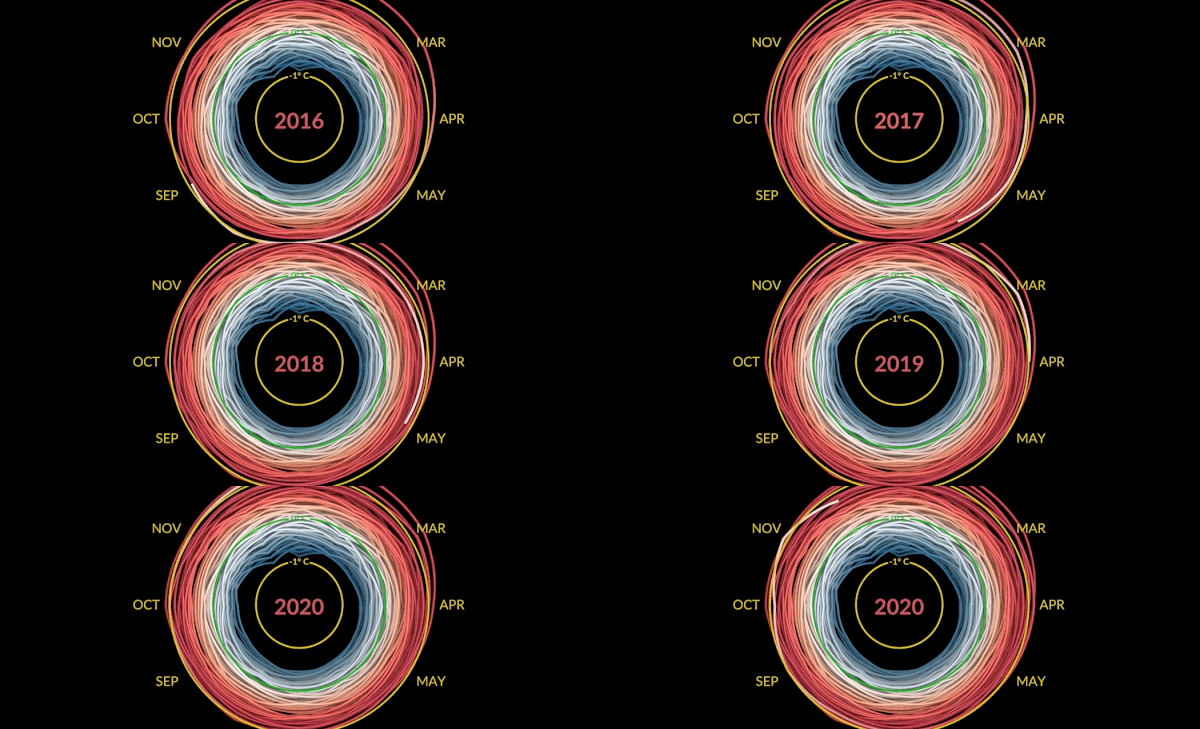
Recreate the "Climate spiral" animation in p5.js
Closed this issue · 6 comments
NASA published the climate spiral animation here that showcases the difference in monthly temperature compared to the average temperature of the period 1950-1980 and I think it is both alarming and beautiful!
In the animation, positive differences are shown in red, while negative differences are in blue.
The dataset with the monthly temperature change is available as a CSV file here, and I think it would be a simple yet beautiful coding challenge !
Alex 🦄
I love this idea, thank you for the suggestion! Maybe I can plan it for Earth Day? (Quite busy now with the Nature of Code book and new Processing tutorial series)
Oh yes what a great idea ! Doing it on Earth day would be even more meaningful 🤗
I love it ! Thanks a lot for doing this, I can't wait to see it !
Thank you for the suggestion! If you are in the Coding Train discord, feel free to tag or message me and I can share any more sneak peeks (if you are curious, no need!)

