Resource leak with DD_RUNTIME_METRICS_ENABLED=true
npubl629 opened this issue · 4 comments
Describe the bug
A resource leak with DD_RUNTIME_METRICS_ENABLED=true. This bug is most apparent when viewing the CPU usage of a service that has been running for several weeks without a reboot. It is unclear whether or not there is a memory leak associated with this bug.
To Reproduce
Steps to reproduce the behavior:
- View this repo
- Follow steps in the readme to start multiple docker services for which we can compare resource usage.
- Observe the CPU usage over several weeks. Services with DD_RUNTIME_METRICS_ENABLED begin consuming relatively more CPU than the ones without DD_RUNTIME_METRICS_ENABLED.
Expected behavior
The CPU and memory usage of this library should be stable when the service is idle or serving basic status endpoints.
Screenshots
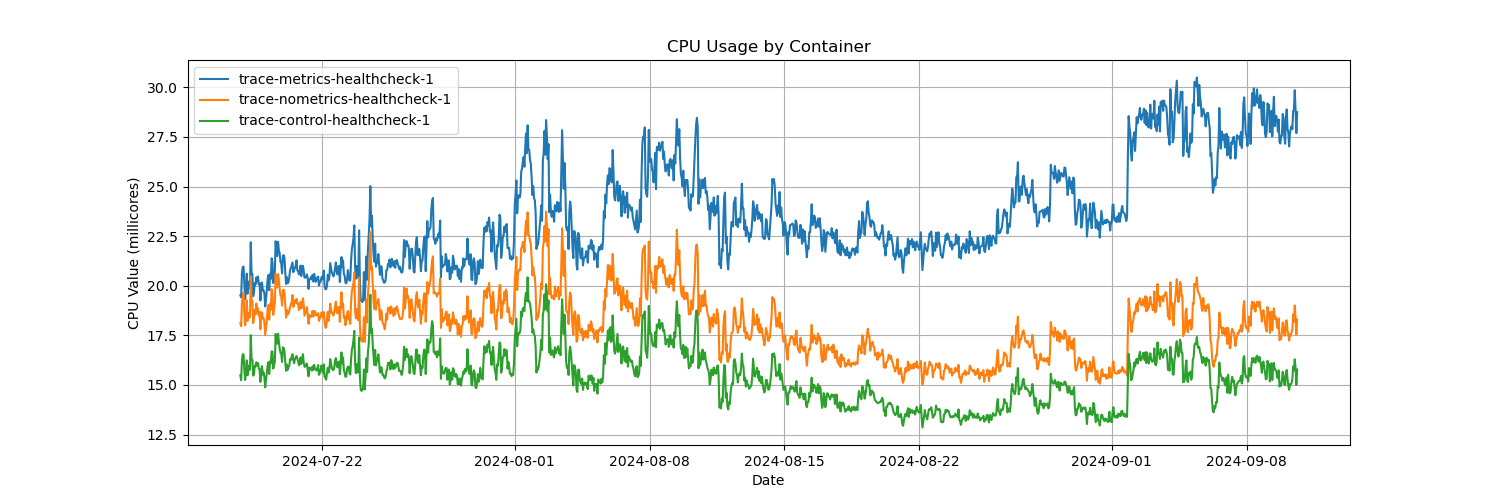
I have had the services from the example repo running for over 3 weeks and the issue is fairly clear. See this public datadog dashboard where CPU is steadily rising for the containers trace-metrics-idle-1 and trace-metrics-healthcheck-1. Unfortunately the trace-nometrics-idle-1 container never started, but the difference in CPU usage for the three healthcheck containers makes the issue fairly clear.
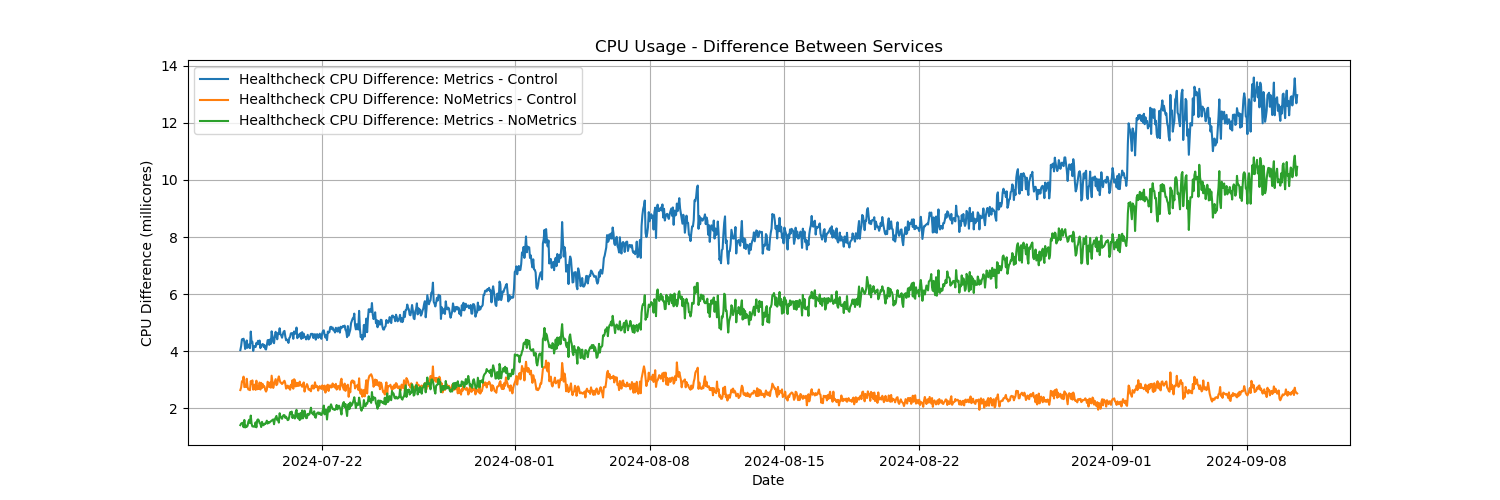
This chart is the difference between container CPU usage of the three healthcheck containers. Note the blue and green lines are increasing, while the orange line is fairly stable. Also note the CPU usage of the idle service (serving no requests) has more than doubled in three weeks.
Runtime environment:
- Instrumentation mode: NuGet package
- Tracer version: Issue has been observed in Datadog.Trace NuGet package version 2.28.0, 2.53.0, 2.54.0. Version 1.29.0 is known to work properly
- OS: Issue has been observed on Linux containers using Debian and Ubuntu base images, both with Kubernetes and Docker hosts.
- CLR: Issue confirmed on .Net 6 and .Net 8.
Additional context
My team discovered this issue with a few of our services which serve almost no traffic and are restarted very infrequently. The rise in CPU usage appears to outpace memory usage, but given the length of time it takes to see the issue as well as various GC settings, is difficult to determine if and where a potential memory leak occurs. If necessary I can provide redacted charts of our internal service's metrics.
Hello. Thanks for the report, though this one is going to be hard to investigate given the time it takes to reproduce the issue. I doubt anything in the runtime metrics themselves could cause this behavior, so I would suspect either the .NET EventPipes or the Datadog Dogstatsd client.
The best tool to investigate this would be a perf trace, but it's very hard to interpret if COMPlus_PerfMapEnabled hasn't been set. Is there a chance you could capture a full coredump of your instances without restarting them? (using dotnet-dump collect --type Full -p <pid>). Note that we currently have an issue and dotnet-dump won't save the dump with Datadog.Trace 2.52.0+ if you have set the LD_PRELOAD environment variable (required by the continuous profiler). If that's your case, the workaround is to set either COMPlus_DbgEnableMiniDump=1 or DD_TRACE_CRASH_HANDLER_ENABLED=0 but that requires restarting the instance.
Thanks - dump file is here from container trace-metrics-idle-1.
Attached is a screenshot of htop running inside the container, note thread id 26 consuming the majority of CPU time. If I'm interpreting this correctly, per the dumpfile, this thread is responsible for the EventPipeDispatcher. This is the exact behavior we saw with our internal services, ultimately I looked through the RuntimeEventListener and RuntimeMetricsWriter but didn't see anything suspect so any suggestions are appreciated.
Here are four additional screenshots we took internally illustrating the same issue. I'm unsure why the CPU growth of some services is faster than others - they are all under similar conditions (virtually no workload, a status healthcheck every few seconds).
In the below, again note the EventPipeDispatcher seems to be in use by the thread consuming most of the CPU time.


Thanks for the dump file, @npubl629. We've started inspecting it, although we haven't found anything obvious in it yet. Will update here when we make some progress.


