Magic: The Gathering (colloquially known as Magic or MTG) is a tabletop and digital collectible card game created by Richard Garfield. Released in 1993 by Wizards of the Coast, Magic was the first trading card game and had approximately fifty million players as of February 2023. Over twenty billion Magic cards were produced in the period from 2008 to 2016, during which time it grew in popularity. As of the 2022 fiscal year, Magic generates over $1 billion in revenue annually - Wikipedia
The goal of this project is to build an end-to-end batch data pipeline on Magic: The Gathering Data available at Scryfall. In addition, perform ELT (Extract Load Transform) daily in order to analyze the cards information availabe from historical data to till date.
- Problem statement
- Data Pipeline Overview
- Technologies
- Architecture
- ELT Steps
- The Dashboard
- Conclusion
-
The Data selected for this project is the
Magic: The Gatheringobtained from Scryfall. This data includes the latest cards information available. Data since 1993. The Data is extracted via Scryfall API.The columns in the Datasets and their descriptions is available here
-
This project aims at extracting this data from the source via API and building a BATCH ELT which will be scheduled to run daily and update the connected Dashboard for daily Analytics & Reporting.
This is a Batch Pipeline which will perform ELT on the every day at 09:00 am.
The ELT steps include:
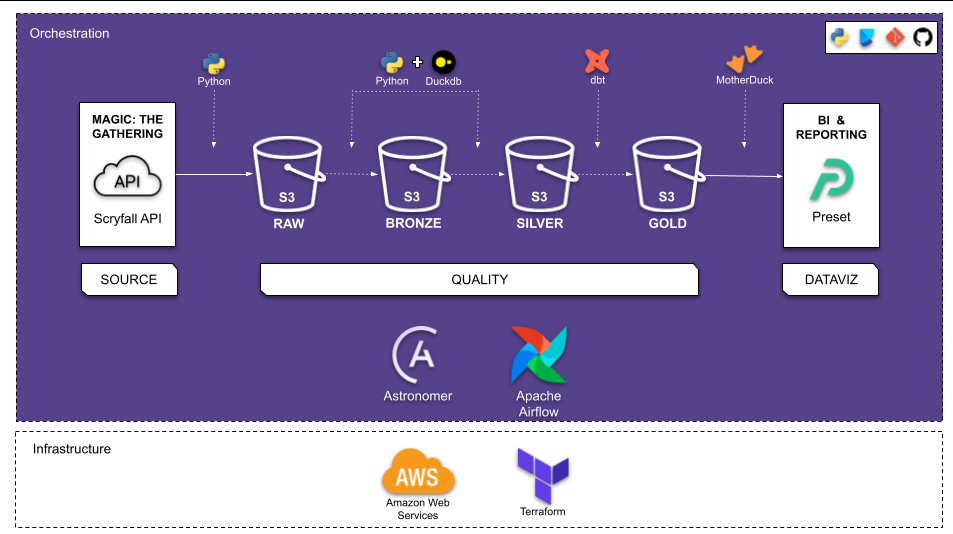
- Extract dataset from Scryfall via API and load the data into the Datalake
- Clean data and load the data into Datalake
- Load the data from Datalake into external tables in the Datawarehouse
- Transform the data in the Datawarehouse
- Visualize the data by creating a Dashboard
- RAW: where the raw data is placed as soon as it is collected
- BRONZE: data treated and ready to be consumed
- SILVER: data processed and can be consumed easily
- GOLD: data made available from analyzes and models, which can be consumed by BI or DataViz tools
- Cloud: AWS
- Infrastructure as code (IaC): Terraform
- Workflow orchestration: Astronomer + Airflow
- Data Warehouse: MotherDuck
- Batch processing: DuckDb
- Data Transformation: dbt-core
- DataViz: Preset
- Virtual Environment: Poetry
- CICD: Git
Pipeline
Steps in the ELT are as follows:
- A Project is created on GitHub
- Infrastructure for the Project is created using Terraform which creates the following:
- Datalake: S3 Bucket where the raw and cleaned data will be stored
- The Pipeline for ELT is created and is scheduled for daily execution. It is orchestrated via Astronomer + Airflow, which does the following tasks:
- Extracts raw data from source via Scryfall API
- Loads raw data as json file to S3 Bucket
- Cleans the raw data using DuckDb
- Loads the cleaned data as parquet files to S3
- Creates External table in the Datasets in MotherDuck by pulling data from S3.
- Transforms Data from S3 using dbt-core and creates the following in the dev/prod Dataset (along with Tests and Documentation)
- The view:
stg_cards - The fact table:
fact_cards
- The view:
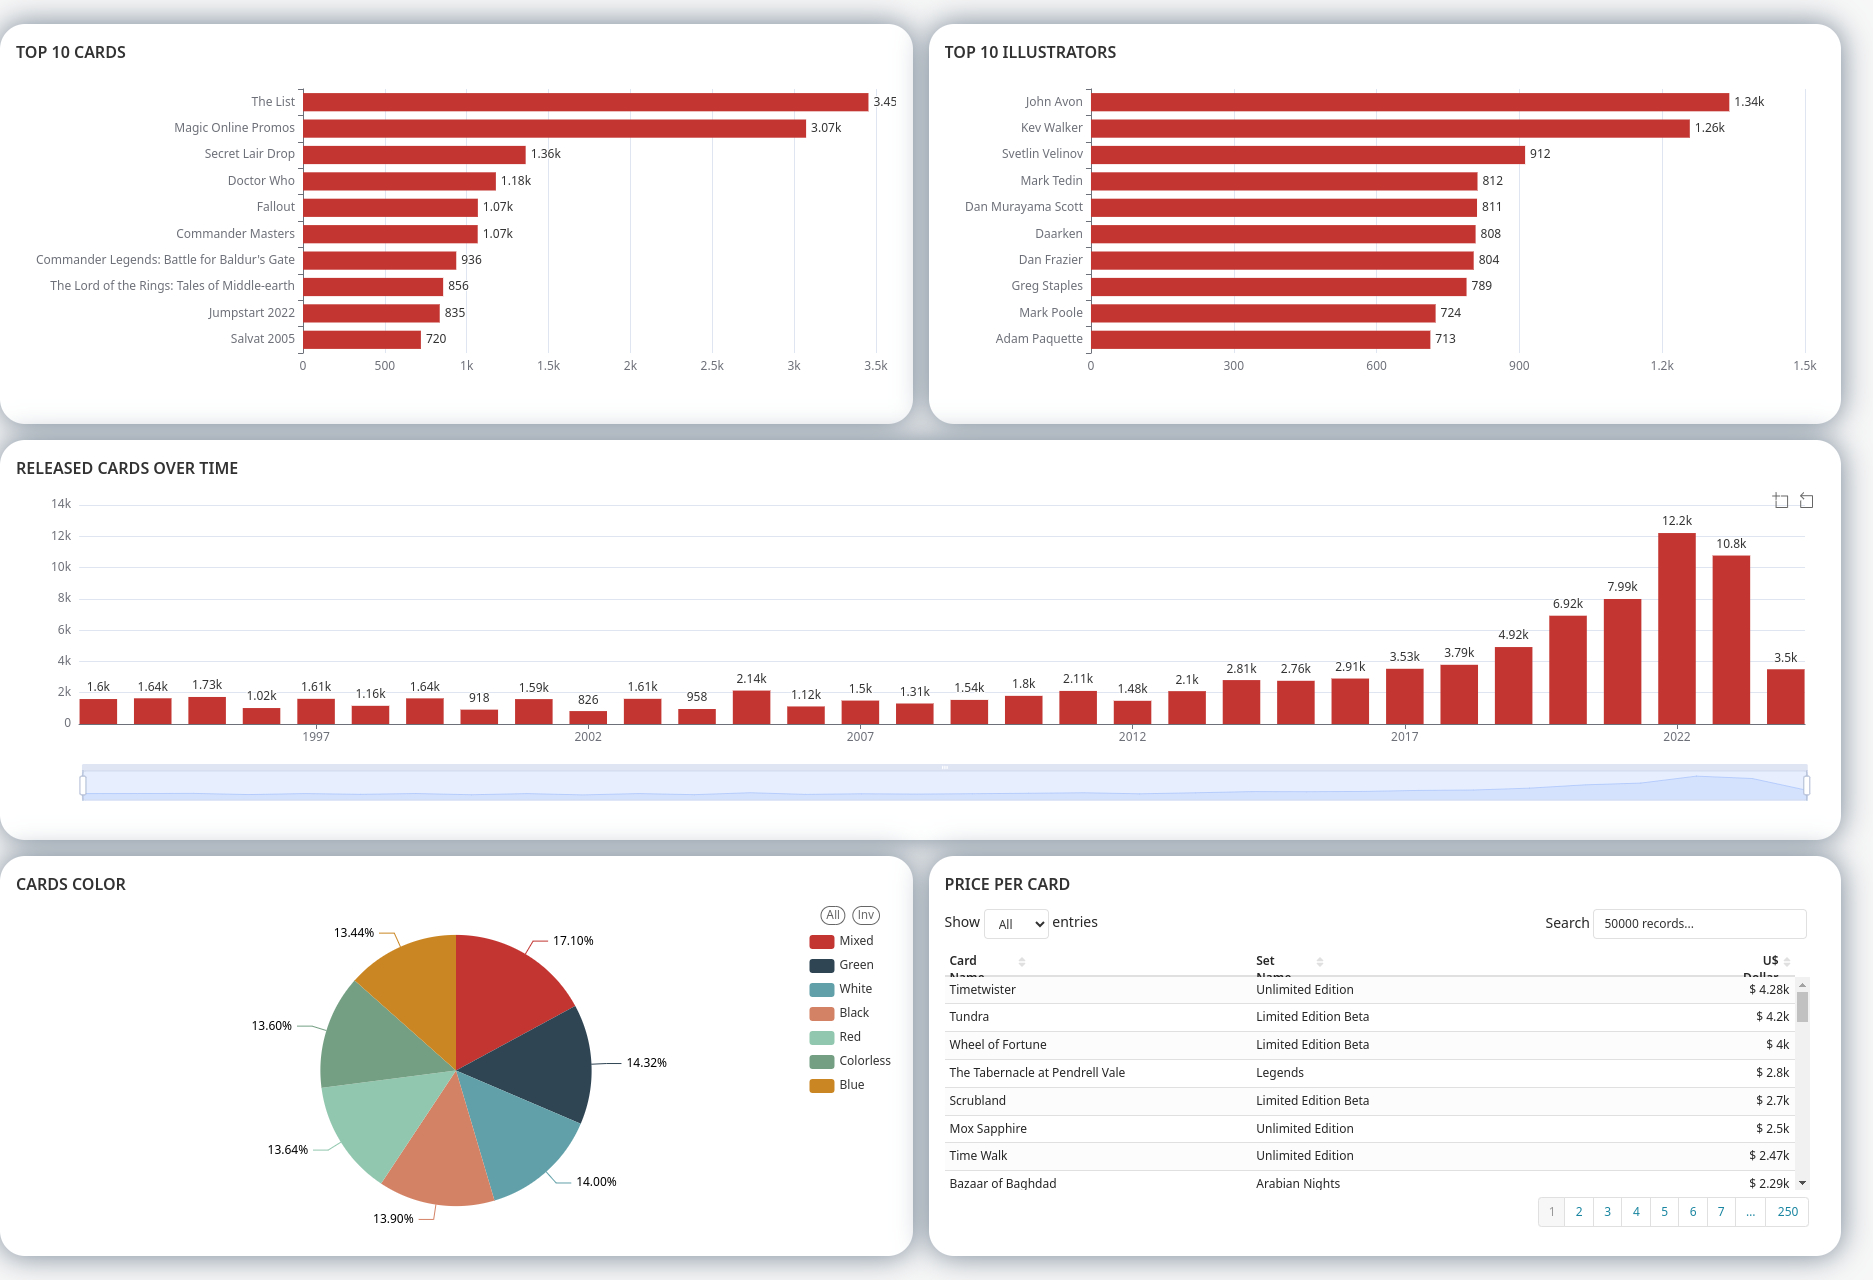
- Transformed Data from MotherDuck is used for Reporting and Visualization using Preset to produce Dashboards
Through this project we were able to successfully build a ELT pipeline end to end which is scheduled to run daily. And as a result we have a daily updated MTG cards which can be visualized via the Dashboard on Preset. This helps us get some useful insights on the latest cards information.


