LibreNMS Example Alerts
LibreNMS is not very plentiful with their example alerts. It took me a significant amount of time to come up with the following alerts so I thought I would create a repository to retain them in the event that I need to rebuild my LibreNMS server in the future. Or, of course, so others could see my examples as well.
Included alerts
This table holds all of my example LibreNMS alerts.
| # | Name | Rule | Severity | Extra |
|---|---|---|---|---|
| 1 | Host has been down for 5 minutes. | %macros.device_down = "1" | critical | Max: 1 Delay: 300 Interval: 1800 |
| 2 | CPU usage > 90% for 5 minutes. | %processors.processor_usage >= "90" | warning | Max: 1 Delay: 300 Interval: 900 |
| 3 | Memory usage > 90% for 5 minutes. | %mempools.mempool_perc >= "90" | warning | Max: 1 Delay: 300 Interval: 900 |
| 4 | Root filesystem has less than 5% free space available. | %storage.storage_descr = "/" && %storage.storage_perc >= "95" | critical | Max: 1 Delay: 60 Interval: 900 |
| 5 | Disk usage is abnormally high. | %storage.storage_perc > %storage.storage_perc_warn && %devices.type = "server" && %storage.storage_descr !~ "/boot" = "" | critical | Max: 1 Delay: 60 Interval: 900 |
| 6 | AUTHENTICATION FAILURE!!!!!!! | %syslog.msg ~ "@authentication failure@" = %syslog.timestamp >= %macros.past_5m | critical | Max: -1 Delay: 300 Interval: 300 |
| 7 | Network usage > 80% for 5 minutes. | %macros.port_usage_perc >= "80" && %port.port_descr_type != "client" && %ports.ifType != "softwareLoopback" | ok | Max: -1 Delay: 300 Interval: 300 |
| 8 | CPU Latency > 500ms for 1 minute. | %device_perf.avg >= "1000" | critical | Max: 1 Delay: 60 Interval: 900 |
| 9 | Network usage > 2MBps for 5 minutes. | %ports.ifHighSpeed >= "2" | ok | Max: 1 Delay: 300 Interval: 900 |
| 10 | Device discovered within the last 60 minutes | %eventlog.type = "discovery" && %eventlog.message ~ "@autodiscovered@" && %eventlog.datetime >= %macros.past_60m | ok | Max: 1 Delay: 0 Interval: 300 |
| 11 | Host has been rebooted. | %devices.uptime < "300" && %macros.device = "1" | warning | Max: 1 Delay: 300 Interval: 300 |
| 12 | Poller is taking longer than expected. | %pollers.time_taken >= "250" | critical | Max: -1 Delay: 300 Interval: 300 |
| 13 | A network port has gone down. | %ports.ifOperStatus = "down" && %ports.ifOperStatus_prev = "up" && %macros.device_up = "1" | warning | Max: -1 Delay: 300 Interval: 300 |
| 14 | Interface errors rate is abnormally high. | %ports.ifOutErrors_rate >= "100" | critical | Max: -1 Delay: 300 Interval: 300 |
| 15 | Host has entered a Warning state. | %services.service_status = "1" | warning | Max: -1 Delay: 300 Interval: 300 |
| 16 | Host has entered a Critical state. | %services.service_status = "2" | critical | Max: -1 Delay: 300 Interval: 300 |
| 17 | FQDN does not include the domain name. | %devices.sysName !~ "@sol.milkyway" | warning | Max: -1 Delay: 300 Interval: 300 |
| 18 | Hostname includes the domain name. | %devices.hostname ~ "@.sol.milkyway" | warning | Max: -1 Delay: 300 Interval: 300 |
| 19 | IP Address is within the DHCP scope. | %devices.ip ~ "192.168.1.2@" | warning | Max: -1 Delay: 300 Interval: 300 |
| 20 | Host has not been polled within the last day. | %devices.last_polled >= "86400" | critical | Max: -1 Delay: 300 Interval: 300 |
| 21 | Host is using a slow network adapter. | %ports.port_descr_speed > "1000" | ok | Max: -1 Delay: 300 Interval: 300 |
| 22 | CPU ready time > 10% for 5 minutes. | %processes.cputime >= "10" | critical | Max: -1 Delay: 300 Interval: 900 |
| 23 | Host has less than 1GB of allocated memory. | %vminfo.vmwVmMemSize <= "1024" | warning | Max: -1 Delay: 300 Interval: 300 |
| 24 | Host has more than 3 VCPUs. | %vminfo.vmwVmCpus >= "3" | warning | Max: -1 Delay: 300 Interval: 300 |
Alert Template
LibreNMS allows you to customize the alert message that is sent to your transport endpoint. The following is my default message. I did not bother with additional templates.
Alert Title: LibreNMS (%hostname) - NEW ALERT
Recovery Title: LibreNMS (%hostname) - CANCELLATION
Alert Body:
{if %state == 0}Duration: %elapsed{else}Severity: %severity{/if}

{if %name}%name{else}%rule{/if}
---------------------------
Timestamp: %timestamp
Uptime: %uptime_long
TODO
At this time several of the above rules are either not working or flawed. I have not done any troubleshooting, but simply disabled the rules in favor of resolving the issue at a later time.
 - Host has more than 3 VCPUs: This rule does not work effectively as it spams for physical devices > 3 CPU cores as well. (My hypervisor, workstation, & laptop)
 - Host has less than 1GB of allocated memory: This rule is ineffective as well as it mis-diagnoses physical devices. (Perhaps they return null for vminfo which triggers a false positive?)
 - FQDN does not include the domain name: For some reason this rule is also not functional. (Every device that is monitored returns a failure for this check during each interval cycle.)
 - Host has been down for 5 minutes: Times are not always accurate. Also delivers false positives for reboots occasionally. For example, rebooted my laptop (~45 seconds) and received an alert saying it had been down for 5 minutes.
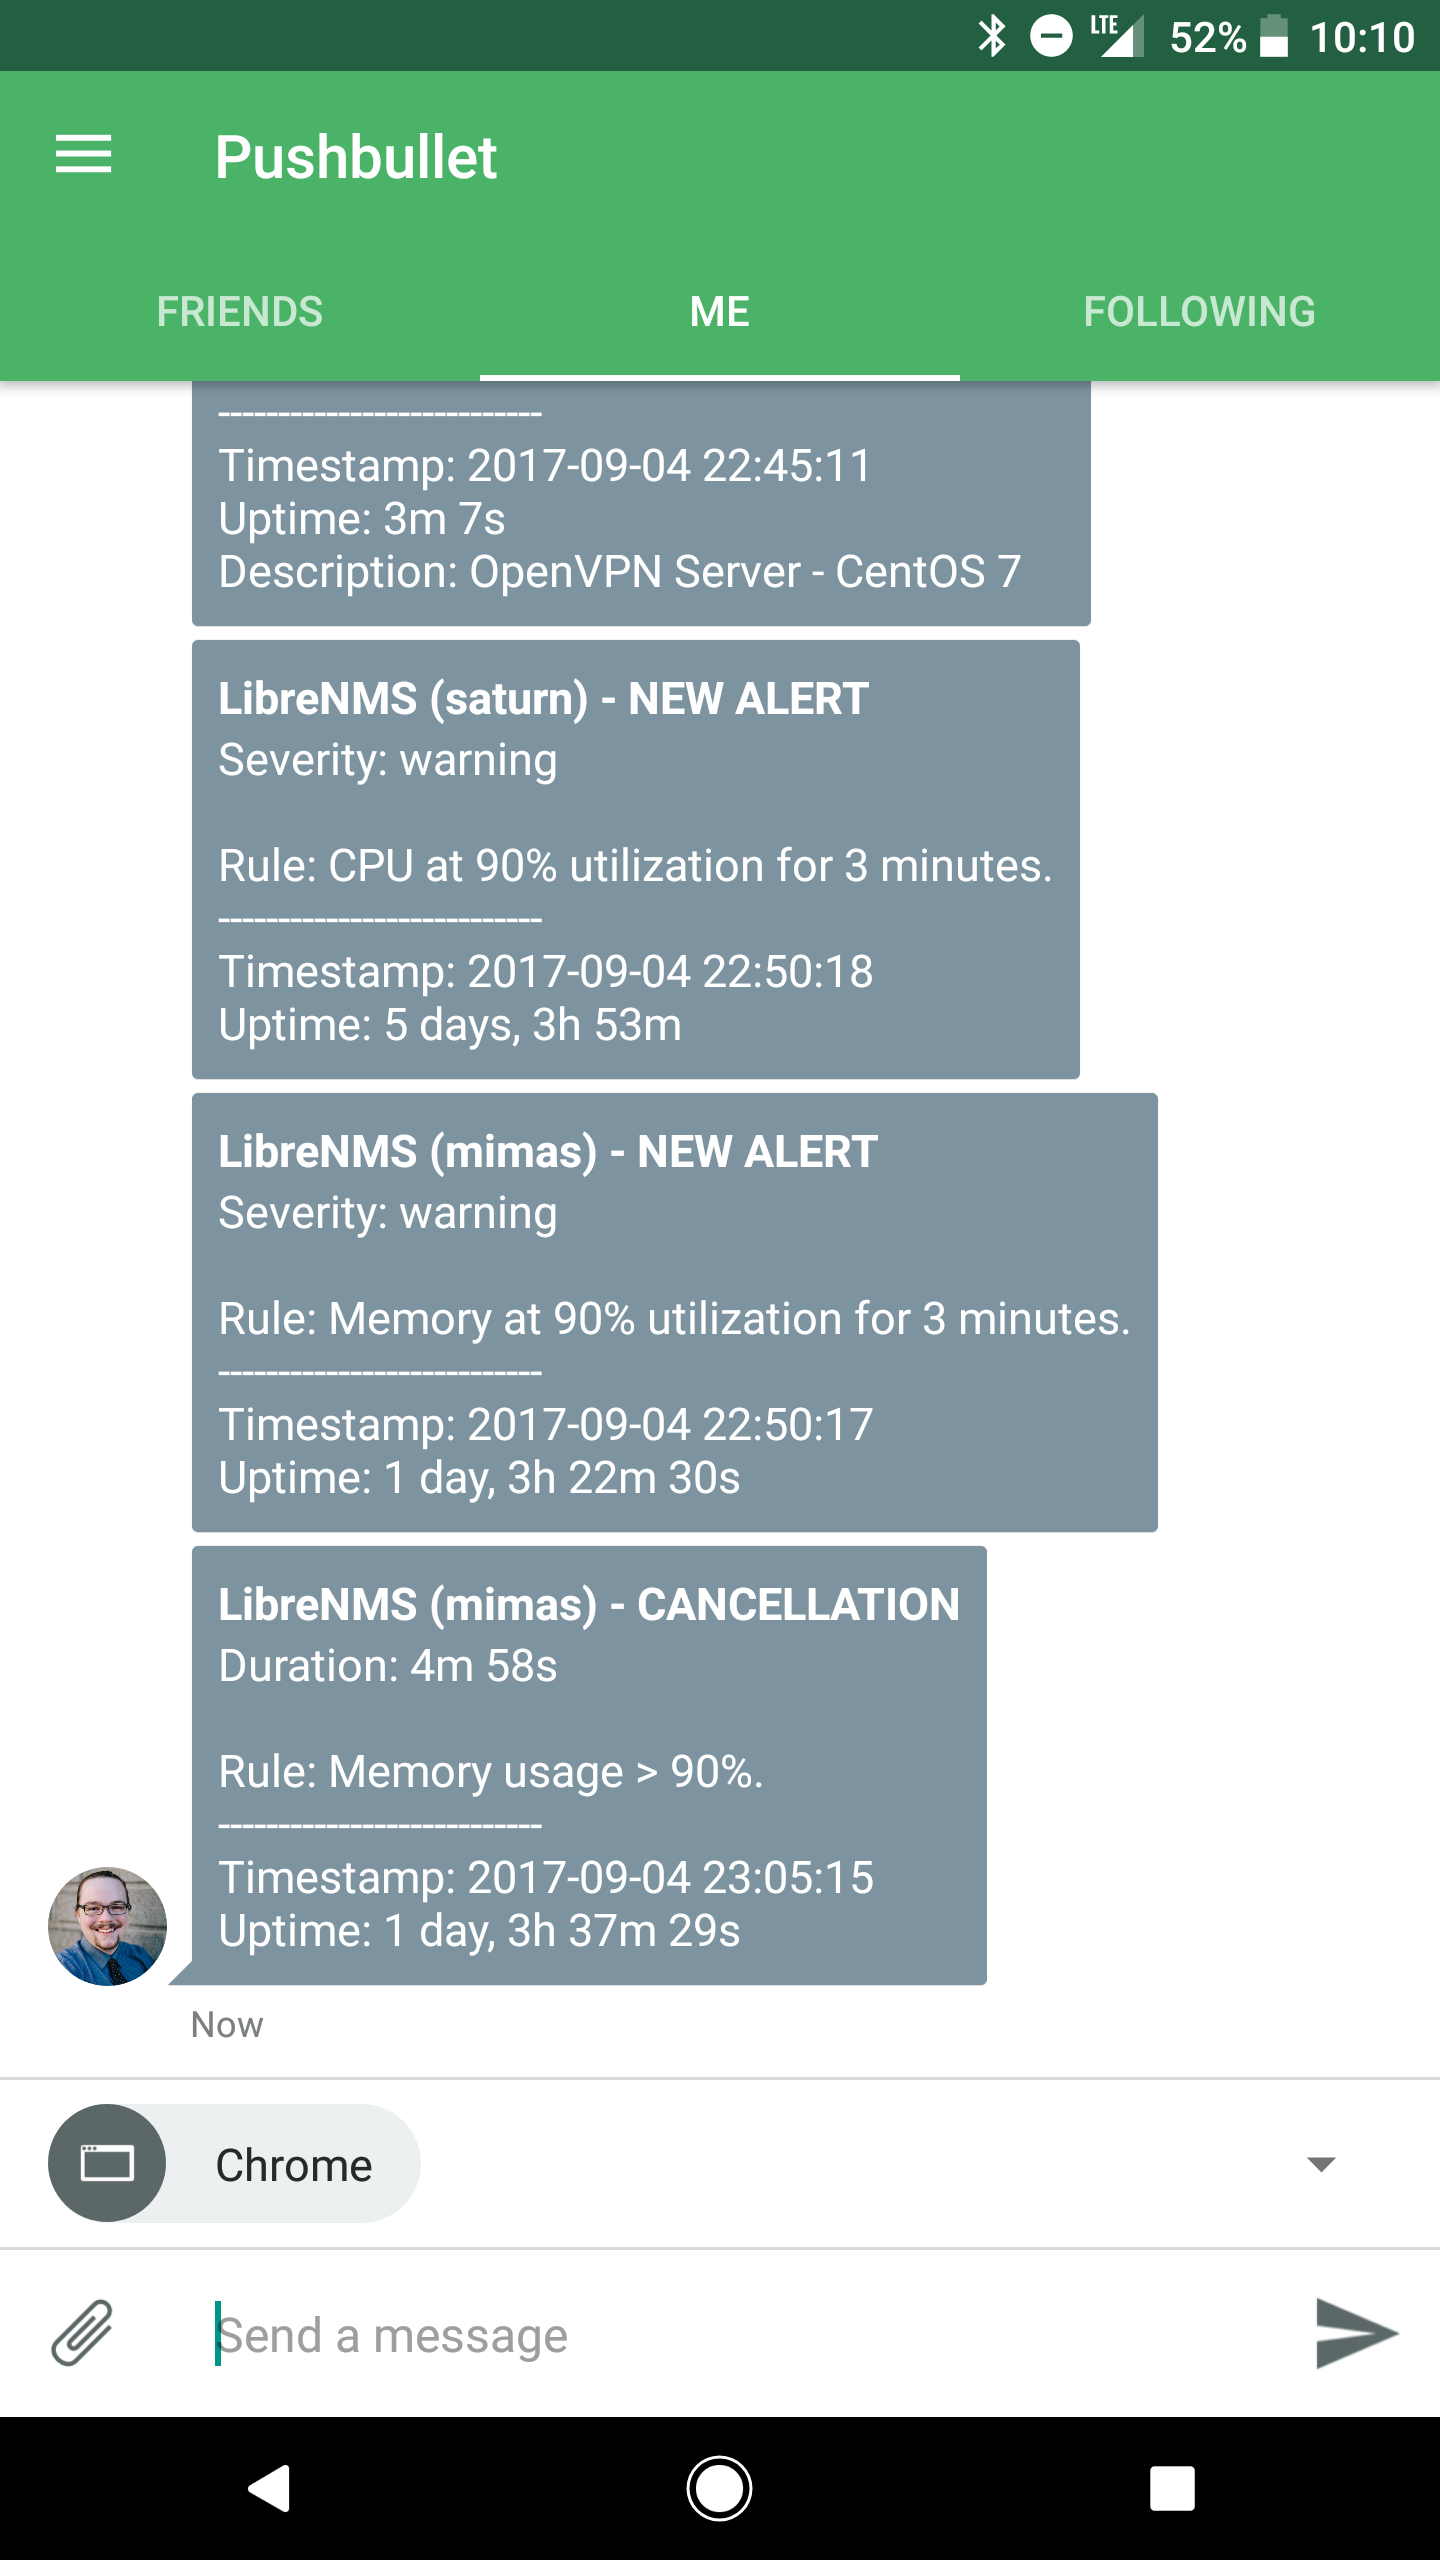
Alert Example
The following is a screenshot of my phone displaying several push notifications using the above rules and templates in conjunction with Pusbullet as my transport endpoint.