Tatapov is a Python library making accessible and easy to explore the DNA overhang misannealing data from Potapov et al. (2018, bioRxiv) and Pryor et al. (2020, PLoS ONE):
Optimization of Golden Gate assembly through application of ligation sequence-dependent fidelity and bias profiling. Vladimir Potapov, Jennifer L. Ong, Rebecca B. Kucera, Bradley W. Langhorst, Katharina Bilotti, John M. Pryor, Eric J. Cantor, Barry Canton, Thomas F. Knight, Thomas C. Evans Jr., Gregory Lohman. bioRxiv (2018) https://doi.org/10.1101/322297
Enabling one-pot Golden Gate assemblies of unprecedented complexity using data-optimized assembly design. John M. Pryor, Vladimir Potapov, Rebecca B. Kucera, Katharina Bilotti, Eric J. Cantor, Gregory J. S. Lohman. PLoS ONE (2020) 15(9): e0238592. https://doi.org/10.1371/journal.pone.0238592
The Supplementary Material of these papers provide tables of inter-overhang annealing data in various conditions (01h or 18h incubations at 25C or 37C). Tatapov provides these tables (it will download them automatically upon first use) as pandas dataframes, so that they are easy to manipulate.
It also provides simple methods to build and plot subsets of the data (plotting requires Matplotlib installed).
Plotting
import tatapov

# Get a subset of the data at 25C (1h incubation)
data = tatapov.annealing_data["25C"]["01h"]  # a pandas dataframe
overhangs = ["ACGA", "AAAT", "AGAG"]
subset = tatapov.data_subset(data, overhangs, add_reverse=True)

# Plot the data subset
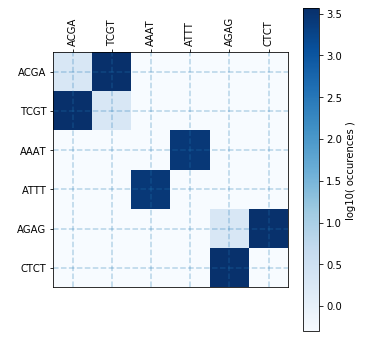
ax, _ = tatapov.plot_data(subset, figwidth=5, plot_color="Blues")
ax.figure.tight_layout()
ax.figure.savefig("example.png")
In the plot above, if you see anything else than the square pairs around the diagonal, it means there is cross-talking between your overhangs (so risk of misannealing). If one of these diagonal square pairs appears lighter than the others, it means that the corresponding overhang has weak self-annealing (risk of having no assembly). A color square in the diagonal means that the overhang can anneal with itself (palindromic). The Matplotlib colormap is specified with the plot_color parameter.
The following datasets are available (see the publications for more details):
# Potapov 2018:
tatapov.annealing_data[temperature][time]
# where temperature is '25C' or '37C', and time is '01h' or '18h'

# Pryor 2020 (all 01h):
tatapov.annealing_data['37C'][enzyme]
# where enzyme is one of:
# '2020_01h_BsaI', '2020_01h_BsmBI', '2020_01h_Esp3I' or '2020_01h_BbsI'
Identifying weak self-annealing overhangs
import tatapov

annealing_data = tatapov.annealing_data['37C']['01h']

# Compute a dictionary {overhang: self-annealing score in 0-1}
relative_self_annealing = tatapov.relative_self_annealings(annealing_data)

weak_self_annealing_overhangs = [
    overhang
    for overhang, self_annealing in relative_self_annealing.items()
    if self_annealing < 0.4
]
Identifying overhang pairs with significant cross-talking
import tatapov

annealing_data = tatapov.annealing_data['37C']['01h']

# Compute a dictionary {overhang_pair: cross-talking score in 0-1}
cross_annealings = tatapov.cross_annealings(annealing_data)

high_cross_annealing_pairs = [
    overhang_pair
    for overhang_pair, cross_annealing in cross_annealings.items()
    if cross_annealing > 0.08
]You can install Tatapov through PIP:
pip install tatapov
Alternatively, you can unzip the sources in a folder and type
python setup.py install
Tatapov is an open-source software originally written at the Edinburgh Genome Foundry by Zulko and released on Github under the MIT licence (Copyright 2018 Edinburgh Genome Foundry). Everyone is welcome to contribute !
Please contact us if there is any issue regarding copyright (there shouldn't be as the repository does not contain any data, and the paper data is free to download).

Tatapov is part of the EGF Codons synthetic biology software suite for DNA design, manufacturing and validation.

