IoT secured stack
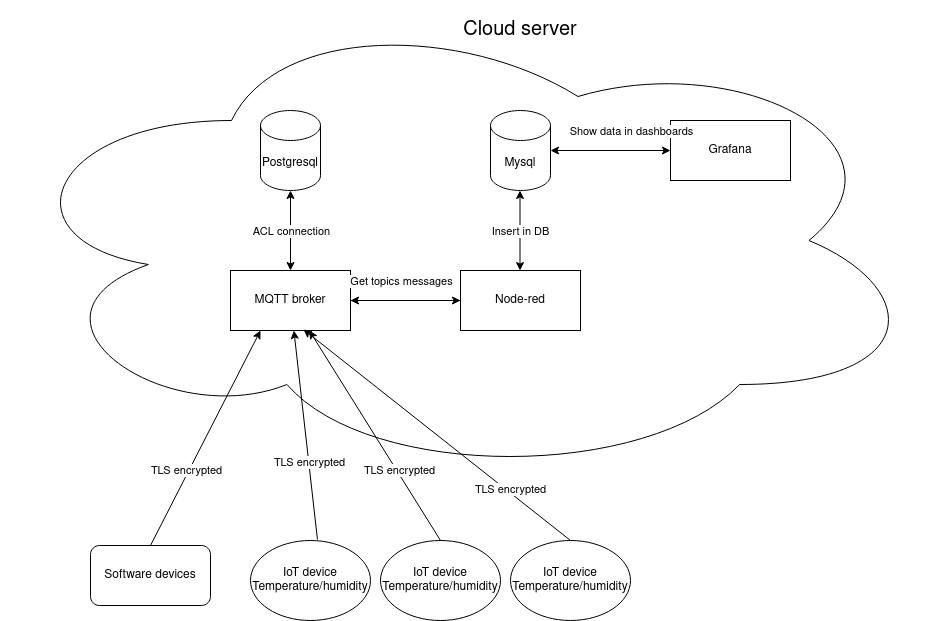
Global schema of infrastructure
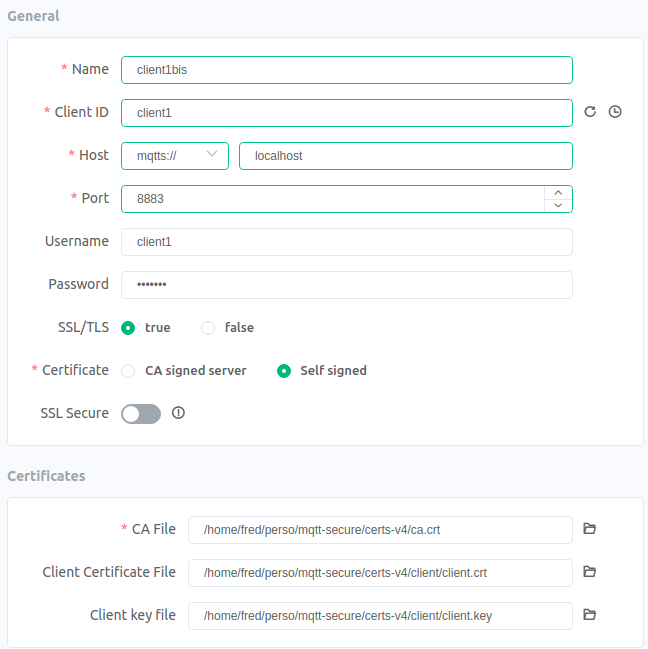
The MQTT broker has authentication and TLS certificates to log and communicate between clients. To do so, see the picture below to connect to it.
The client configuration needs to be like this in MQTTX:
Node-red is the service that allows to connect to the mqtt broker, get messages, and transfer data to the MariaDB database.
The configuration supports two users:
guilhem: for Guilhem userfred: for Frédéric user
To be able to connect, you should execute this command for each user :
docker exec -it node-red npx node-red admin hash-pw <user>A command prompt asks for the password you want to give to the user.
Then you need to copy these hashes and past into you .env file and source it :
source .envThe you can log-in to the node-red web interface at 1880 port.
Grafana is the graphical interface that allows to see data from mqtt devices.
At first, go to the grafana endpoint address : localhost:3000
Set username/password : admin/admin at first, then grafana will ask for a new password, set what you want.
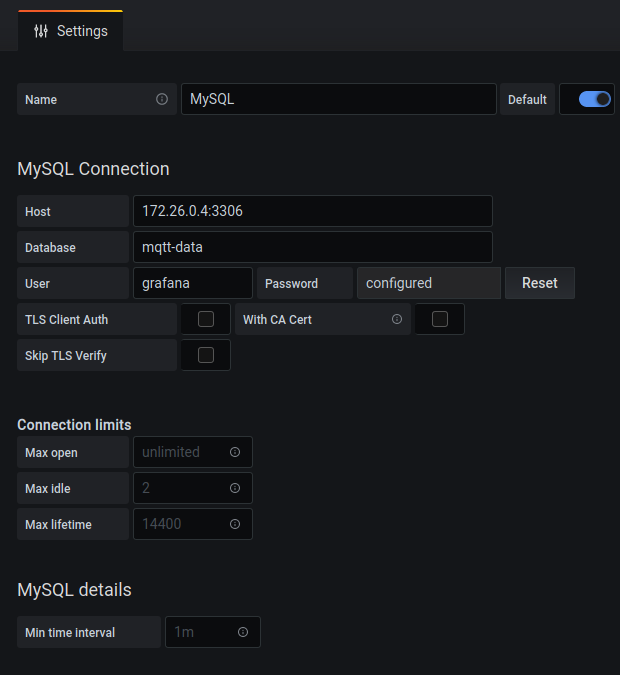
Then go on Configuration section (on the left of the window) and go on Data Sources. Click on Add data source, then select Mysql and add parameters like below :

The Password is that one present in the mariadb/schemas/mqtt-users.sql for grafana user -> grafana-password.
The last step is to add the dashboard to see mqtt data.
At first, go on Create logo (on the left of the windows) and click on Import. Click on Upload JSON file and get the dashboard JSON file in grafana/provisioning/dashboards/temperature_humidity_dashboard.json file. Finish with Import button.
You now have a fresh installation of the entire stack. Enjoy !

