Question about your example with traefik logs
ovizii opened this issue · 3 comments
Hi there,
does your example refer to the "access logs" or the "container logs"?
accessLog:
  filePath: "/var/log/traefik/traefik-access.log"
or to:
log:
  level: ERROR
  filepath: "/var/log/traefik/traefik-container.log"
Those are my configs - /var/log is mounted into the container at /var/log/traefik
Hi @ovizii,
if you mean the provided logrotate_example.txt, it is currently for the access logs. See the notes.
Optionally configure logrotation on your Docker host server if you've enabled Traefik access logs
For regular container logs, my traefik.yml static configuration file does not even store container logs into an outfile. Therefore, nothing to rotate for.
# Log level INFO|DEBUG|ERROR
log:
  level: INFO
Sorry, I'm a bit of an idiot. I didn't specify what I was referring to. Your answer is enough for to answer my question, just adding more context here in case someone else finds this thread at a later time.
My question was related to https://github.com/Haxxnet/Compose-Examples/blob/main/examples/grafana-monitoring/volume-data/promtail/promtail-config.yml
specifically:
  - job_name: traefik
    static_configs:
    - targets:
        - localhost
      labels:
        job: traefiklogs
        __path__: /var/log/traefik/*.log
those logs are traefik access logs.
Perfect that you got it sorted. Sorry, could not grasp exactly what you meant due to the missing file reference.
Correct, the promtail config references to the access logs. Promtail will take those access logs and pass it to Loki. Loki will then store them. If you configure Loki within Grafana, you will be able to work on those access logs (e.g. filter them, parse them etc.).
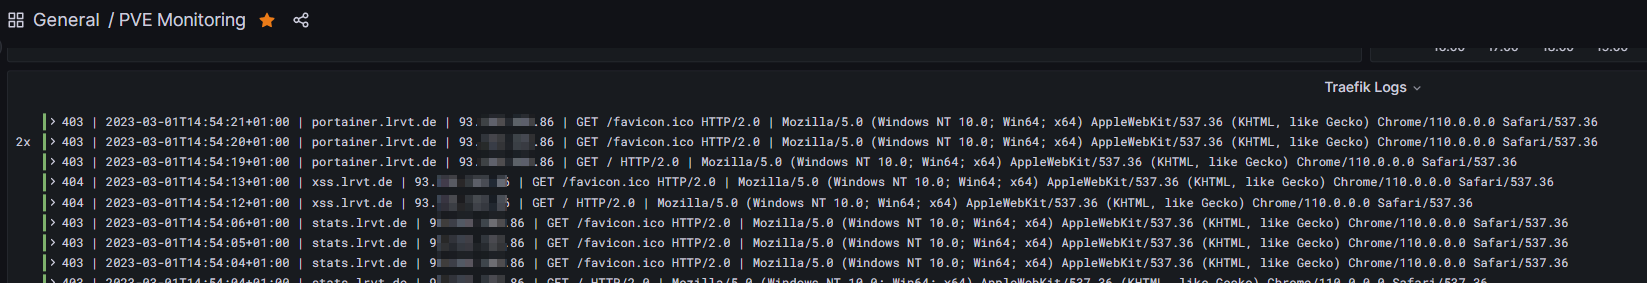
I use the following Loki query, which works great:
{job="traefiklogs"} | json | line_format "{{.OriginStatus}} | {{.time}} | {{.RequestAddr}} | {{.ClientHost}} | {{.RequestMethod}} {{.RequestPath}} {{.RequestProtocol}} | {{.request_User_Agent}}" != "192.168" != "172."
Looks then something like this: