Jira user.js browser extension for draw pie chart of assign history.
User.js or userjs script for add functionality analyze assignees participation in current issue.
Script primary written for Chromium browser and off course should work with Google Chrome.
With Greasemonkey extension it also supported in Firefox.
Other browsers also may support that, but it is not intended and not tested. If someone need it, and it is not work, please file a ticket. For required extensions please look for example at http://wiki.greasespot.net/Cross-browser_userscripting and http://userscripts.ru/ (in Russian).
Just go to link. Browser should ask you permission install it.
Based on google visialisation API and Jira REST API it should work in almost all versions and sites.
Examples by issue https://jira.atlassian.com/browse/JRA-31917
- Once it installed it automatically adds button in dates block:
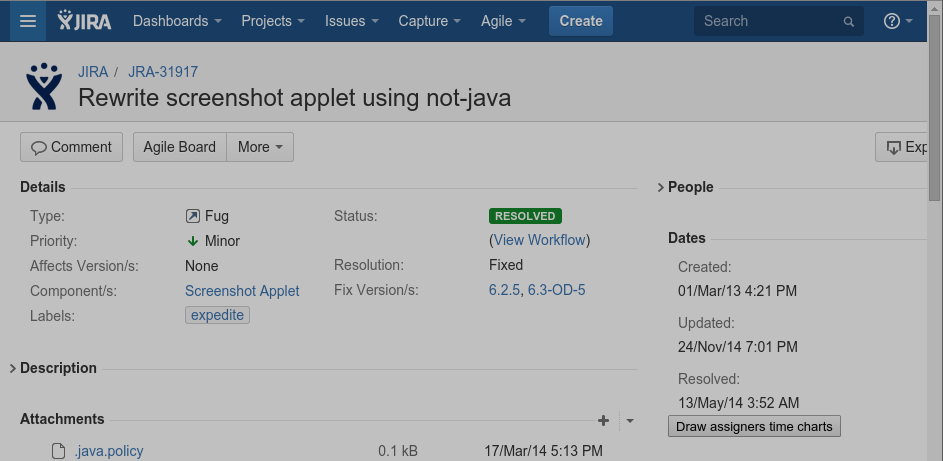 .
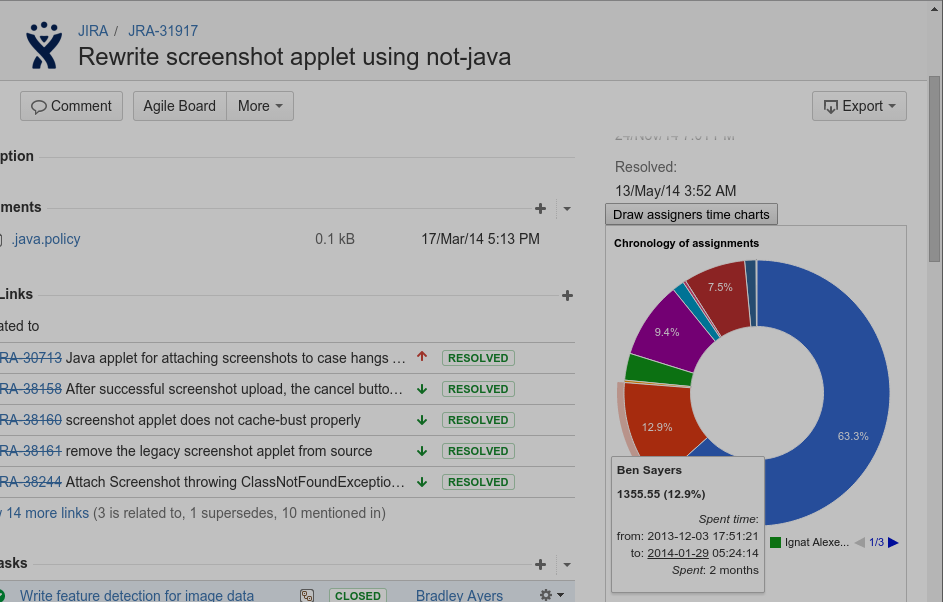
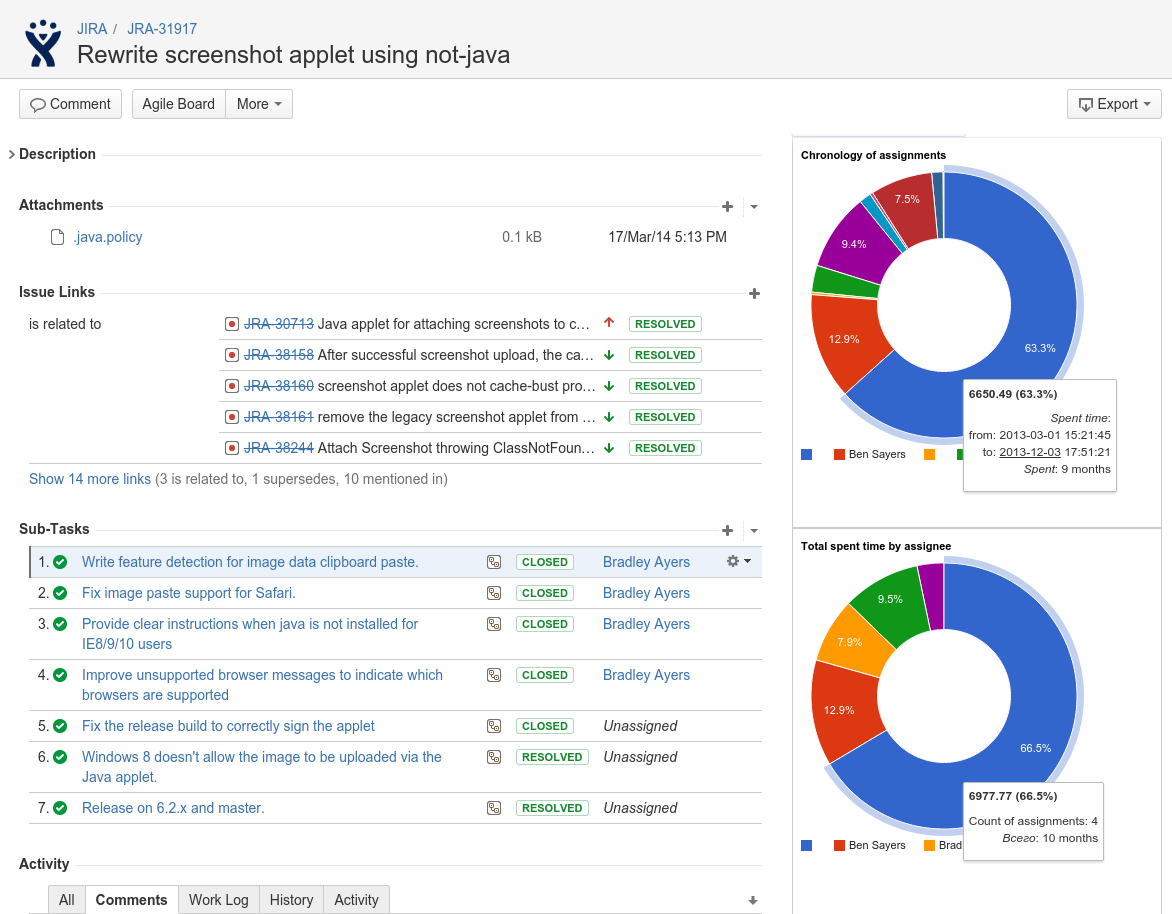
. - By click, it retrieves full issue changelog and draw chart by each assegment:
- and summary time by assignee:
Script licensed under GNU GPLv3 license without any warranty. Please look at LICENSE file for full text.