Read Me
this code is for loading .mat file of matlab and drawing histogram.
method:
- use scipy.io to load .mat file
- data in .mat file of matlab would be converted into dictionary in python, and the datatype in the dictionary is numpy.array
- after loading data, we can use plt and seaborn to draw the histogram
results
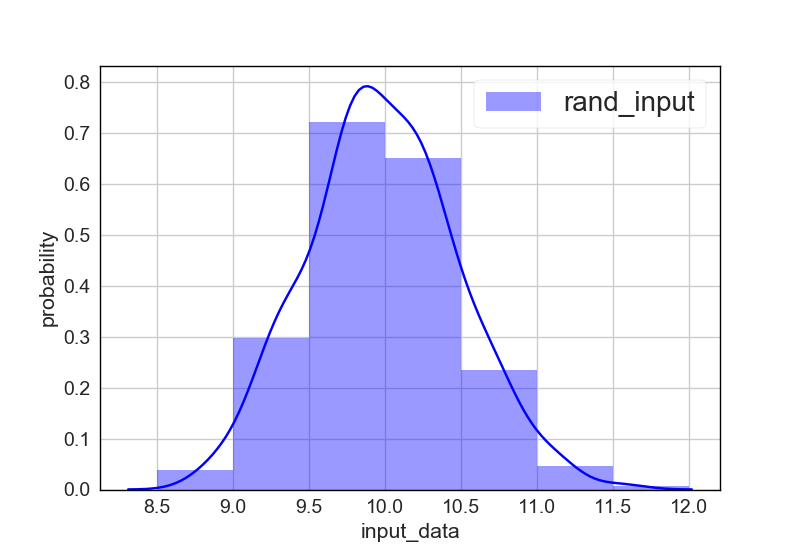
- kde=True
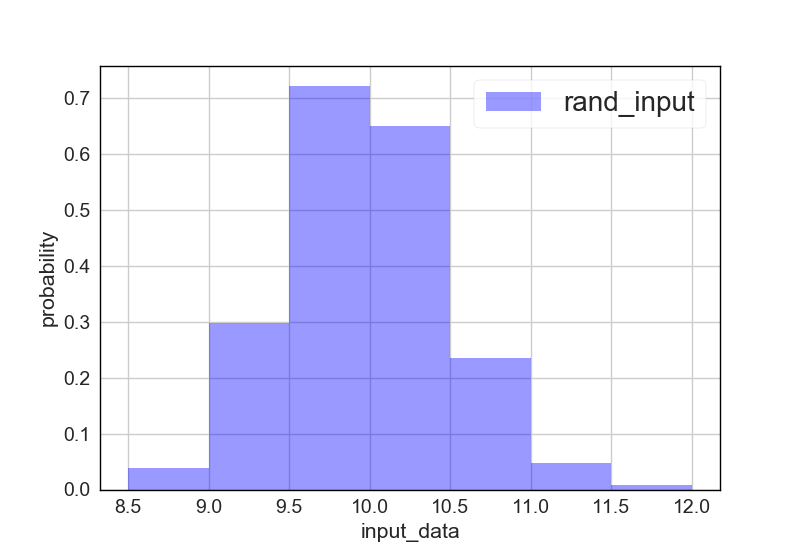
- kde=False