Hypertrace is the modern Observability platform and when we talk about Observability, these are the four pillars of the Observability Engineering team’s charter:
- Monitoring
- Alerting/visualization
- Distributed systems tracing infrastructure
- Log aggregation/analytics
Alerting is the entry point for most of the debugging workflows and all the modern DevOps teams are required to have a reactive mechanism in a place to quickly identify and mitigate the failures.
- Get an alert whenever there is a sudden spike/ sharp increase in latency of any operation/ API calls from or to my service.
- Get an alert whenever there is a sudden spike in traffic/ increase in call rate to my service/ API.
- Get an alert whenever there is a sudden spike in errors/ increase in error rate for my service.
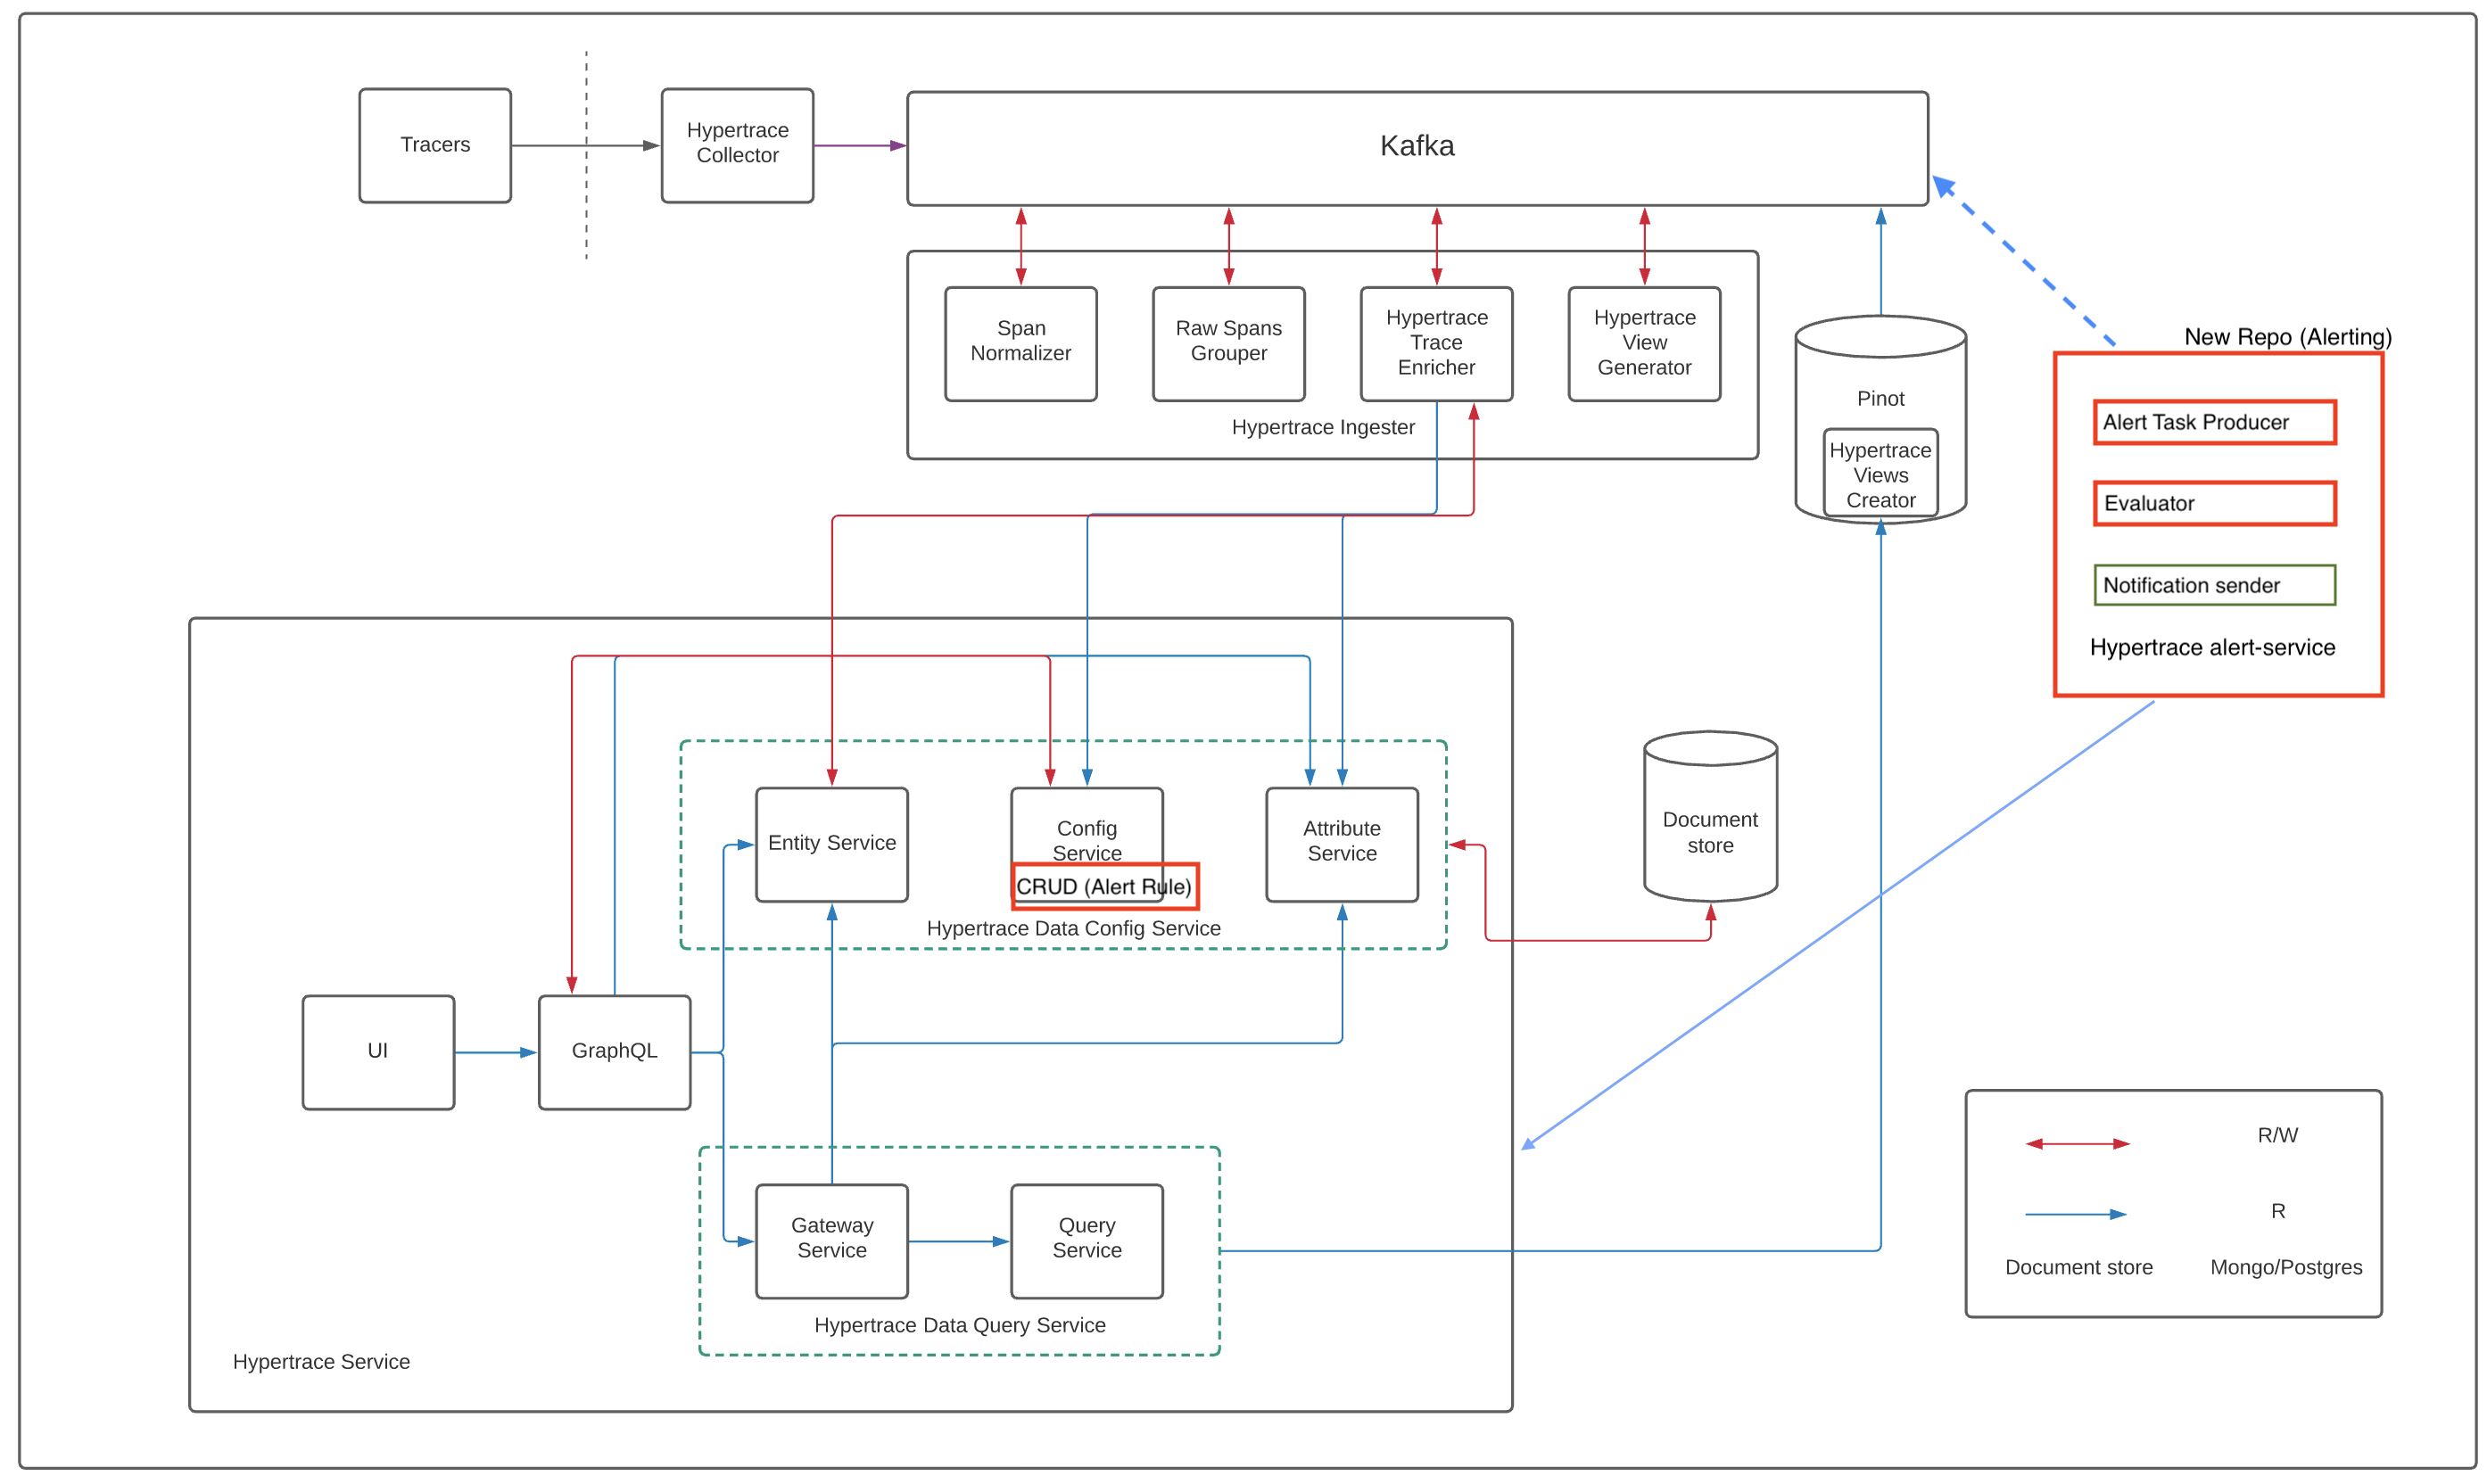
Currently, we support setting up the rules via a config or via deployment. However, in the UI, we will have a way to list the alert rules and notification configuration. If we closely look at the alerting service, we see that it is simply an anomaly condition from a baseline for a particular metric. So to meet the requirements, we have a metric anomaly definition (alert rule) which consists of metric selection and baseline calculation steps. Then we have an anomaly evaluation engine which evaluates this rule over a metric (alert rule evaluation engine) and an alert notification engine (notification sender) to send the notifications for alerting. Overall architecture diagram now looks like:
Below is a sample alert rule.
[
  {
    "id": "notification_rule_1",
    "ruleName": "high_avg_latency",
    "description": "Alert for high avg latency of payment service",
    "eventConditionId": "event_condition_1",
    "eventConditionType": "metricAnomalyEventCondition",
    "channelId": "channel-id-1",
    "eventCondition" :  {
      "metricSelection": {
        "metricAttribute": {
          "key": "duration",
          "scope": "SERVICE"
        },
        "metricAggregationFunction": "METRIC_AGGREGATION_FUNCTION_TYPE_AVG",
        "metricAggregationInterval": "PT15S",
        "filter": {
          "leafFilter": {
            "lhsExpression": {
              "attribute": {
                "key": "name",
                "scope": "SERVICE"
              }
            },
            "valueOperator": "VALUE_OPERATOR_EQ",
            "rhsExpression": {
              "stringValue": "customer"
            }
          }
        }
      },
      "violationCondition": [{
        "staticThresholdCondition": {
          "operator": "STATIC_THRESHOLD_OPERATOR_GT",
          "value": 5.0,
          "minimumViolationDuration": "PT5S",
          "severity": "SEVERITY_CRITICAL"
        }
      }]
    }
  }
]
Various fields of the rule are:
-
id : It specifies the rule id
-
rulename: It specifies the rule name
-
description: It specifies the description of the rule
-
eventConditionId: It refers to id of the event condition for which we want the alert
-
eventConditionType: It refers to the type of event condition for which we want the alert
-
channelId: It refers to the channel over which notifications would be sent (should have a corressponding notification config)
-
eventCondition: It specifies the exact event, based on which alerts would be rolled out. It has two main parts:
- metricSelection
-
First we specify the metric attribute and its scope using metricAttribute field. Currently we support alerts on metrics like numCall / duration / error count where the scope could be at API or SERVICE level.
-
Then we need to specify the metric aggretgation function which would be used to aggregated the data points over the specified time interval (granularity). This can be configured using metricAggregationFunction and metricAggregationInterval fields respectively.
-
Next we need to select a filter to be applied on the respective SERVICE/API as there can be multiple services/apis. As an example, the above rule uses the filter : "select the service where service name is customer".
-
violationCondition/baseline
Baseline can be fixed or dynamic (based on past data points). Currently we support fixed baseline based on which anomaly would be decided. As an example, the above rule uses the baseline : "raise an anomaly when the selected metric value is greater than 5 for all the points in the 15s duration". (Currently the violation condition is violated when all the points in that interval violate the condition)
At a time there can be multiple rules configured so we need a mechanism to evaluate all the rules and at all the times for alert to be useful/appropriate. For this we have an evaluation engine which in background, keeps on evaluating all the rules in a periodic fashion at every configured time interval (say every 1 minute). At a high level, for a given rule the evaluation engine will first fetch all the metric points of metric as per selection definition for configured time by firing query to the data store (pinot in our case). For example say if configured time is 1 minute, and granularity is 15s, there will be a maximum of 4 points received, and if it's 1 min, there will be 1 data point received. Similarly, the engine will fetch all the metrics points for the required baseline for all the rules and then evaluate all these points against the violation condition. For one alert rule,if all points violate, alert is raised and send via slack/email.
Currently, we support sending alert notification via slack. Sample slack notification looks like:
To run the alerting service on docker or a k8 cluster, refer to the docs.

