This tool collects AWS EC2 Cloudwatch stats of all EC2 instances in selected regions for the last two weeks and save them to a json file with a name such as ec2stats-2018-02-15.json.
python e2stats.py -k YOUR_ACCESS_KEY -s YOUR_SECRET_ACCESS_KEY
Or specify the directory of the aws credential file, otherwise it will look for .botoconfig in current directory.
python e2stats.py -c C:\Users\Bezos\.aws
It calls REST API to analyze the logs and the result will be printed on screen and saved as a json file with a name such as ec2summary-2018-02-15.
-----------------------------------Average CPU Utilization-----------------------------------
                    Distribution                    |                Summary
CPU%     : 10  20  30  40  50  60  70  80  90  100  | Min    Max    Mean   <=5%   <=10%  <=30%
Instances: 10  1   0   0   0   0   0   0   0   0    | 0.0%   11.0%  2.7%   9      10     11

-----------------------------------Maximum CPU Utilization-----------------------------------
                    Distribution                    |                Summary
CPU%     : 10  20  30  40  50  60  70  80  90  100  | Min    Max    Mean   <=5%   <=10%  <=30%
Instances: 2   1   0   2   0   0   0   0   0   6    | 3.0%   100.0% 62.5%  1      2      3

--------------------------------Distribution of Instance Types-------------------------------
t2.micro  :   3 | t2.small  :   3 | m5.large  :   2 | t2.large  :   1 | t2.medium :   1
t2.nano   :   1 |

-----------------------------------Distribution of Regions-----------------------------------
us-west-2 :   9 | us-east-2 :   2 |

-----------   Efficiency Compared to Users with Monthy Spending Around $1000      -----------
Your Efficiency     :      32 | Average             :      53 | Efficient Users     :      65

-------------------------Under-Utilized Instances: Avg<=5%, Max<=30%------------------------
i-04a85e6c382d29353 :us-west-2
i-0ba2f26b635b910e3 :us-west-2
i-04617102e11910453 :us-west-2
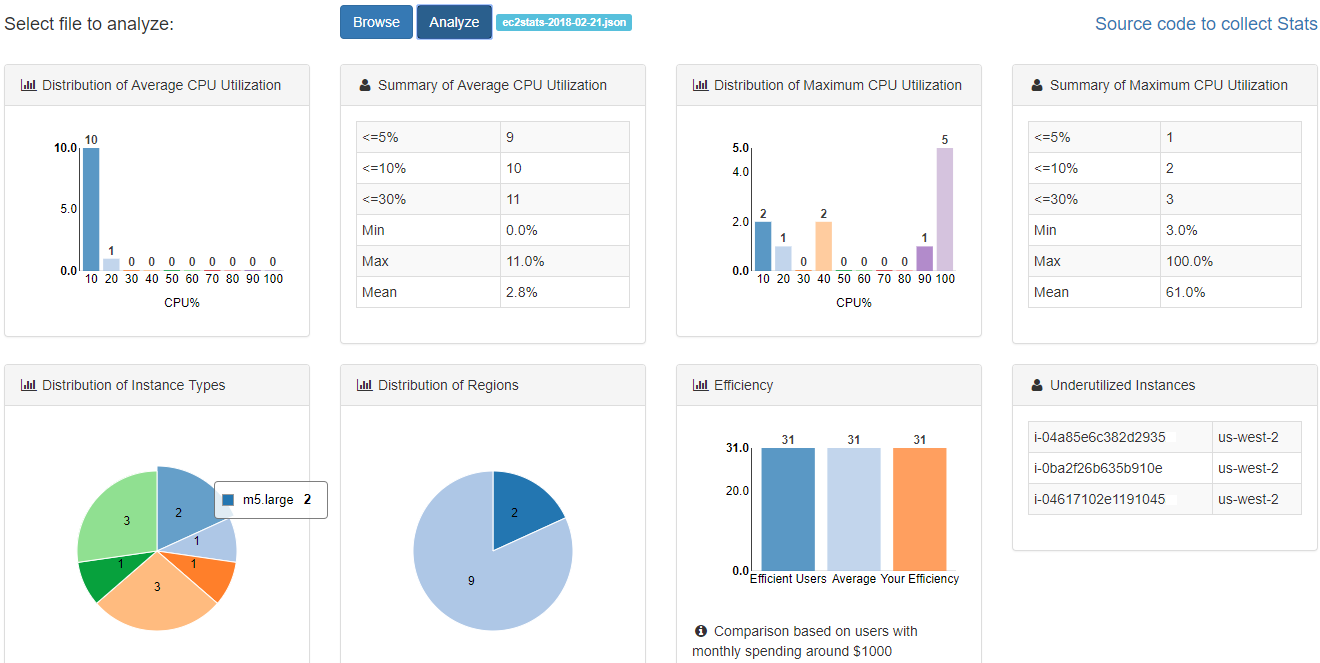
A better way to view the result is to visit https://customer.fittedcloud.com/v1/ec2stats and upload the ec2stats-xxxx-xx-xx.json file.
Other options:
-a False: Skip analysis
-v False: Turn off printing on screen
-l fileName: Load existing stats file instead of collecting from Cloudwatch
-t 5 10: Return under-utilized instance with Average CPU <= 5% and Maximum CPU <= 10%
-c C:\Users\Bezos\.aws: Parent directory of aws config
-p dev: profile
Here is example of the result of the analysis:
- Average: Analysis of average CPU utilization. It includes the number of instances with CPU less than 5%, 10%, and 30%. And the distribution of average CPU utilization.
- Maximum: Analysis of maximum CPU utilization. Similar to above.
- Efficiency: Efficiency score compared to other users.
- InstanceTypes: Instance types distribution.
- Regions: Distribution of instances across regions.
- UnderUtilized: List of under-utilized instances.
- Threshold: Threshold for Avg and Max CPU utilization for under-utilized instances.
    "Summary": {
      "Average": {
        "U5%": 10,
        "U10%": 13,
        "U30%": 14,
        "Min": 0,
        "Max": 15,
        "Mean": 3,
        "Histogram": [
          [
            10,
            13
          ],
          ...
          [
            100,
            0
          ]
        ]
      },
      "Maximum": {
        "U5%": 1,
        "U10%": 2,
        "U30%": 7
        "Min": 3,
        "Max": 100,
        "Mean": 54,
        "Histogram": [
          [
            10,
            2
          ],
          ...
          [
            100,
            6
          ]
        ]
      },
      "Efficiency": [
        "Average": 49,
        "Efficient": 60,
        "Efficiency": 35,
        "CostLevel": 1000
      ],
      "InstanceTypes": [
        [
          "m4.xlarge",
          "1"
        ],
        ...
      ],
      "Regions": [
        [
          "us-west-2",
          "3"
        ]
        ...
      ],
      "UnderUtilized": [
        [
          "i-04a85e6c382d29353",
          "us-west-2"
        ]
        ...
      ],
      "Threshold": [
        {
          "Avg": 5,
          "Max": 30
        }
      ]
    }
