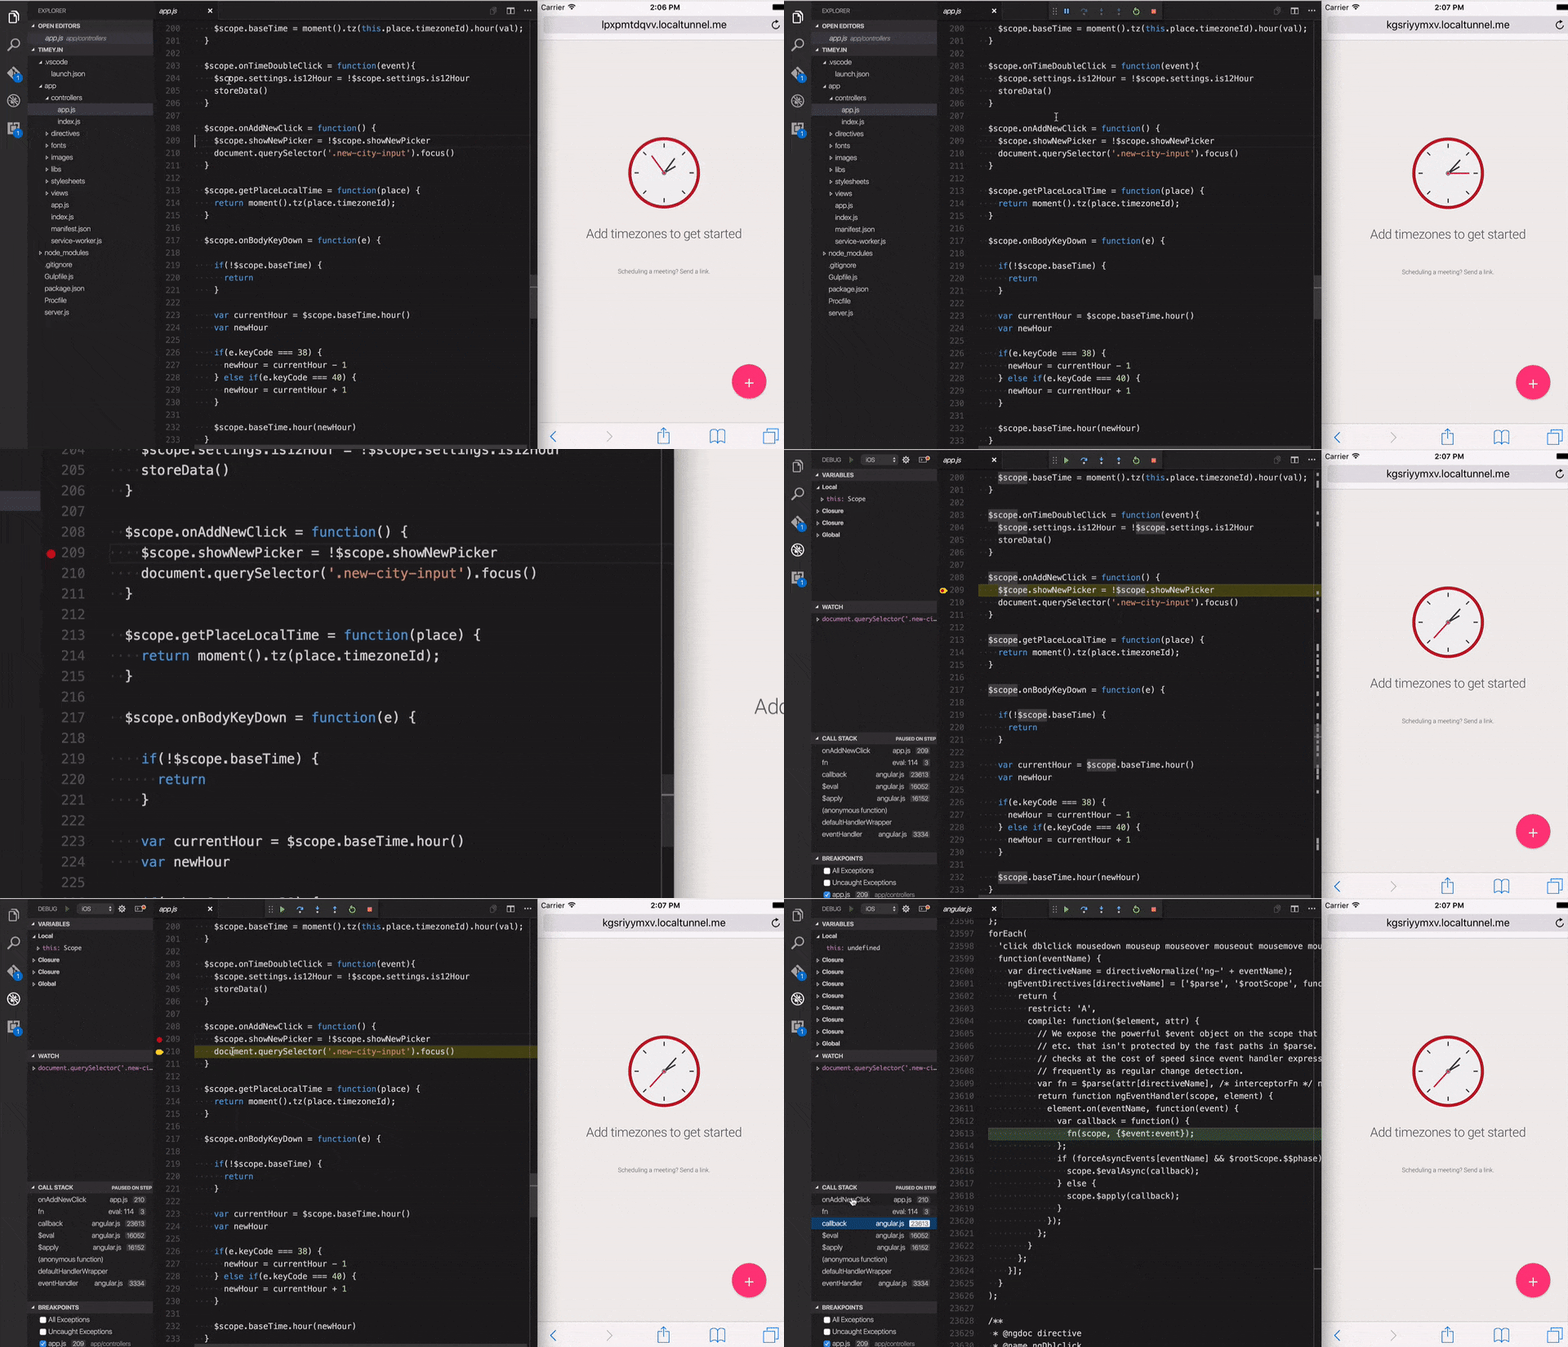
The iOS Web debugger has been deprecated, and we recommend you using remotedebug-ios-webkit-adaptor together with VS Code. A guide can be read here https://medium.com/@auchenberg/hello-remotedebug-ios-webkit-adapter-debug-safari-and-ios-webviews-from-anywhere-2a8553df7465.
The VS Code iOS Web Debugger allows to debug your JavaScript code running in Safari on iOS devices (and iOS Simulators) from VS Code both on Windows and Mac without addtional tools.
Supported features
- Setting breakpoints, including in source files when source maps are enabled
- Stepping
- Stack traces
- Locals
- Debugging eval scripts, script tags, and scripts that are added dynamically
- Watches
- Console
- Virtual port forwarding via HTTP tunnel from local computer.
Unsupported scenarios
- Debugging web workers
- Any features that aren't script debugging.
Before you use the debugger you need to make sure you have the latest version of iTunes installed, as we need a few libraries provided by iTunes to talk to the iOS devices.
Nothing to do as there is a proxy included with the extension from the vs-libimobile npm package
Make sure you have Homebrew installed, and run the following command to install ios-webkit-debug-proxy
brew install ios-webkit-debug-proxy
On your iOS device then go to Settings > Safari > Advanced, and enable the Web Inspector option.
When your launch config is set up, you can debug your project! Pick a launch config from the dropdown on the Debug pane in Code. Press the play button or F5 to start.
The extension operates in two modes - it can launch a URL in Safari on the device, or it can attach to a running tab inside Safari. Just like when using the Node debugger, you configure these modes with a .vscode/launch.json file in the root directory of your project. You can create this file manually, or Code will create one for you if you try to run your project, and it doesn't exist yet.
To use this extension, you must first open the folder containing the project you want to work on.
Two example launch.json configs. You must specify either file or url to launch Chrome against a local file or a url. If you use a url, set webRoot to the directory that files are served from. This can be either an absolute path or a path relative to the workspace (the folder open in Code). It's used to resolve urls (like "http://localhost/app.js") to a file on disk (like "/users/me/project/app.js"), so be careful that it's set correctly.
{
    "version": "0.1.0",
    "configurations": [
        {
            "name": "iOS - Launch localhost with sourcemaps",
            "type": "ios",
            "request": "launch",
            "port": 9222,
            "url": "http://dev.domain.com/",
            "webRoot": "${workspaceRoot}",
            "deviceName": "*",
            "sourceMaps": true
        },
        {
            "name": "iOS - Launch localhost with sourcemaps via Tunnel",
            "type": "ios",
            "request": "launch",
            "port": 9222,
            "webRoot": "${workspaceRoot}",
            "deviceName": "*",
            "sourceMaps": true,
            "tunnelPort": 8080
        }
    ]
}
Attach to an already running browser tab in Safari by using the url to match the correct tab
An example launch.json config.
{
    "version": "0.1.0",
    "configurations": [
      {
          "name": "iOS - Attach",
          "type": "ios",
          "request": "attach",
          "port": 9222,
          "sourceMaps": true,
          "url": "http://dev.domain.com/",
          "webRoot": "${workspaceRoot}",
          "deviceName": "*"
      }
    ]
}diagnosticLogging: When true, the adapter logs its own diagnostic info to the consoledeviceName: The name of the devices, if multiple devices are connected.*matches any device.tunnelPort: Port to be tunnel via local HTTP port. Usually theportyour developer server is running on.
Please have a look at vscode-chrome-debug for additional troubleshooting and options.
=== This project has adopted the Microsoft Open Source Code of Conduct. For more information see the Code of Conduct FAQ or contact opencode@microsoft.com with any additional questions or comments.

