Refer to the issue, this document will reproduce functional analysis using DOSE and clusterProfiler packages.
The paper and supplemental files are located at paper folder.
In page 63 of supplemental file, the authors mentioned that genes with high contribution of individuals to splicing variation were used in GO enrichment analysis.
The Individual and Tissue contribution to variation of splicing was stored in supplemental table 17, which was exported as a csv file.
require(magrittr)
require(DOSE)
require(RDAVIDWebService)
require(clusterProfiler)

table17 <- read.csv("paper/tableS17.csv")

gene <- with(table17, gene_id[ Individuals > quantile(Individuals, 0.98)])
gene %<>% as.character %>% gsub("\\.\\d+", "", .)

head(gene)

## [1] "ENSG00000002586" "ENSG00000011007" "ENSG00000014164" "ENSG00000042753"
## [5] "ENSG00000051620" "ENSG00000055130"

length(gene)

## [1] 212

save(gene, file="cache/gene.rda")
The authors did not mention how they define high contribution, here I use the top 2% of genes and get 212 genes with 168 genes that could be mapped in the DAVID database. Slightly large than the number (139) reported in supplemental file.
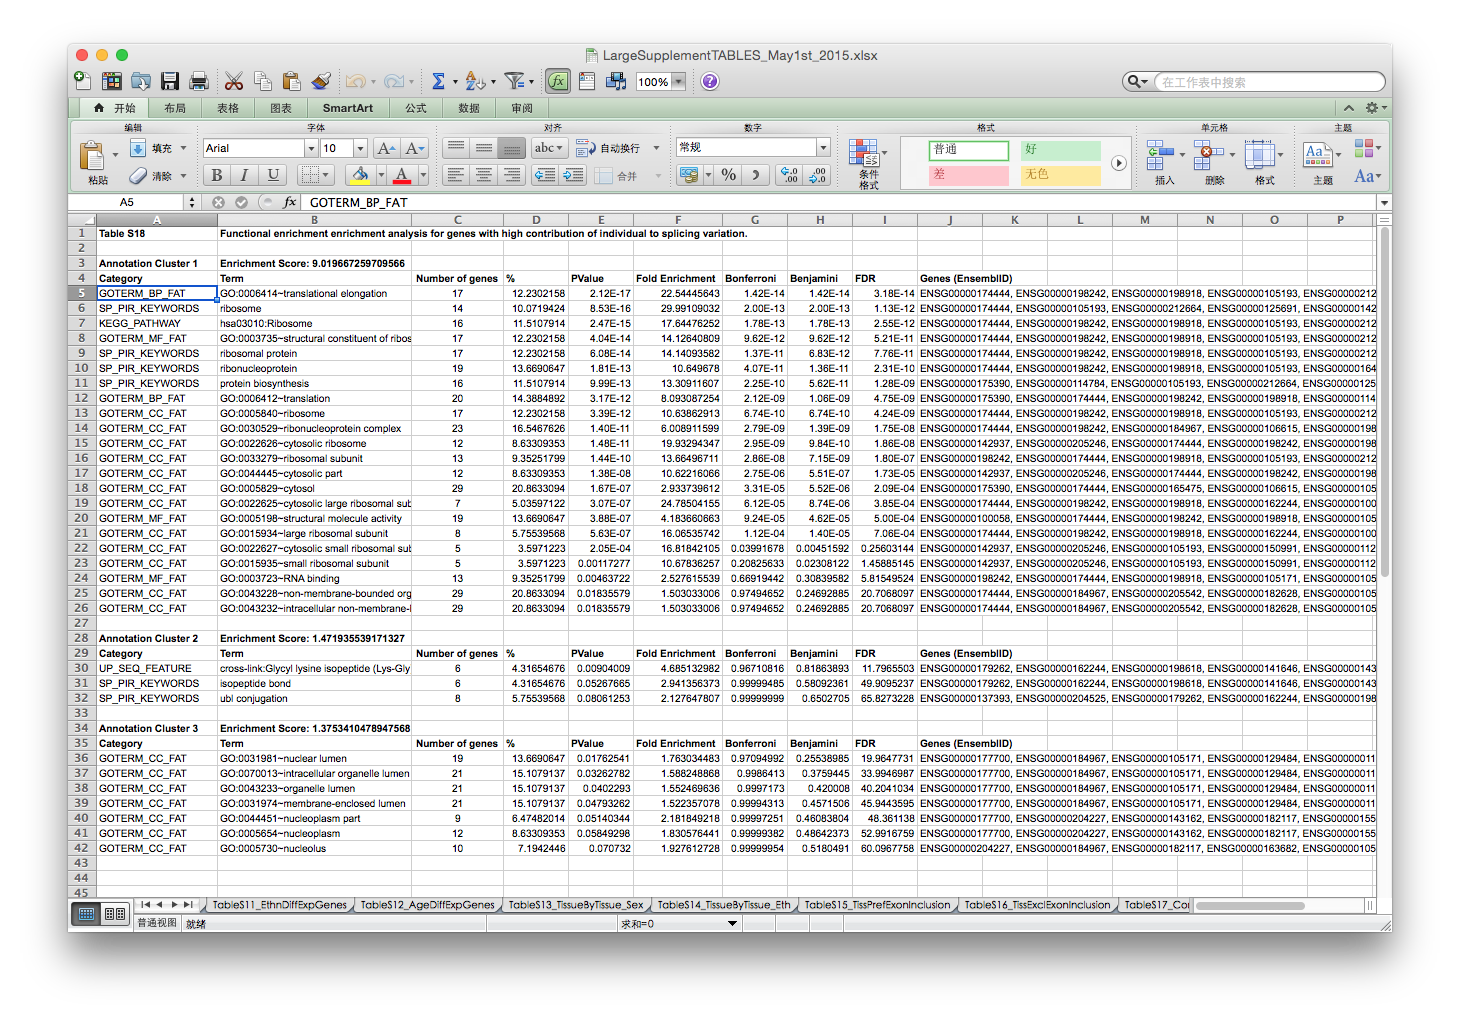
The GO enrichment result reported in supplemental table 18 is:
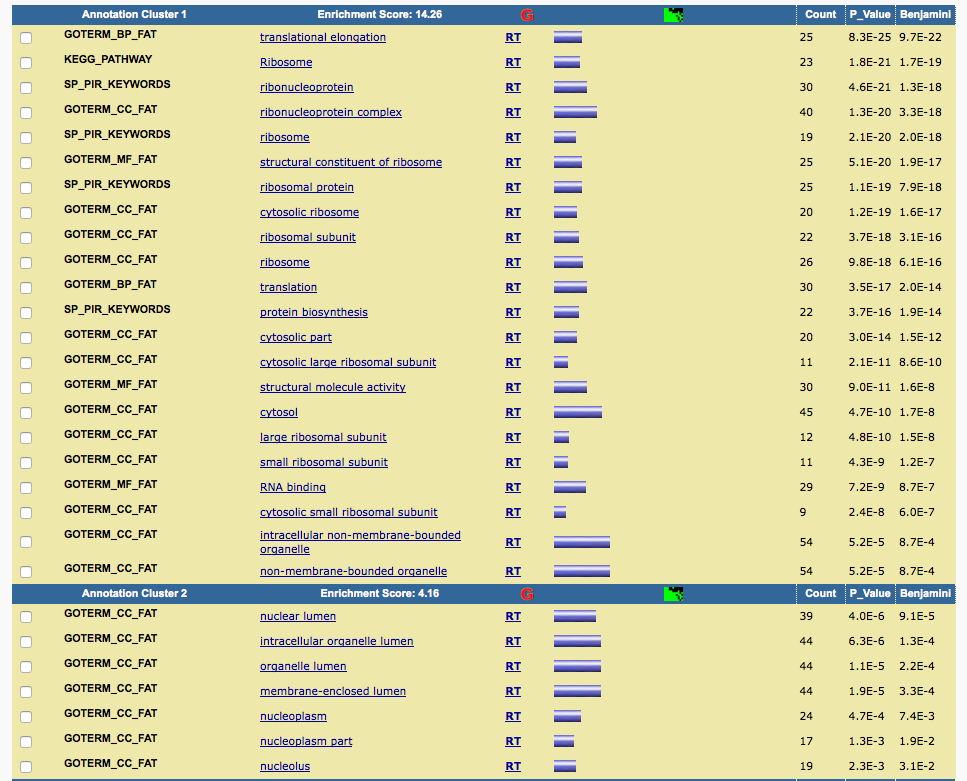
I pasted the genes into DAVID and got similar results.
Although the gene list I selected here is slighly different from the one author selected (which we don't know), it can reproduce the results reported in the paper.
Here, I use these genes to perform enrichment analyses and compare results from DAVID and clusterProfiler.


