Python Plotly App Visualization for CHSI Dataset
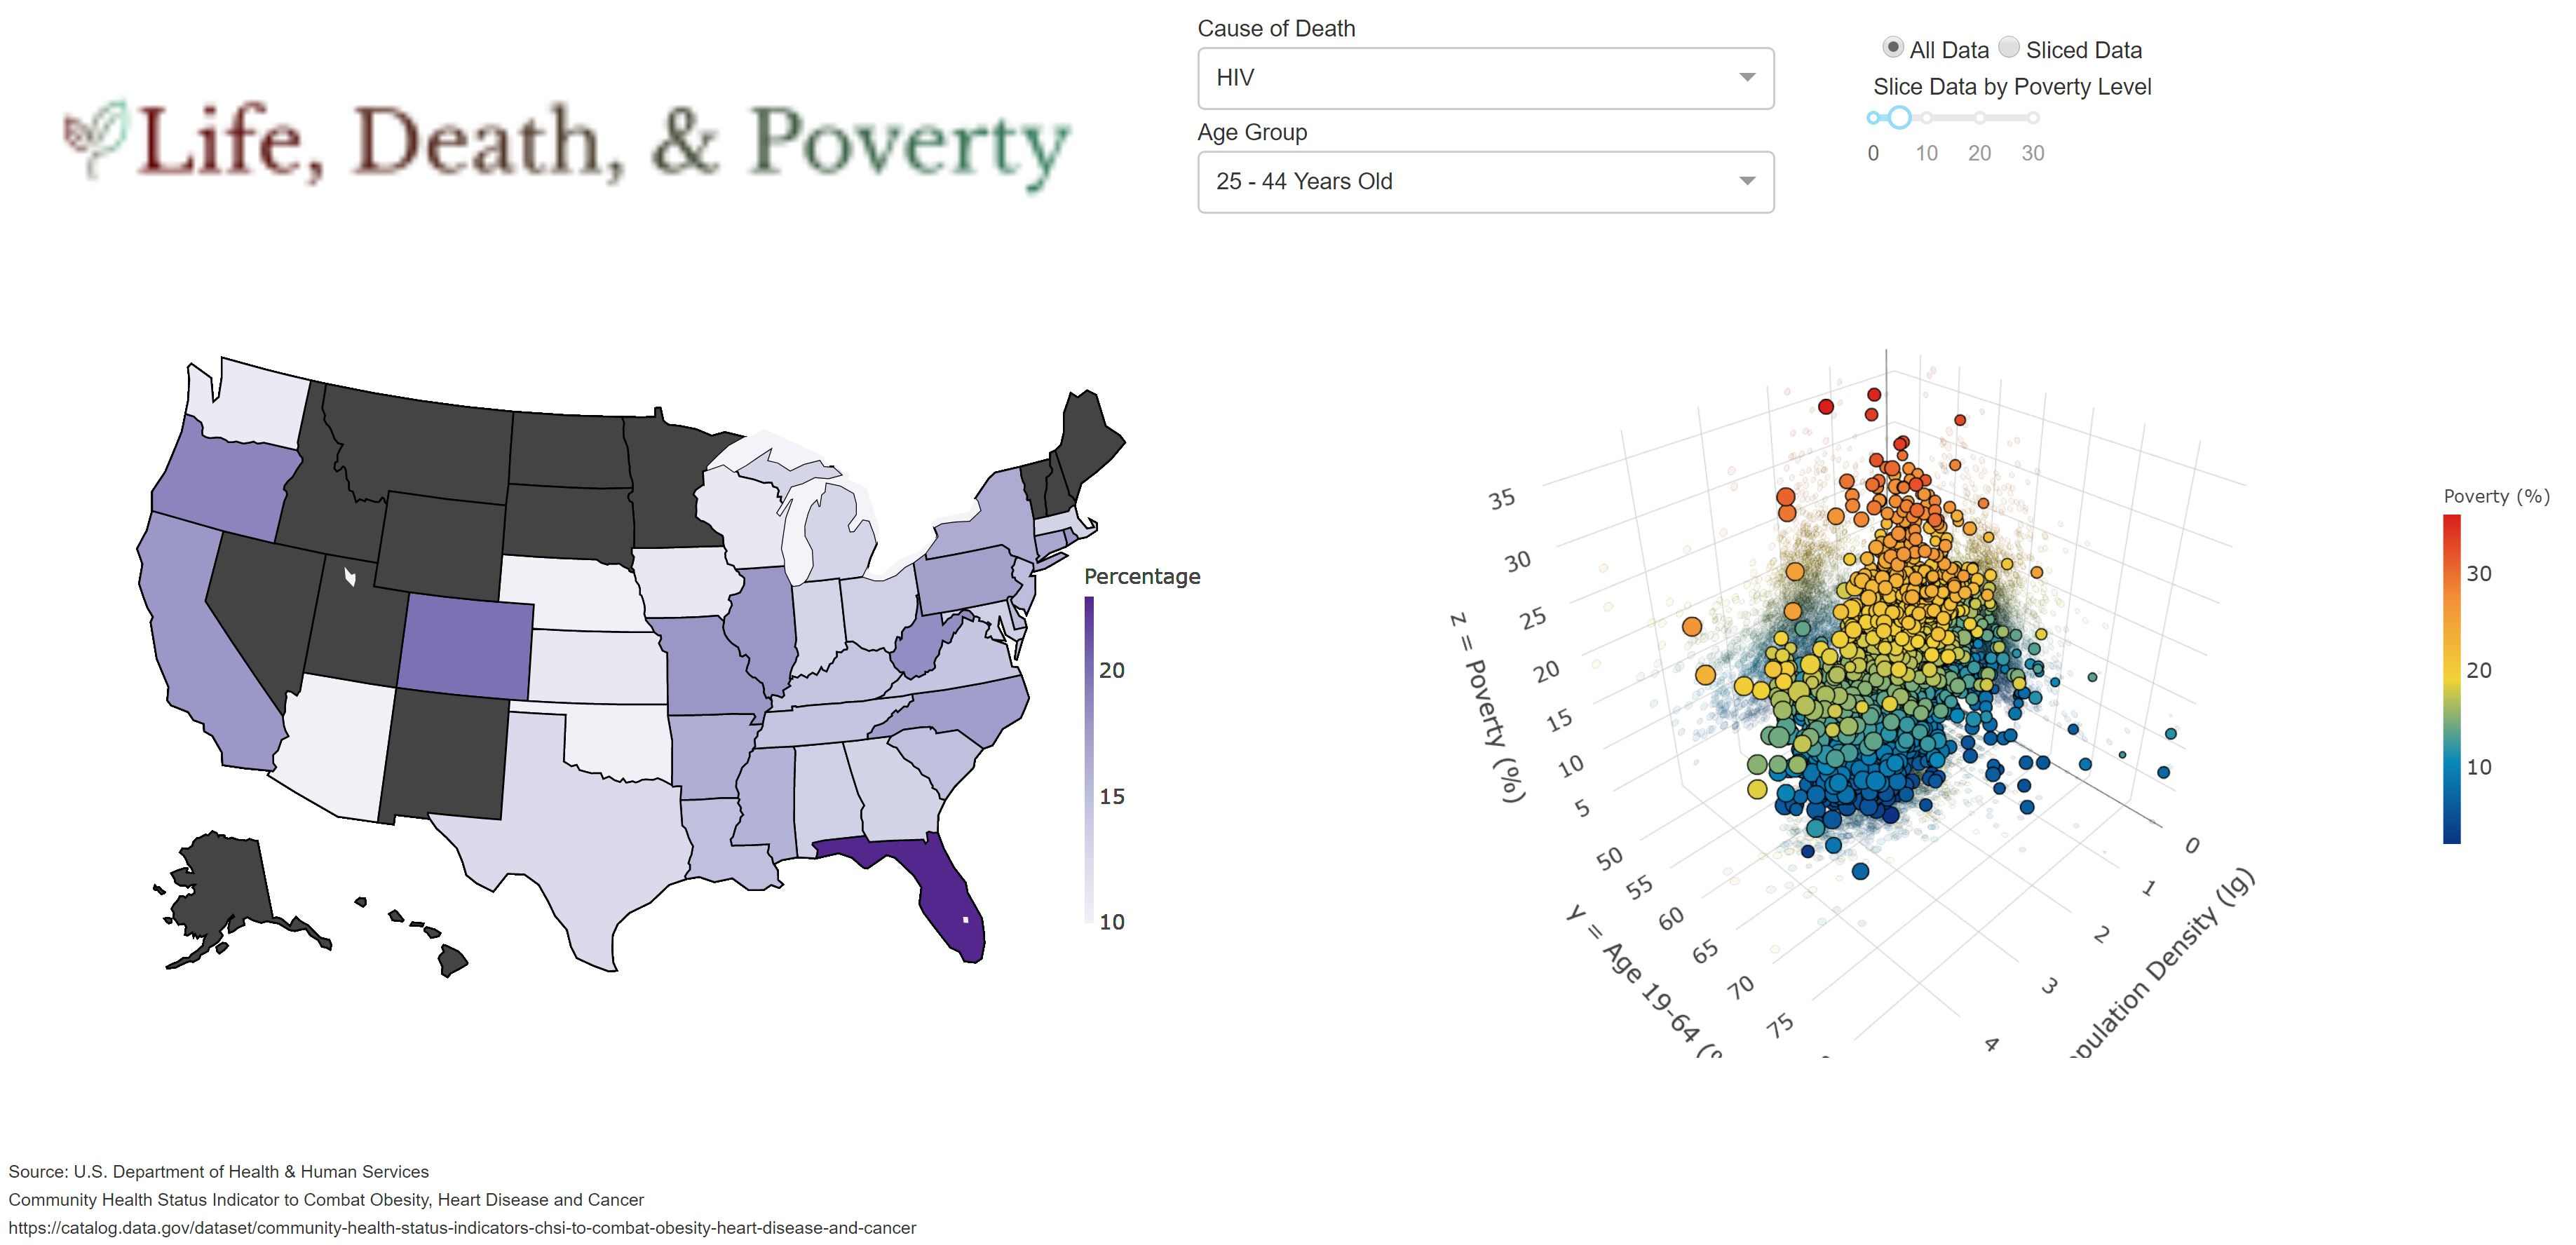
【Life, Death & Poverty】
https://tragically-eh-20397.herokuapp.com/
3D Scatter only
http://dash-app-chsi.herokuapp.com/
Watch the demo video
https://youtu.be/5UCsV16RPs0
Community Health Status Indicators (CHSI) to Combat Obesity, Heart Disease and Cancer
Centers for Disease Control and Prevention
Metadata Updated: June 3, 2019
To run a local development server, at root directory:
[pipenv run] python app.py
To deploy on Heroku, git add and commit, then do:
git push heroku master
Screen Recording
https://www.apowersoft.com/free-online-screen-recorder
Mp4 to Gif, Change Gif Speed, Compress Gif, etc.
https://ezgif.com/video-to-gif
2019-07-01 Project created
2019-07-05 Project finished
2019-06-29 Run Plotly Online or Offline in Colab
https://colab.research.google.com/drive/1oijny-_J2K-7ma6jNq9jAp7C_tzNB27W
2019-06-29 Plotly Express and Dash Examples
https://colab.research.google.com/drive/1qQPYu4GC0HeiNqLR2kJ1w4C4IGfu0ezI
2019-07-05 Deployment Logs
https://github.com/Nov05/CHSI-Dash-deploy