Support showing the elevation segments on the Altitude area chart directly
jtpio opened this issue · 3 comments
Subject of the issue
This is more of a feature request than an issue.
Your environment
- leaflet-elevation: 2.3.0
- leaflet: 1.7.1
- browser: Firefox 112
- operating system: Fedora 37
- link to your project: N/A
Steps to reproduce
Using any example: https://github.com/Raruto/leaflet-elevation/tree/master/examples
Expected behaviour
It would be nice to have something similar to what Leaflet.Heightgraph provides: https://github.com/GIScience/Leaflet.Heightgraph
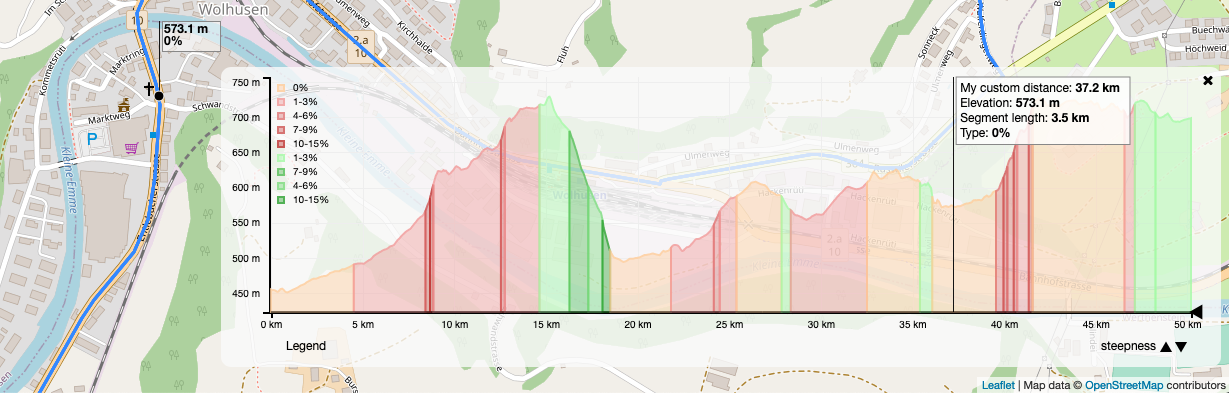
For reference Openrunner has something similar as well and even shows the percentage as part of the tooltip:

This could be an opt-in option and it wouldn't be displayed by default.
Actual behaviour
This doesn't seem to be configurable currently. There is a Slope chart but it adds an additional chart on top of the Altitude.
Thanks!
Hi @jtpio,
definitely it would be something nice, are you able to contribute to this project? (if so, I can give you some knowledgeable advice on where to start).
👋 Raruto
Thanks @Raruto.
Yes I would be happy to contribute. Not sure I'll have the bandwidth in the coming days, but some pointers would definitely help!
It would be nice to have something similar to what
Leaflet.Heightgraphprovides: https://github.com/GIScience/Leaflet.Heightgraph
The following should be the related function that handles the d3js segments on the graph (look directly at Robin's fork which should be more up-to-date).
• boldtrn/Leaflet.Heightgraphsrc/heightgraph.js#L715-L733
/**
 * Appends the areas to the graph
 */
_appendAreas(block, idx, eleIdx) {

  const c = this._categories[idx].attributes[eleIdx].color

  this._area = d3Area()
    .x(d => {
      const xDiagonalCoordinate = this._x(d.position)
      d.xDiagonalCoordinate = xDiagonalCoordinate
      return xDiagonalCoordinate
    })
   .y0(this._svgHeight)
   .y1(d => this._y(d.altitude))
   .curve(curveLinear);

 this._areapath = this._svg.append("path").attr("class", "area");

 this._areapath.datum(block)
   .attr("d", this._area)
   .attr("stroke", c)

 Object.entries(this._graphStyle).forEach(([prop, val]) => {
   this._areapath.style(prop, val)
 })

 this._areapath
   .style("fill", c)
   .style("pointer-events", "none");
}
This could be an opt-in option and it wouldn't be displayed by default.
Currently all additional chart area definitions (altitude, speed, acceleration, ...) are lazy-loaded from the src/handlers.
So I think a good way to achieve this could be to create a custom definition for this type of graph as well.
It sure won't work out of the box, but maybe with a little tweaking of the "loading" logic it might even turn out to be something more useful.
Below some notable functions:
• L.Control.Elevation::options.handlers
leaflet-elevation/examples/leaflet-elevation_extended-ui.html
Lines 255 to 271 in b0006d6
• L.Control.Elevation::_registerHandler
leaflet-elevation/src/control.js
Lines 1080 to 1147 in b0006d6
• L.Control.Elevation::_registerDataAttribute
leaflet-elevation/src/control.js
Lines 1003 to 1078 in b0006d6
Within the /test folder you can also see a proof of concept on how you can start developing any new feature (that is, before you even start attempting to modify library code).
That means, you can always monkey patch any native functionality through the L.Control.Elevation.include() and then use some d3js "selectors" to alter the chart.
• L.Control.Elevation.include
leaflet-elevation/test/index.html
Lines 39 to 100 in b0006d6
Within the examples/leaflet-elevation_dynamic-runner.html demo you can also see a more complete use case of this development pattern.
And finally, for some automated testing you can look at anyone of *.spec.js file within this repository.
Happy thoughts,
Raruto