Stopped Working after iOS v 12.2 upgrade
tonyrf opened this issue · 58 comments
The tool stopped working after the most recent iOS v12.2 release.
It was working for me on Window 7 Chrome + iPhone 7Plus until my phone just updated to iOS v12.2 (16E227).
The chrome://inspect/#devices only shows a service worker to inspect. It does not discover or allow me to inspect the url I have loaded in my phones Safari Browser.
I updated my iTunes and the ios_webkit_debug_proxy + remotedebug_ios_webkit_adapter to the most current version but it is still notr working.
The logging within the powershell remotedebug_ios_webkit_adapter --port=9222 window behaves the same as it did when it was working prior to the iOS update.
Does anyone have it working on a Windows PC with an iOS v12.2 device attached?
Same issue is here. Doesn't seem to work with iOS v12.1.2 either for me. :(
For me, it ends up with error 'HTTP/1.1 404 Not Found' when trying to inspect.
But it's still working on port 9222 via iPhone 6S (iOS v12.1.2), using latest version of chrome. 👍
This is caused by google/ios-webkit-debug-proxy#294 and requires changes into this adaptor.
Does "Closed" means that there is a fix for Windows based iPhone debugging or does it means it's not going to be fixed and there is no solution available?
@tonyrf This issue is still open. A solution needs to be found and built.
Wish I had of checked this before updating to the latest Safari...
Wish I had of checked this before updating to the latest Safari...
Yup me too, I missed the downgrade window of opportunity by 19hours
Same issue here. iPhone IOS 12.2. chrome://inspect shows device and url to inspect. Inspector popup window is blank and does not update.
Is anyone working on a solution for this?
@auchenberg
I'd like to submit a pull request to update the readme.md to reflect that this solution isn't working with the latest version of IOS. There is no work-around since you can't downgrade IOS. I spent a couple of hours working to get this up and running as well as climbing through issue tickets before I understood the problem. I would have rather spent those couple hours, perhaps, to help work on a solution. Displaying a message in the readme of the repo is the right thing to do to save others from wasting their time.
To make sure that I'm clear about the problem...it seems as if this library translates debugging APIs from Chrome to Safari. There has been discussion in this repo and the proxy repo maintained by Google. At this point, I think that it has been acknowledged that the update to fix the changes in Safari needs to happen in this repo?
I'm very excited by this repo and I'd like to get it working. It's unfortunate that Apple doesn't like playing with the rest of the world. This should probably be a solution that they contribute to the community vs. funded by MS and graciously by you.
I'd like to contribute to a solution if I'm able. Is anyone working on a solution now and would you except a second pull request for a solution if I'm able to complete it? Is there a sense for what it will take?
-Tom
@tonyrf Please open a PR with the suggestions. This project isn't maintained these days, only when community members helps out.
Have debugged the issue a while. Seems like the protocols for web inspection has changed in ios 12. When protocols/ios/ios.js tries to request all stylesheets from the ios unit, it sends the websocket message "CSS.getAllStyleSheets" (the enumerateStyleSheets method) but then the websocket receives the message below
"{"error":{"code":-32601,"message":"'CSS' domain was not found","data":[{"code":-32601,"message":"'CSS' domain was not found"}]},"id":-21}"
As hinted by @auchenberg in google/ios-webkit-debug-proxy#294 (comment) it seems that the target domains have been changed in ios 12 but I cannot find any references for it. (I have no more time to look any further either, just posting to let you know my findings if anyone else want's to give it a try.
(I also got errors from iosAdapter.js when invoking getDeviceVersion(uuid). My local installed vs-libimobile (or rather ideviceinfo.exe gave errors when invoking so I just returned "12.2" (my ios version) instead.)
Heyo, just popping in because I've been watching the issue and had a little time to research at work. Found a commit from another debugger that seems to mirror the change needed for this debugger:
appium/appium-remote-debugger@4a03ddc
Apologies, but I also will not be available to work on this.
Based on the info in google/ios-webkit-debug-proxy#294 (comment), I hacked together a fix for iOS 12.2 and 12.3 here:
https://github.com/arseneyr/remotedebug-ios-webkit-adapter/tree/ios12.2
This code is not ready for primetime and pretty much assumes you're running iOS >=12.2, so don't try it on anything lower.
We also wrote a fix based on appium's changes. But like @arseneyr it will only work for iOS >= 12.2:
@fishbone1 I tried your code and it didn't work.
I put it in my npm folder under remotedebug-ios-webkit-adapter folder, and run it on port 9000.
Did I miss something?
Edit:
I get this message in the console when trying to inspect (the inspect window is empty):
error.iosAdapter.getTargets.getDeviceVersion.failed.fallback, device=[object Object] (node:11736) UnhandledPromiseRejectionWarning: #<Object> (node:11736) UnhandledPromiseRejectionWarning: Unhandled promise rejection. This error originated either by throwing inside of an async function without a catch block, or by rejecting a promise which was not handled with .catch(). (rejection id: 1) (node:11736) [DEP0018] DeprecationWarning: Unhandled promise rejections are deprecated. In the future, promise rejections that are not handled will terminate the Node.js process with a non-zero exit code. (node:11736) UnhandledPromiseRejectionWarning: #<Object> (node:11736) UnhandledPromiseRejectionWarning: Unhandled promise rejection. This error originated either by throwing inside of an async function without a catch block, or by rejecting a promise which was not handled with .catch(). (rejection id: 2) (node:11736) UnhandledPromiseRejectionWarning: #<Object> (node:11736) UnhandledPromiseRejectionWarning: Unhandled promise rejection. This error originated either by throwing inside of an async function without a catch block, or by rejecting a promise which was not handled with .catch(). (rejection id: 3) (node:11736) UnhandledPromiseRejectionWarning: #<Object> (node:11736) UnhandledPromiseRejectionWarning: Unhandled promise rejection. This error originated either by throwing inside of an async function without a catch block, or by rejecting a promise which was not handled with .catch(). (rejection id: 4)
@tofik309 I run it with npm start. I also updated ios-webkit-debug-proxy to 1.8.4.
Works like a charm, thank you!
@tofik309 Glad to hear. Nevertheless there were some bugs which caused "Unhandled promise rejection" messages and broke some inspection features. I pushed the fixes a few seconds ago.
@fishbone1 npm install caused this error:
src\server.ts(47,41): error TS2339: Property 'port' does not exist on type 'string | AddressInfo'.
  Property 'port' does not exist on type 'string'.
I'm doing something wrong?
@MarekMlodzianowski This appears to be a typescript error at server.js where the return value of address() can be either a string (which won't have the property port) or AddressInfo, which will. I'm sure there are better ways, but I did the following at line 47:
        const ad = this._hs.address();
        const port = typeof ad === "string" ? 9999 : ad.port;
        if (port === 9999) {
            throw new Error("did not get an AddressInfo object");
        }
@wildcat63 @MarekMlodzianowski @fishbone1 Hello, I went through all the steps above and I am not getting any error. But still the Inspect tab is empty in chrome inspector.
@MarekMlodzianowski I pushed a fix but I'm not sure if it works
@vkasarora Please check that no other instances of the debug proxy are running. Are there any errors in the log? Also try to execute alert('test'); via console and check if the alert box appears on your device.
@fishbone1
Works with 12.3 but outputs the error in console:
error.iosAdapter.getTargets.getDeviceVersion.failed.fallback, device=[object Object]
Thanks @fishbone1, it was actually another instance causing the issue. It is fixed and working like before. Thanks!!
We also wrote a fix based on appium's changes. But like @arseneyr it will only work for iOS >= 12.2:
i put it in my npm folder and ran it with npm start with the newest ios-webkit-debug-proxy; however, it still did not work. when i tried to ran it, it showed
0 info it worked if it ends with ok 1 verbose cli [ 1 verbose cli 'E:\\Program Files\\nodejs\\node.exe', 1 verbose cli 'E:\\Program Files\\nodejs\\node_modules\\npm\\bin\\npm-cli.js', 1 verbose cli 'start' 1 verbose cli ] 2 info using npm@6.9.0 3 info using node@v12.3.1 4 verbose config Skipping project config: C:\Users\Administrator/.npmrc. (matches userconfig) 5 verbose stack Error: ENOENT: no such file or directory, open 'C:\Users\Administrator\package.json' 6 verbose cwd C:\Users\Administrator 7 verbose Windows_NT 6.1.7601 8 verbose argv "E:\\Program Files\\nodejs\\node.exe" "E:\\Program Files\\nodejs\\node_modules\\npm\\bin\\npm-cli.js" "start" 9 verbose node v12.3.1 10 verbose npm v6.9.0 11 error path C:\Users\Administrator\package.json 12 error code ENOENT 13 error errno -4058 14 error syscall open 15 error enoent ENOENT: no such file or directory, open 'C:\Users\Administrator\package.json' 16 error enoent This is related to npm not being able to find a file. 17 verbose exit [ -4058, true ]
is there any way in resolving it?
I'm trying to get this working too, and have some success with @fishbone1 's fork. However, it still isn't fully functional.
I can see content in the 'Elements' tab, and source in the 'Sources' tab, and breakpoints seem to work ok, but there doesn't seem to be anything useful in the 'Scope' panel of the 'Sources' tab. It lists some Closures, but in each of them it says, simply, 'No Variables' (and one says 'No Properties').
At various points, in the output of remotedebug-ios-webkit-adapter, get these messages:
(node:17134) UnhandledPromiseRejectionWarning: TypeError: Cannot read property 'value' of undefined
    at _target.callTarget.then (/home/davidmaxwaterman/z/remotedebug-ios-webkit-adapter/out/protocols/ios/screencast.js:24:38)
    at <anonymous>
    at process._tickCallback (internal/process/next_tick.js:189:7)
(node:17134) UnhandledPromiseRejectionWarning: Unhandled promise rejection. This error originated either by throwing inside of an async function without a catch block, or by rejecting a promise which was not handled with .catch(). (rejection id: 6)
(node:17134) UnhandledPromiseRejectionWarning: TypeError: Cannot read property 'length' of undefined
    at IOS9Protocol.onRuntimeGetProperties (/home/davidmaxwaterman/z/remotedebug-ios-webkit-adapter/out/protocols/ios/ios.js:259:40)
    at IOSProtocol._target.addMessageFilter (/home/davidmaxwaterman/z/remotedebug-ios-webkit-adapter/out/protocols/ios/ios.js:55:86)
    at sequence.then (/home/davidmaxwaterman/z/remotedebug-ios-webkit-adapter/out/protocols/target.js:175:36)
    at <anonymous>
    at process._tickCallback (internal/process/next_tick.js:189:7)
(node:17134) UnhandledPromiseRejectionWarning: Unhandled promise rejection. This error originated either by throwing inside of an async function without a catch block, or by rejecting a promise which was not handled with .catch(). (rejection id: 8)
In chrome dev tools, I also see an error, in the Sources tab:
x Paused on Exceptions
SyntaxError: Can't create duplicate variable: 'VeryLiberalCommentRegex'
I seem to be able to continue execution from that though.
My app's source is TypeScript, and has sourcemaps. I do seem to have some trouble setting breakpoints - for some, it seems to jump to the minimised javascript source.
@davidmaxwaterman The problem is that there are lots of iOS debug protocol changes. The biggest change is that they wrapped all messages. By applying this single change, lots of features work again. However I assume there are more changes (e.g. message type names and parameters). So we need further contribution. Unfortunately I have no time at the moment.
@fishbone1 It would be wonderful if you could open a PR with your improvements for iOS 12/13. Much appreciated.
Because there are several PRs that are pending with failing builds. I created a minimal PR to fix the issue with the upgraded Node container by upgrading Gulp: #157
@fishbone1 Thank you! It works well, such as Elements / Network / Source, but Console not work. When I execute alert('something') or window, nothing happend.
@fishbone1 - love it! Thanks a lot 🚀
Dealing with the same on macOS Mojave. Oddly I can't even inspect via safari. Will try the forks this week most likely, if those don't work I'll try doing some debugging as well.
I finally got this to work on Mojave 10.14.5 with an iPhone 6s running iOS 12.4. Everything seems to be working like normal Chrome DevTools works (well, the way chrome://inspect DevTools works, anyway). Even interactive console commands like alert("hi") are working. To do this, I had to:
- Incorporate PR 149 (the iOS 12.2+ update)
- Incorporate PR 157 (for gulp 4)
- Update my system version of node.js to 12.9.0
- Install
typescript@3.5.3 - Install
typemoq@2.1.0 anyaway two remaining TypeScript errors by changingtest/protocols/target.tsas follows:- Around line 29, replace
let loggerMock: Mock<LoggerMock>;
with
let loggerMock: any; - Around line 61, replace
loggerMock = Mock.ofType(new LoggerMock(), MockBehavior.Loose);
with
loggerMock = Mock.ofType((new LoggerMock() as any), MockBehavior.Loose);
- Around line 29, replace
After all that, I can finally debug the app on my iPhone with Chrome DevTools, so my console messages can have timestamps. What an ordeal. 😄
@chorpler - what about logging objects? In my inspector they are listed as string - I cannot interact like expand wanted arrays etc. Good job!
Yep, you are correct, it turns out that part is still broken. So frustrating.
@fishbone1 many thanks for your work in fixing the "Unhandled promise rejection" errors. Do you think your PR will be integrated in to the trunk soon or would you recommend I implement your branch to get at least some data in the inspector?
@fishbone1 I tried your code and it didn't work.
I put it in my npm folder under remotedebug-ios-webkit-adapter folder, and run it on port 9000.
Did I miss something?
@tofik309 We have the same UnhandledPromiseRejectionWarning errors.
You said problem was fix by running it with npm start but what does it mean, please?
@aiacciu87 Open your cmd or powershell, navigate the folder to remotedebug-ios-webkit-adapter and run the command "npm start"
For those who have no idea what they're doing, like myself, here's what I did that worked.
- Follow Step 1 from the readme
- Instead of following Step 2 from the readme, download the code from https://github.com/fishbone1/remotedebug-ios-webkit-adapter
- Make sure you are using node 11 (I used 11.15.0) instead of 12 or the next step will fail.
- Run
npm installandnpm startin your downloadedremotedebug-ios-webkit-adapterdirectory - Continue onto Step 3 from the readme
Here are some more comprehensive instructions for Windows in particular:
- Get files from https://github.com/fishbone1/remotedebug-ios-webkit-adapter
- Install iTunes (https://www.microsoft.com/en-us/p/itunes/9pb2mz1zmb1s)
- Install scoop (https://scoop.sh)
scoop install nodejs nvmscoop bucket add extrasscoop install ios-webkit-debug-proxynvm install 11.15.0(version 12 doesn't work for the final couple of steps)nvm use 11.15.0(might have to reopen PowerShell after this, it'll tell you)npm install -g vs-libimobilecdto your download ofremotedebug-ios-webkit-adapternpm installnpm start- Continue onto Step 3 from the readme
Also worth noting that chrome://inspect doesn't scan port 9000 by-default so you need to add localhost:9000 using the Configure button.
Use following commands and install node v11.15.0 will solve ReferenceError: primordials is not defined in node:
yarn global add n
#or
#npm install -g n

sudo n 11.15.0

n run 11.15.0 yarn install
n run 11.15.0 yarn start
``
Hello,
I'm on ubuntu linux and getting these errors, any hints?
`
npm start
remotedebug-ios-webkit-adapter@0.3.2 start /home/marco/Downloads/remotedebug-ios-webkit-adapter
gulp build && node out/index.js
[12:47:15] Using gulpfile ~/Downloads/remotedebug-ios-webkit-adapter/gulpfile.js
[12:47:15] Starting 'build'...
/home/marco/Downloads/remotedebug-ios-webkit-adapter/node_modules/@types/express-serve-static-core/index.d.ts(40,50): error TS1005: ',' expected.
/home/marco/Downloads/remotedebug-ios-webkit-adapter/node_modules/@types/express-serve-static-core/index.d.ts(45,50): error TS1005: ',' expected.
/home/marco/Downloads/remotedebug-ios-webkit-adapter/node_modules/@types/express-serve-static-core/index.d.ts(49,51): error TS1005: ',' expected.
/home/marco/Downloads/remotedebug-ios-webkit-adapter/node_modules/@types/express-serve-static-core/index.d.ts(53,23): error TS1005: ',' expected.
/home/marco/Downloads/remotedebug-ios-webkit-adapter/node_modules/@types/express-serve-static-core/index.d.ts(55,23): error TS1005: ',' expected.
/home/marco/Downloads/remotedebug-ios-webkit-adapter/node_modules/@types/express-serve-static-core/index.d.ts(205,43): error TS1005: ',' expected.
/home/marco/Downloads/remotedebug-ios-webkit-adapter/node_modules/@types/express-serve-static-core/index.d.ts(42,11): error TS2314: Generic type 'Request<P, ParamsDictionary>' requires 2 type argument(s).
/home/marco/Downloads/remotedebug-ios-webkit-adapter/node_modules/@types/express-serve-static-core/index.d.ts(45,88): error TS2314: Generic type 'Request<P, ParamsDictionary>' requires 2 type argument(s).
/home/marco/Downloads/remotedebug-ios-webkit-adapter/node_modules/@types/express-serve-static-core/index.d.ts(49,73): error TS2314: Generic type 'RequestHandler<P, ParamsDictionary>' requires 2 type argument(s).
/home/marco/Downloads/remotedebug-ios-webkit-adapter/node_modules/@types/express-serve-static-core/index.d.ts(49,93): error TS2314: Generic type 'ErrorRequestHandler' requires 2 type argument(s).
/home/marco/Downloads/remotedebug-ios-webkit-adapter/node_modules/@types/express-serve-static-core/index.d.ts(49,124): error TS2314: Generic type 'RequestHandler<P, ParamsDictionary>' requires 2 type argument(s).
/home/marco/Downloads/remotedebug-ios-webkit-adapter/node_modules/@types/express-serve-static-core/index.d.ts(49,144): error TS2314: Generic type 'ErrorRequestHandler' requires 2 type argument(s).
/home/marco/Downloads/remotedebug-ios-webkit-adapter/node_modules/@types/express-serve-static-core/index.d.ts(53,80): error TS2314: Generic type 'RequestHandler<P, ParamsDictionary>' requires 2 type argument(s).
/home/marco/Downloads/remotedebug-ios-webkit-adapter/node_modules/@types/express-serve-static-core/index.d.ts(55,80): error TS2314: Generic type 'RequestHandlerParams' requires 2 type argument(s).
/home/marco/Downloads/remotedebug-ios-webkit-adapter/node_modules/@types/express-serve-static-core/index.d.ts(60,19): error TS2314: Generic type 'RequestHandler<P, ParamsDictionary>' requires 2 type argument(s).
/home/marco/Downloads/remotedebug-ios-webkit-adapter/node_modules/@types/express-serve-static-core/index.d.ts(61,19): error TS2314: Generic type 'RequestHandlerParams' requires 2 type argument(s).
/home/marco/Downloads/remotedebug-ios-webkit-adapter/node_modules/@types/express-serve-static-core/index.d.ts(64,34): error TS2314: Generic type 'RequestHandler<P, ParamsDictionary>' requires 2 type argument(s).
/home/marco/Downloads/remotedebug-ios-webkit-adapter/node_modules/@types/express-serve-static-core/index.d.ts(864,11): error TS2314: Generic type 'Request<P, ParamsDictionary>' requires 2 type argument(s).
/home/marco/Downloads/remotedebug-ios-webkit-adapter/node_modules/@types/express-serve-static-core/index.d.ts(867,34): error TS2314: Generic type 'RequestHandler<P, ParamsDictionary>' requires 2 type argument(s).
/home/marco/Downloads/remotedebug-ios-webkit-adapter/node_modules/@types/express-serve-static-core/index.d.ts(869,41): error TS2314: Generic type 'Request<P, ParamsDictionary>' requires 2 type argument(s).
/home/marco/Downloads/remotedebug-ios-webkit-adapter/node_modules/@types/express-serve-static-core/index.d.ts(871,99): error TS2314: Generic type 'RequestHandlerParams' requires 2 type argument(s).
/home/marco/Downloads/remotedebug-ios-webkit-adapter/node_modules/@types/express-serve-static-core/index.d.ts(878,11): error TS2314: Generic type 'Request<P, ParamsDictionary>' requires 2 type argument(s).
/home/marco/Downloads/remotedebug-ios-webkit-adapter/node_modules/@types/express-serve-static-core/index.d.ts(1073,14): error TS2314: Generic type 'Request<P, ParamsDictionary>' requires 2 type argument(s).
/home/marco/Downloads/remotedebug-ios-webkit-adapter/node_modules/@types/express/index.d.ts(89,43): error TS2314: Generic type 'ErrorRequestHandler' requires 2 type argument(s).
/home/marco/Downloads/remotedebug-ios-webkit-adapter/node_modules/@types/express/index.d.ts(98,31): error TS2314: Generic type 'Request<P, ParamsDictionary>' requires 2 type argument(s).
/home/marco/Downloads/remotedebug-ios-webkit-adapter/node_modules/@types/express/index.d.ts(99,38): error TS2314: Generic type 'RequestHandler<P, ParamsDictionary>' requires 2 type argument(s).
`
@RyanEwen dang I followed your instructions and it still isn't working for me. Any ideas? I am using Linux 19.04, using an iPhone XS Max on iOS 12.4.1

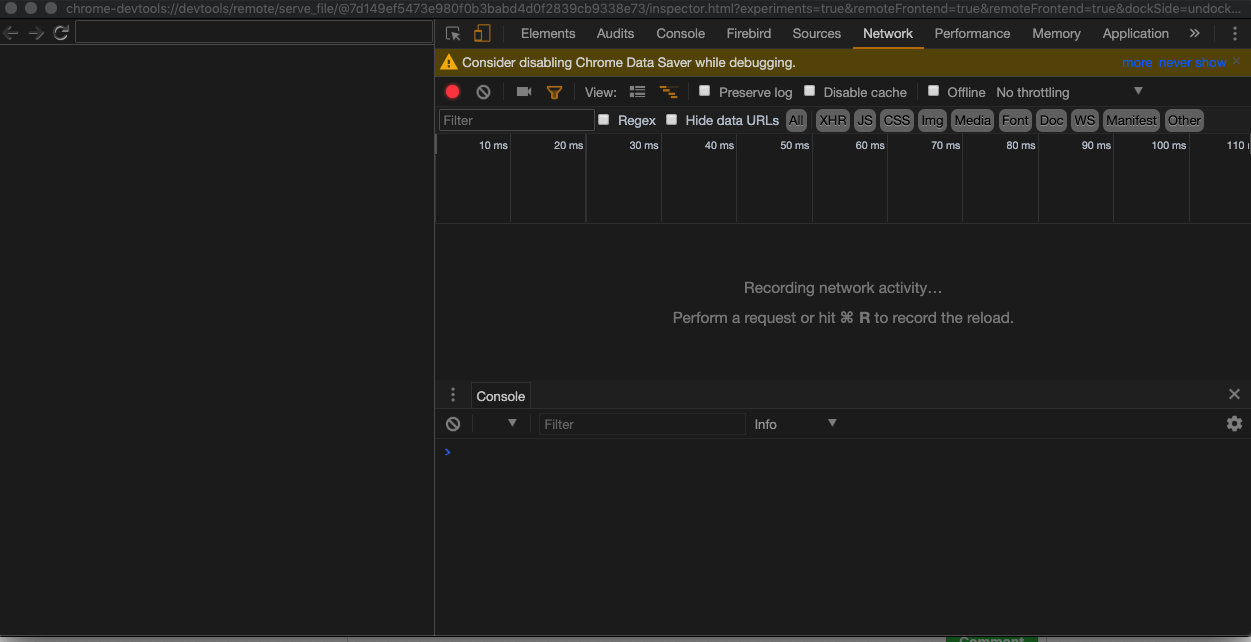
@mtjn
I got such view when there where no Safari sessions open on my device
I am not iOS 13.1 and it is not working.
@RyanEwen's procedure worked for me for Windows 10, iPhone SE with iOS 12.3.1 👍 , even if when starting the adapter with npm start, I got errors very similar to what @marc0n3 observed. After the errors I can see the "usual log":
error.iosAdapter.getTargets.getDeviceVersion.failed.fallback, device=[object Object]
iosAdapter.getTargets
error.iosAdapter.getTargets.getDeviceVersion.failed.fallback, device=[object Object]
iosAdapter.getTargets
// etc.
@marc0n3 I have the same problem on Ubuntu. Were you able to find a fix for this?
Thanks to @petewalker for his PR for this that works across iOS 11 - iOS 13.
I've published a prerelease of 0.4.0 for people to test. It can be obtained via npm i -g remotedebug-ios-webkit-adapter@next. I'll switch that over to be the "latest" version in a week or so dependent on feedback
No joy with a 13.3 device on Kubuntu (18.04) which shows a 9.3.5 device. (Also Windows is still SOL regardless.)
Tested @0.4.0 and @next.
I am able to connect my iPhone XR on Windows10 and the browser tab shows in Chrome Debug tools but once I click on inspect button everything is white and no source code is shown.
(node:11628) UnhandledPromiseRejectionWarning: #<Object>
(node:11628) UnhandledPromiseRejectionWarning: Unhandled promise rejection. This error originated either by throwing inside of an async function without a catch block, or by rejecting a promise which was not handled with .catch(). (rejection id: 5)
Here's my setup:
Node v12.13.1
Chrome v79.0.3945.88
iOS 12.4
Was really excited when I just found out about this project, but alas it does not work on my 13.5.1 phone as mentioned by everyone else. Is it something missing from upstream?
UPDATE
I recently used and can confirm this now works for me
Here's my recent setup:
Node: 12.14.1
iOS: 13.5.1 (iPhone XR)
OS: Windows 10 Home (Version: 2004 Build: 19041.329)
Same problem here. I only see 3 service workers, but not the currently open tab in Safari. Why is this issue Closed? I wasted over an hour installing all the dependencies, only to find out now that it's not working?
works for me, YET I cannot inspect any objects due to repeating
(node:2939) UnhandledPromiseRejectionWarning: TypeError: Cannot read property 'length' of undefined
    at IOS12Protocol.onRuntimeGetProperties (/Users/szymon/.nvm/versions/node/v12.16.1/lib/node_modules/remotedebug-ios-webkit-adapter/out/protocols/ios/ios.js:259:47)
    at IOSProtocol._target.addMessageFilter (/Users/szymon/.nvm/versions/node/v12.16.1/lib/node_modules/remotedebug-ios-webkit-adapter/out/protocols/ios/ios.js:55:86)
    at sequence.then (/Users/szymon/.nvm/versions/node/v12.16.1/lib/node_modules/remotedebug-ios-webkit-adapter/out/protocols/target.js:162:36)
    at processTicksAndRejections (internal/process/task_queues.js:86:5)
(node:2939) UnhandledPromiseRejectionWarning: Unhandled promise rejection. This error originated either by throwing inside of an async function without a catch block, or by rejecting a promise which was not handled with .catch(). (rejection id: 1)
remotedebug-ios-webkit-adapter/src/protocols/ios/ios.ts line 340 change to the following:
    private onRuntimeGetProperties(msg: any): Promise<any> {
        const newPropertyDescriptors = [];
        if (msg.result.result) {
            for (let i = 0; i < msg.result.result.length; i++) {
                if (msg.result.result[i].isOwn || msg.result.result[i].nativeGetter) {
                    msg.result.result[i].isOwn = true;
                    newPropertyDescriptors.push(msg.result.result[i]);
                }
            }
            msg.result.result = null;
        } else { // iOS13+ msg.result.result rename msg.result.properties
            for (let i = 0; i < msg.result.properties.length; i++) {
                if (msg.result.properties[i].isOwn || msg.result.properties[i].nativeGetter) {
                    msg.result.properties[i].isOwn = true;
                    newPropertyDescriptors.push(msg.result.properties[i]);
                }
            }
            msg.result.properties = null;
        }
        msg.result.result = newPropertyDescriptors;
        return Promise.resolve(msg);
    }
Run start command again in the root directory, the error will disappear and the properties will shown on Chrome Devtools.
npm run start