VaspBandUnfolding consists of a collection of python scripts that deal with VASP output files.
-
vaspwfc.pycan be used to read the plane-wave coefficients in theWAVECARfile and then generate real-space representation of the pseudo-wavefunction by Fourier transform. Other wavefunction related quantites, e.g. transition dipole moment (pseudo-wavefunction part), inverse participation ratio and electron localization function et al. can also be conveniently obtained.Moreover, a command line tool named
wfcplotin thebindirectory can be used to output real-space pseudo-wavefunctions. -
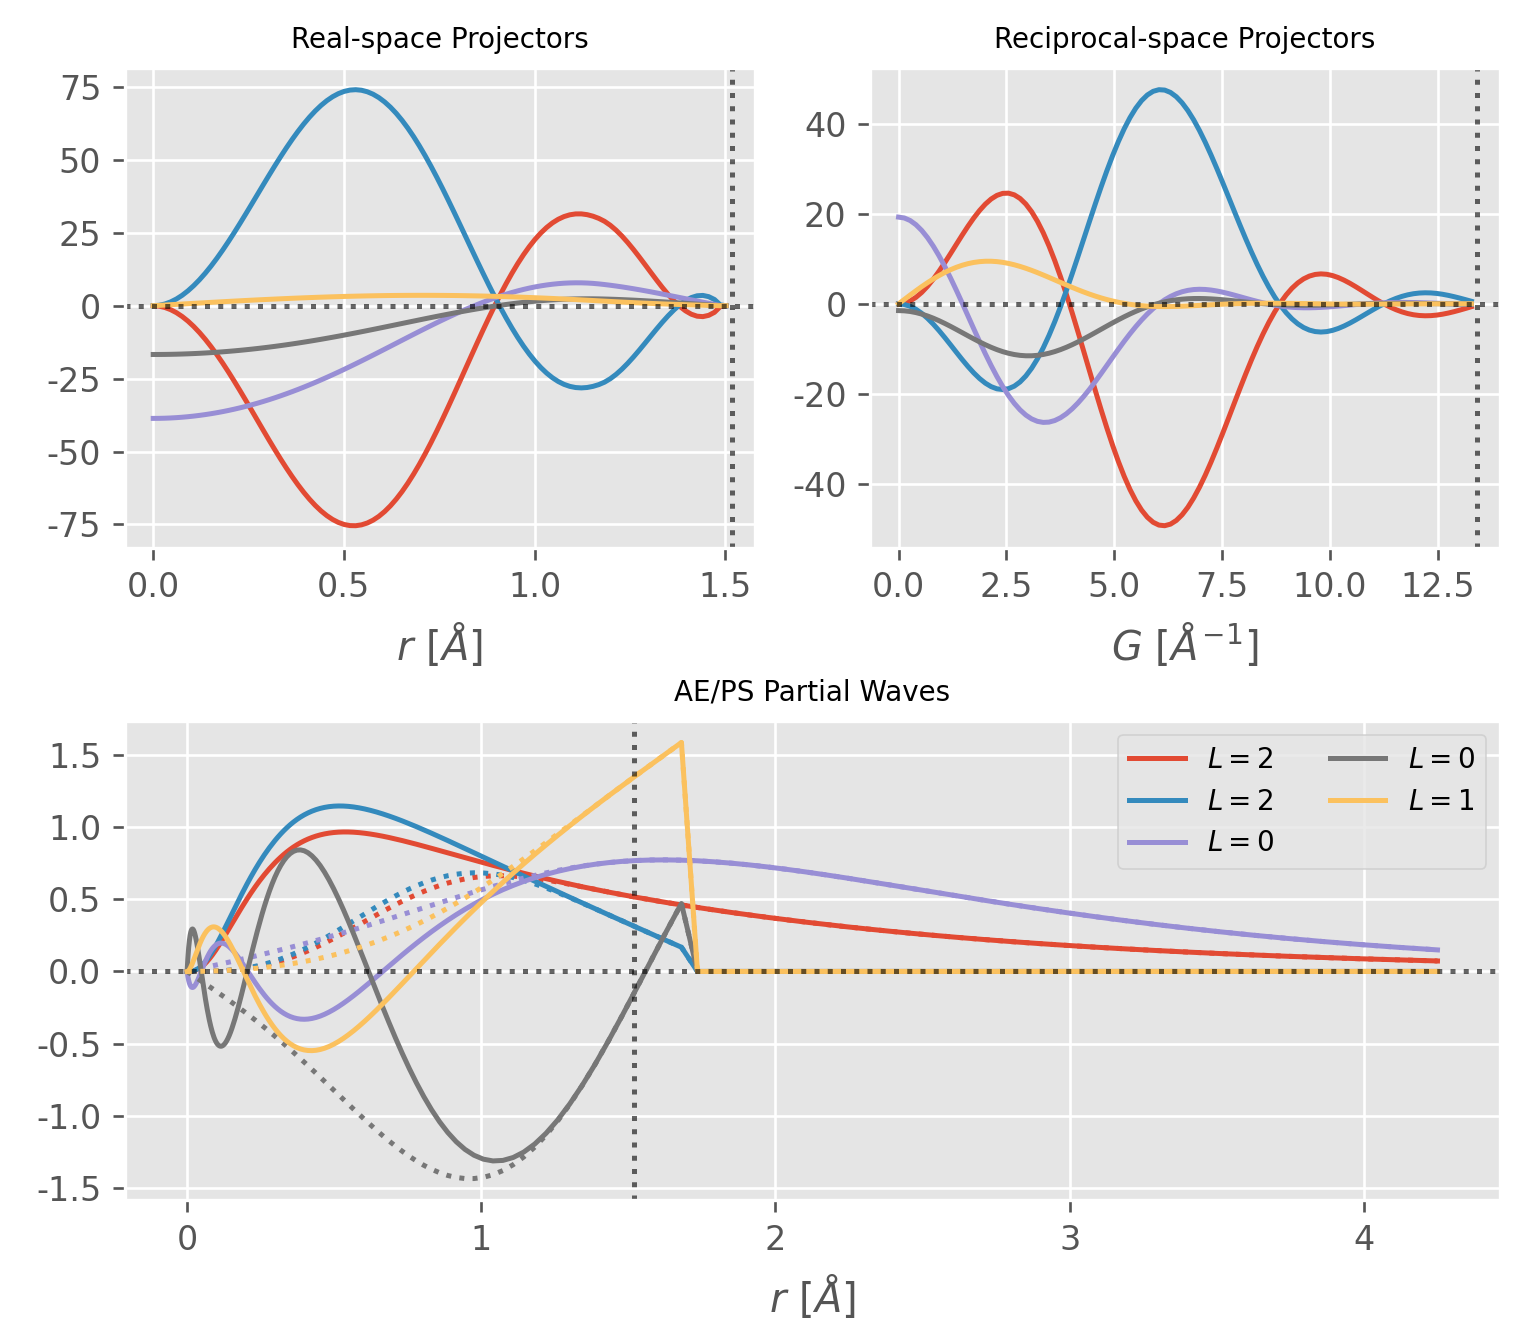
paw.pycan be used to parse the PAWPOTCARfile. A command line tool namedpotplotin thebindirectory can be used to visualize the projector function and partial waves contained in thePOTCAR. -
aewfc.pycan be used to generate all-electron (AE) wavefunction. -
unfold.pycan be used to perform band unfolding from supercell calculations.
-
Requirements
- Numpy
- Scipy
- Matplotlib
- ASE
- pySBT for spherical Bessel transform
-
Manual Installation
git clone https://github.com/QijingZheng/VaspBandUnfolding
# set the
cd VaspBandUnfolding
python setup.py install --prefix=/the/path/of/your/dir/
export PYTHONPATH=/the/path/of/your/dir:${PYTHONPATH}
-
Using Pip
pip install git+https://github.com/QijingZheng/VaspBandUnfolding
-
Pseudo-wavefunction.
As is well known,
VASPWAVECARis a binary file and contains the plane-wave coefficients for the pseudo-wavefunctions. The pseudo-wavefunction in real space can be obtained by 3D Fourier transform on the plane-wave coefficients and represented on a 3D uniform grid which can be subsequently visualized with software such asVESTA.-
For a normal
WAVECAR, i.e. not gamma-only or non-collinearWAVECAR, one can write a small python script and convert the desired Kohn-Sham states to real space.#/usr/bin/env python from vaspwfc import vaspwfc pswfc = vaspwfc('./examples/wfc_r/WAVECAR') # KS orbital in real space, double the size of the FT grid phi = pswfc.get_ps_wfc(ikpt=2, iband=27, ngrid=pswfc._ngrid * 2) # Save the orbital into files. Since the wavefunction consist of complex # numbers, the real and imaginary part are saved separately. pswfc.save2vesta(phi, poscar='./examples/wfc_r/POSCAR')
- In the above script,
pswfc._ngridis the default 3D grid size andphiis a numpy 3D array of size2*pswfc._ngrid, with the first dimensiton being x and the last "z". - The spin, k-point and band index for the KS state are designated by the argumnt
ispin,ikptandiband, respectively, all of which start from1. - Generally, the pseudo-wavefunction is complex,
pswfc.save2vestawill export both the real and imaginary part of the wavefunction, with the file name "wfc_r.vasp" and "wfc_i.vasp", respectively.
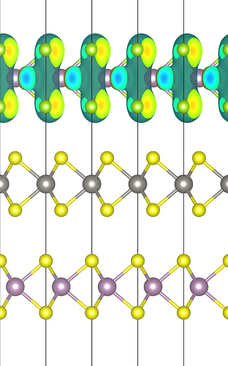
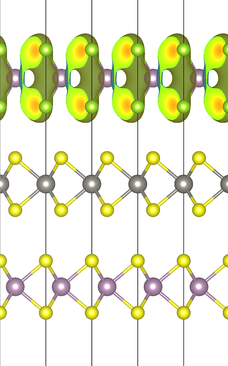
Below are the real (left) and imaginary (right) part of the selected KS orbital:
- In the above script,
-
For gamma-only
WAVECAR, one must pass the argumentlgamma=Truewhen readingWAVECARin thevaspwfcmethod. Moreover, asVASPonly stores half of the full plane-wave coefficients for gamma-only WAVECAR andVASPchanges the idea about which half to save from version 5.2 to 5.4. An addition argument must be passed.#/usr/bin/env python from vaspwfc import vaspwfc # For VASP <= 5.2.x, check # which FFT VASP uses by the following command: # # $ grep 'use.* FFT for wave' OUTCAR # # Then # # # for parallel FFT, VASP <= 5.2.x # pswfc = vaspwfc('WAVECAR', lgamma=True, gamma_half='z') # # # for serial FFT, VASP <= 5.2.x # pswfc = vaspwfc('WAVECAR', lgamma=True, gamma_half='x') # # For VASP >= 5.4, WAVECAR is written with x-direction half grid regardless of # parallel or serial FFT. # # # "gamma_half" default to "x" for VASP >= 5.4 # pswfc = vaspwfc('WAVECAR', lgamma=True, gamma_half='x') pswfc = vaspwfc('WAVECAR', lgamma=True, gamma_half='x')
-
For non-collinear
WAVECAR, however, one must pass the argumentlsorbit=Truewhen readingWAVECAR. Note that in the non-collinear case, the wavefunction now is a two-component spinor.#/usr/bin/env python from vaspwfc import vaspwfc # for WAVECAR from a noncollinear run, the wavefunction at each k-piont/band is # a two component spinor. Turn on the lsorbit flag when reading WAVECAr. pswfc = vaspwfc('examples/wfc_r/wavecar_mose2-wse2', lsorbit=True) phi_spinor = pswfc.get_ps_wfc(1, 1, 36, ngrid=pswfc._ngrid*2) for ii in range(2): phi = phi_spinor[ii] prefix = 'spinor_{:02d}'.format(ii) pswfc.save2vesta(phi, prefix=prefix, poscar='examples/wfc_r/poscar_mose2-wse2')
-
If only real-space representation of the pseudo-wavefunction is needed, a helping script
wfcplotin thebindirectory comes to rescue.$ wfcplot -w WAVECAR -p POSCAR -s spin_index -k kpoint_index -n band_index # for normal WAVECAR $ wfcplot -w WAVECAR -p POSCAR -s spin_index -k kpoint_index -n band_index -lgamma # for gamma-only WAVECAR $ wfcplot -w WAVECAR -p POSCAR -s spin_index -k kpoint_index -n band_index -lsorbit # for noncollinear WAVECAR
Please refer to
wfcplot -hfor more information of the usage.
-
-
All-electron wavefunction in real space
Refer to this post for detail formulation.
#/usr/bin/env python

from vaspwfc import vaspwfc
from aewfc import vasp_ae_wfc

# the pseudo-wavefunction
ps_wfc = vaspwfc('WAVECAR', lgamma=True)
# the all-electron wavefunction
# here 25x Encut, or 5x grid size is used
ae_wfc = vasp_ae_wfc(ps_wfc, aecut=-25)

phi_ae = ae_wfc.get_ae_wfc(iband=8)
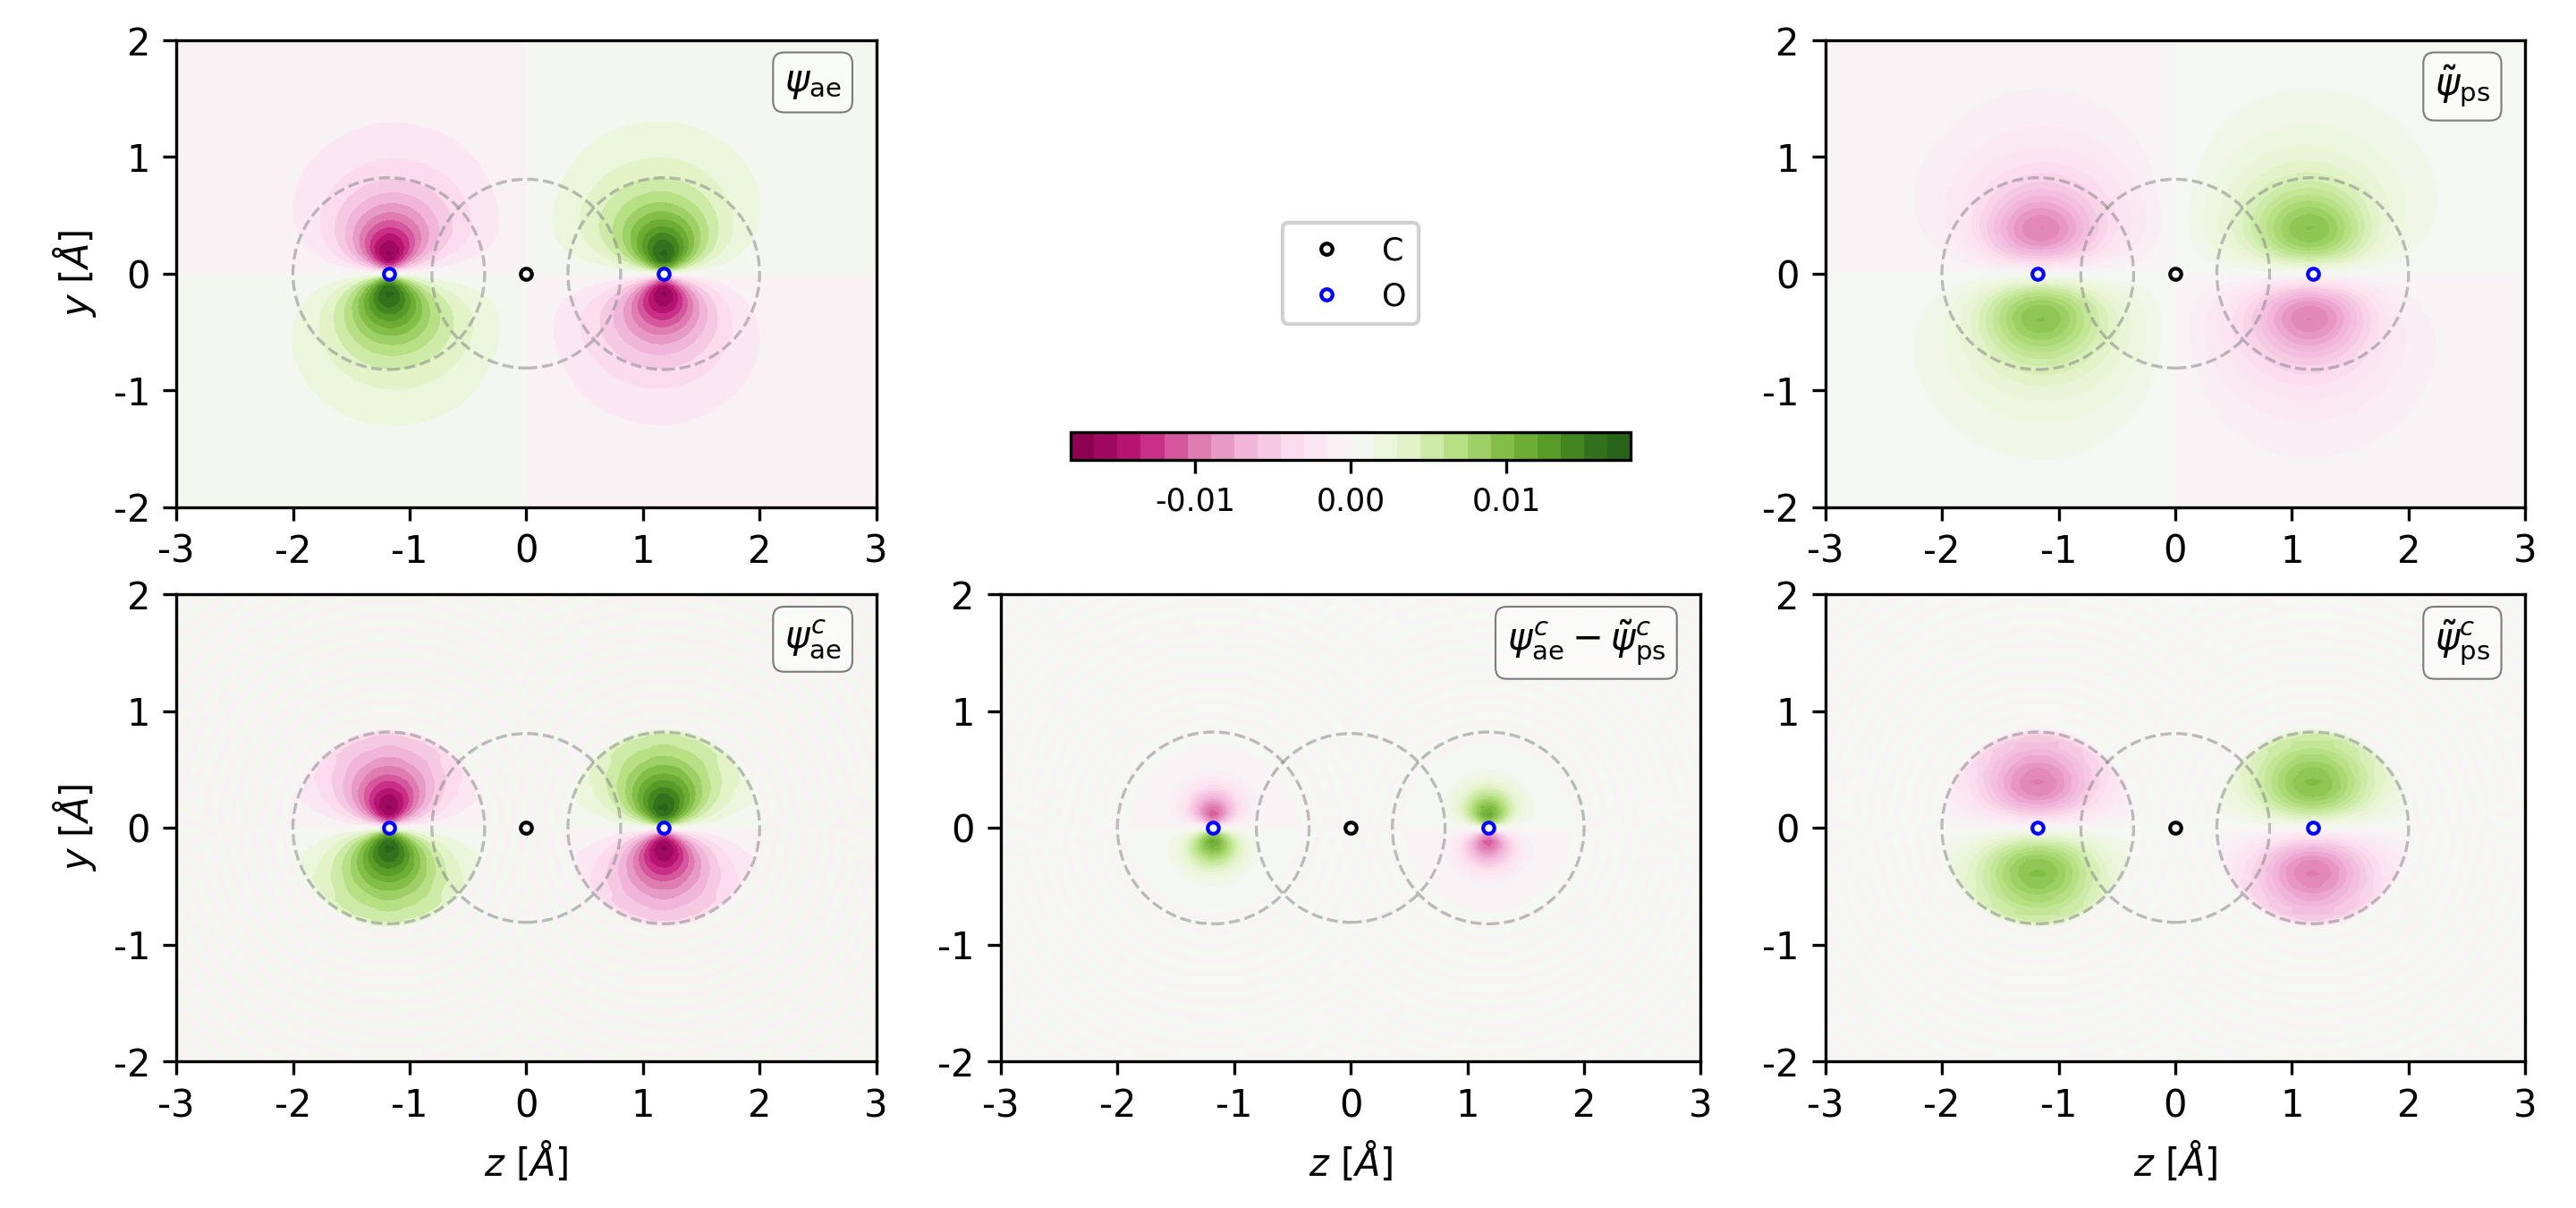
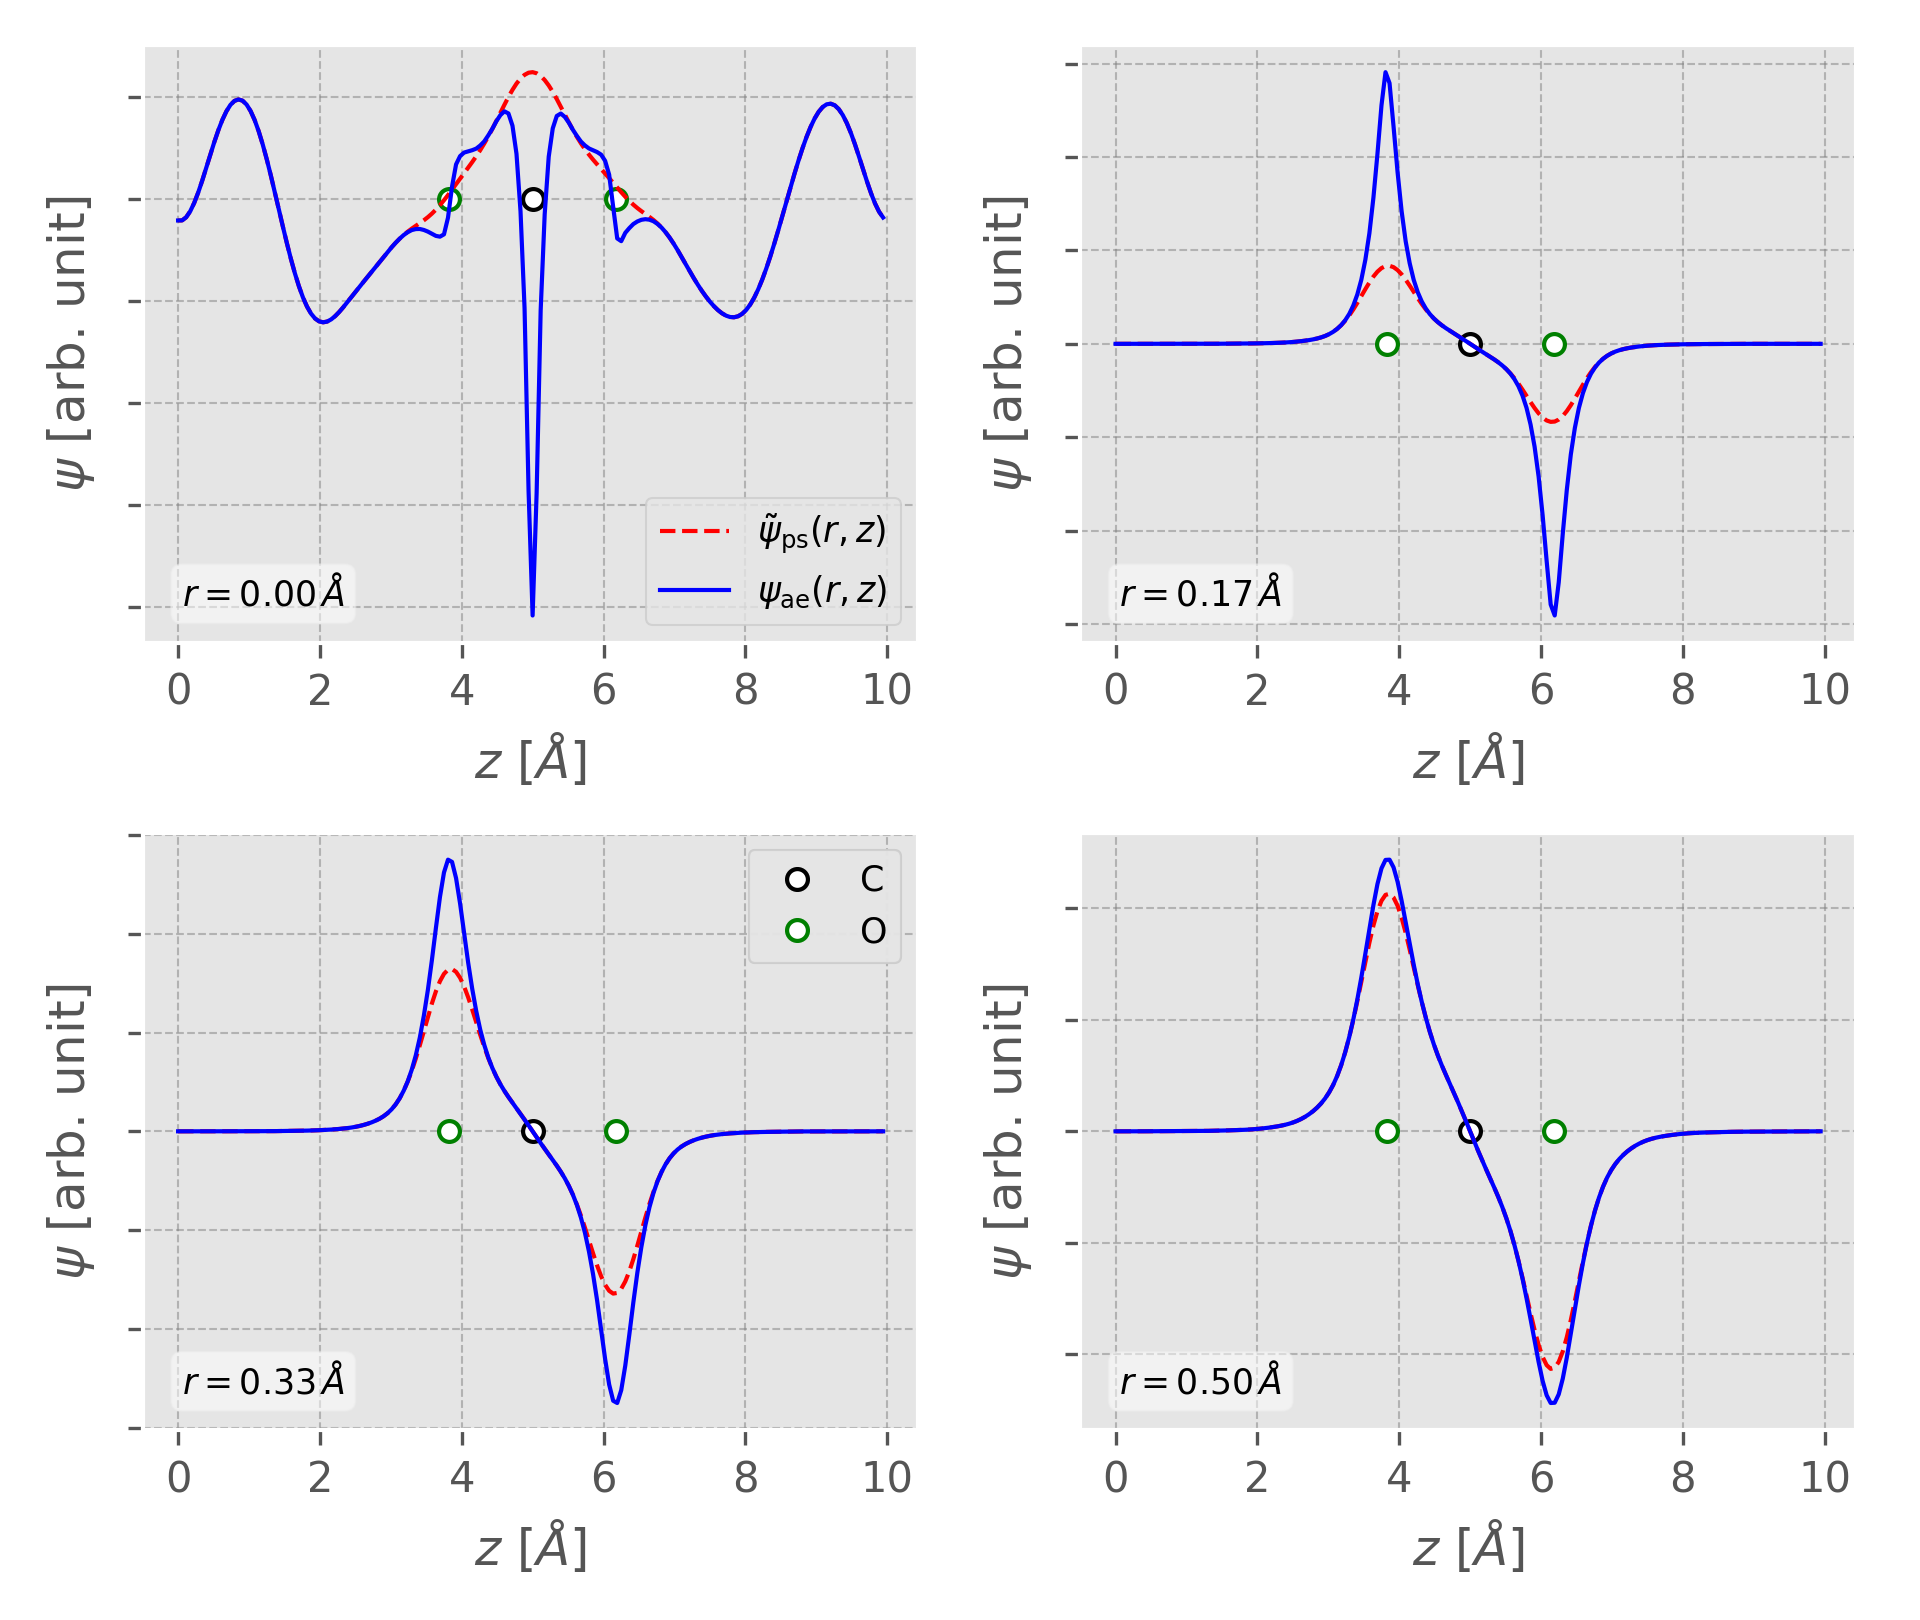
The comparison of All-electron and pseudo wavefunction of CO2 HOMO can be found in examples/aewfc/co2.
-
Dipole transition matrix
Refer to this post for detail formulation.
Under the electric-dipole approximation (EDA), The dipole transition matrix elements in the length gauge is given by:
<psi_nk | e r | psi_mk>where | psi_nk > is the pseudo-wavefunction. In periodic systems, the position operator "r" is not well-defined. Therefore, we first evaluate the momentum operator matrix in the velocity gauge, i.e.
<psi_nk | p | psi_mk>And then use simple "p-r" relation to apprimate the dipole transition matrix element
                                  -i⋅h
    <psi_nk | r | psi_mk> =  -------------- ⋅ <psi_nk | p | psi_mk>
                               m⋅(En - Em)
Apparently, the above equaiton is not valid for the case Em == En. In this case, we just set the dipole matrix element to be 0.
NOTE that, the simple "p-r" relation only applies to molecular or finite system, and there might be problem in directly using it for periodic system. Please refer to this paper for more details.
Relation between the interband dipole and momentum matrix elements in semiconductors
The momentum operator matrix in the velocity gauge
<psi_nk | p | psi_mk> = hbar <u_nk | k - i nabla | u_mk>In PAW, the matrix element can be divided into plane-wave parts and one-center parts, i.e.
    <u_nk | k - i nabla | u_mk> = <tilde_u_nk | k - i nabla | tilde_u_mk>
                                 - \sum_ij <tilde_u_nk | p_i><p_j | tilde_u_mk>
                                   \times i [
                                     <phi_i | nabla | phi_j>
                                     -
                                     <tilde_phi_i | nabla | tilde_phi_j>
                                   ]
where | u_nk > and | tilde_u_nk > are cell-periodic part of the AE/PS wavefunctions, | p_j > is the PAW projector function and | phi_j > and | tilde_phi_j > are PAW AE/PS partial waves.
The nabla operator matrix elements between the pseudo-wavefuncitons
    <tilde_u_nk | k - i nabla | tilde_u_mk>

   = \sum_G C_nk(G).conj() * C_mk(G) * [k + G]
where C_nk(G) is the plane-wave coefficients for | u_nk >.
import numpy as np

from vaspwfc import vaspwfc
from aewfc import vasp_ae_wfc

# the pseudo-wavefunction
ps_wfc = vaspwfc('WAVECAR', lgamma=True)
# the all-electron wavefunction
ae_wfc = vasp_ae_wfc(ps_wfc)

# (ispin, ikpt, iband) for initial and final states
ps_dp_mat = ps_wfc.get_dipole_mat((1,1,1), (1, 1, 9))
ae_dp_mat = ae_wfc.get_dipole_mat((1,1,1), (1, 1, 9))
-
Inverse Participation Ratio
IPR is a measure of the localization of Kohn-Sham states. For a particular KS state \phi_j, it is defined as
                \sum_n |\phi_j(n)|^4
IPR(\phi_j) = -------------------------
              |\sum_n |\phi_j(n)|^2||^2
where n iters over the number of grid points.
-
Electron Localization Function (Still need to be tested!)
In quantum chemistry, the electron localization function (ELF) is a measure of the likelihood of finding an electron in the neighborhood space of a reference electron located at a given point and with the same spin. Physically, this measures the extent of spatial localization of the reference electron and provides a method for the mapping of electron pair probability in multielectronic systems. (from wiki)
- Nature, 371, 683-686 (1994)
- Becke and Edgecombe, J. Chem. Phys., 92, 5397(1990)
- M. Kohout and A. Savin, Int. J. Quantum Chem., 60, 875-882(1996)
- http://www2.cpfs.mpg.de/ELF/index.php?content=06interpr.txt
NOTE that if you are using VESTA to view the resulting ELF file, please rename the output file as "ELFCAR", otherwise there will be some error in the isosurface plot! When VESTA read in CHG*/PARCHG/*.vasp to visualize isosurfaces and sections, data values are divided by volume in the unit of bohr^3. The unit of charge densities input by VESTA is, therefore, bohr^−3. For LOCPOT/ELFCAR files, volume data are kept intact.
#/usr/bin/env python
import numpy as np
from vaspwfc import vaspwfc, save2vesta

kptw = [1, 6, 6, 6, 6, 6, 6, 12, 12, 12, 6, 6, 12, 12, 6, 6]

pswfc = vaspwfc('./WAVECAR')
# chi = wfc.elf(kptw=kptw, ngrid=wfc._ngrid * 2)
chi = pswfc.elf(kptw=kptw, ngrid=[20, 20, 150])
save2vesta(chi[0], lreal=True, poscar='POSCAR', prefix='elf')
Remember to rename the output file "elf_r.vasp" as "ELFCAR"!
The paw.py contains method to parse the PAW POTCAR (pawpotcar class) can
calculate relating quantities in the PAW within augment sphere. For example,
from paw import pawpotcar

pp = pawpotcar(potfile='POTCAR')

# Q_{ij} = < \phi_i^{AE} | \phi_j^{AE} > -
#          < \phi_i^{PS} | \phi_j^{PS} >
Qij = pp.get_Qij()
# nabla_{ij} = < \phi_i^{AE} | nabla_r | \phi_j^{AE} > -
#              < \phi_i^{PS} | nabla_r | \phi_j^{PS} >
Nij = pp.get_nablaij()
A helping script utilizing the paw.py in the bin directory can be used to
visulize the projector function and partial waves.
# `Ti` POTCAR for exampleTCAR for example
potplot -p POTCAR
As the name suggests, paw.py also contains the methods (nonlq and nonlr
class) to calculate the inner products of the projector function and the
pseudo-wavefunction. The related formula can be found in my
post.
Using the pseudo-wavefunction from supercell calculation, it is possible to perform electronic band structure unfolding to obtain the effective band structure. For more information, please refer to the following article and the GPAW website.
V. Popescu and A. Zunger Extracting E versus k effective band structure from supercell calculations on alloys and impurities Phys. Rev. B 85, 085201 (2012)
Theoretical background with an example can be found in my post:
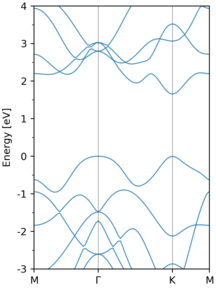
Here, we use MoS2 as an example to illustrate the procedures of band
unfolding. Below is the band structure of MoS2 using a primitive cell. The
calculation was performed with VASP and the input files can be found in the
examples/unfold/primitive
-
Create the supercell from the primitive cell, in my case, the supercell is of the size 3x3x1, which means that the transformation matrix between supercell and primitive cell is
 # The tranformation matrix between supercell and primitive cell.
 M = [[3.0, 0.0, 0.0],
      [0.0, 3.0, 0.0],
      [0.0, 0.0, 1.0]]
-
In the second step, generate band path in the primitive Brillouin Zone (PBZ) and find the correspondig K points of the supercell BZ (SBZ) onto which they fold.
from unfold import make_kpath, removeDuplicateKpoints, find_K_from_k

# high-symmetry point of a Hexagonal BZ in fractional coordinate
kpts = [[0.0, 0.5, 0.0],            # M
        [0.0, 0.0, 0.0],            # G
        [1./3, 1./3, 0.0],          # K
        [0.0, 0.5, 0.0]]            # M
# create band path from the high-symmetry points, 30 points inbetween each pair
# of high-symmetry points
kpath = make_kpath(kpts, nseg=30)
K_in_sup = []
for kk in kpath:
    kg, g = find_K_from_k(kk, M)
    K_in_sup.append(kg)
# remove the duplicate K-points
reducedK, kid = removeDuplicateKpoints(K_in_sup, return_map=True)

# save to VASP KPOINTS
save2VaspKPOINTS(reducedK)
-
Do one non-SCF calculation of the supercell using the folded K-points and obtain the corresponding pseudo-wavefunction. The input files are in
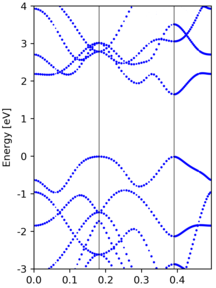
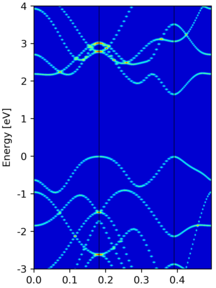
examples/unfold/sup_3x3x1/. The effective band structure (EBS) and then be obtained by processing the WAVECAR file.from unfold import unfold # basis vector of the primitive cell cell = [[ 3.1850, 0.0000000000000000, 0.0], [-1.5925, 2.7582909110534373, 0.0], [ 0.0000, 0.0000000000000000, 35.0]] WaveSuper = unfold(M=M, wavecar='WAVECAR') from unfold import EBS_scatter sw = WaveSuper.spectral_weight(kpath) # show the effective band structure with scatter EBS_scatter(kpath, cell, sw, nseg=30, eref=-4.01, ylim=(-3, 4), factor=5) from unfold import EBS_cmaps e0, sf = WaveSuper.spectral_function(nedos=4000) # or show the effective band structure with colormap EBS_cmaps(kpath, cell, e0, sf, nseg=30, eref=-4.01, show=False, ylim=(-3, 4))
The EBS from a 3x3x1 supercell calculation are shown below:
Another example of EBS from a 3x3x1 supercell calculation, where we introduce a
Svacancy in the structure.Yet another band unfolding example from a tetragonal 3x3x1 supercell calculation, where the transformation matrix is
 M = [[3.0, 0.0, 0.0],
      [3.0, 6.0, 0.0],
      [0.0, 0.0, 1.0]]
Compared to the band structure of the primitive cell, there are some empty states at the top of figure. This is due to a too small value of
NBANDSin supercell non-scf calculation, and thus those states are not included.
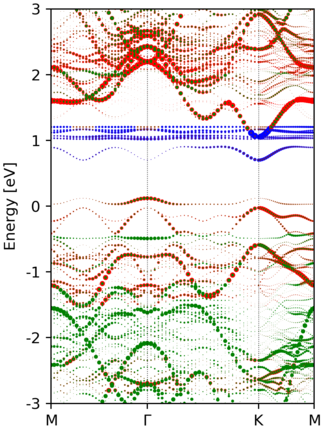
After band unfolding, we can also superimpose the atomic contribution of each KS
states on the spectral weight. Below is the resulting unfolded band structure of
Ce-doped bilayer-MoS2. Refer to
./examples/unfold/Ce@BL-MoS2_3x3x1/plt_unf.py for the entire code.
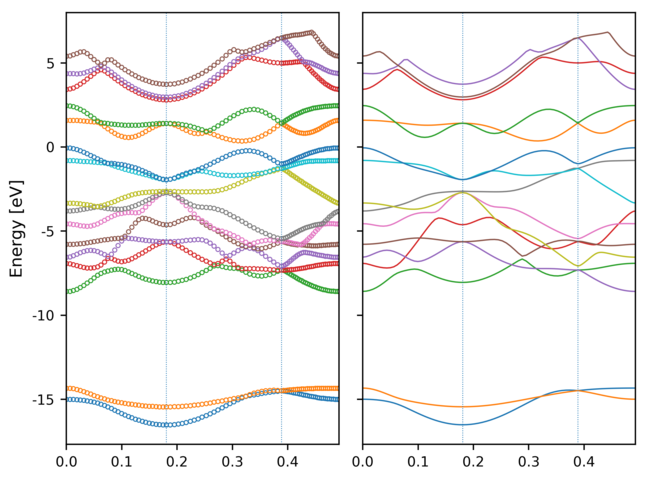
Band re-ordering is possible by maximizing the overlap between nerghbouring k-points. The overlap is defined as the inner product of the periodic part of the Bloch wavefunctions.
`< u(n, k) | u(m, k-1) >`
Note, however, the WAVECAR only contains the pseudo-wavefunction, and thus the
pseudo u(n,k) are used in this function. Moreover, since the number of
planewaves for each k-points are different, the inner product is performed in
real space.
The overlap maximalization procedure is as follows:
- Pick out those bands with large overlap (> olap_cut).
- Assign those un-picked bands by maximizing the overlap.
An example band structure re-ordering is performed in MoS2. The result is shown in the following image, where the left/right panel shows the un-ordered/re-ordered band structure.
