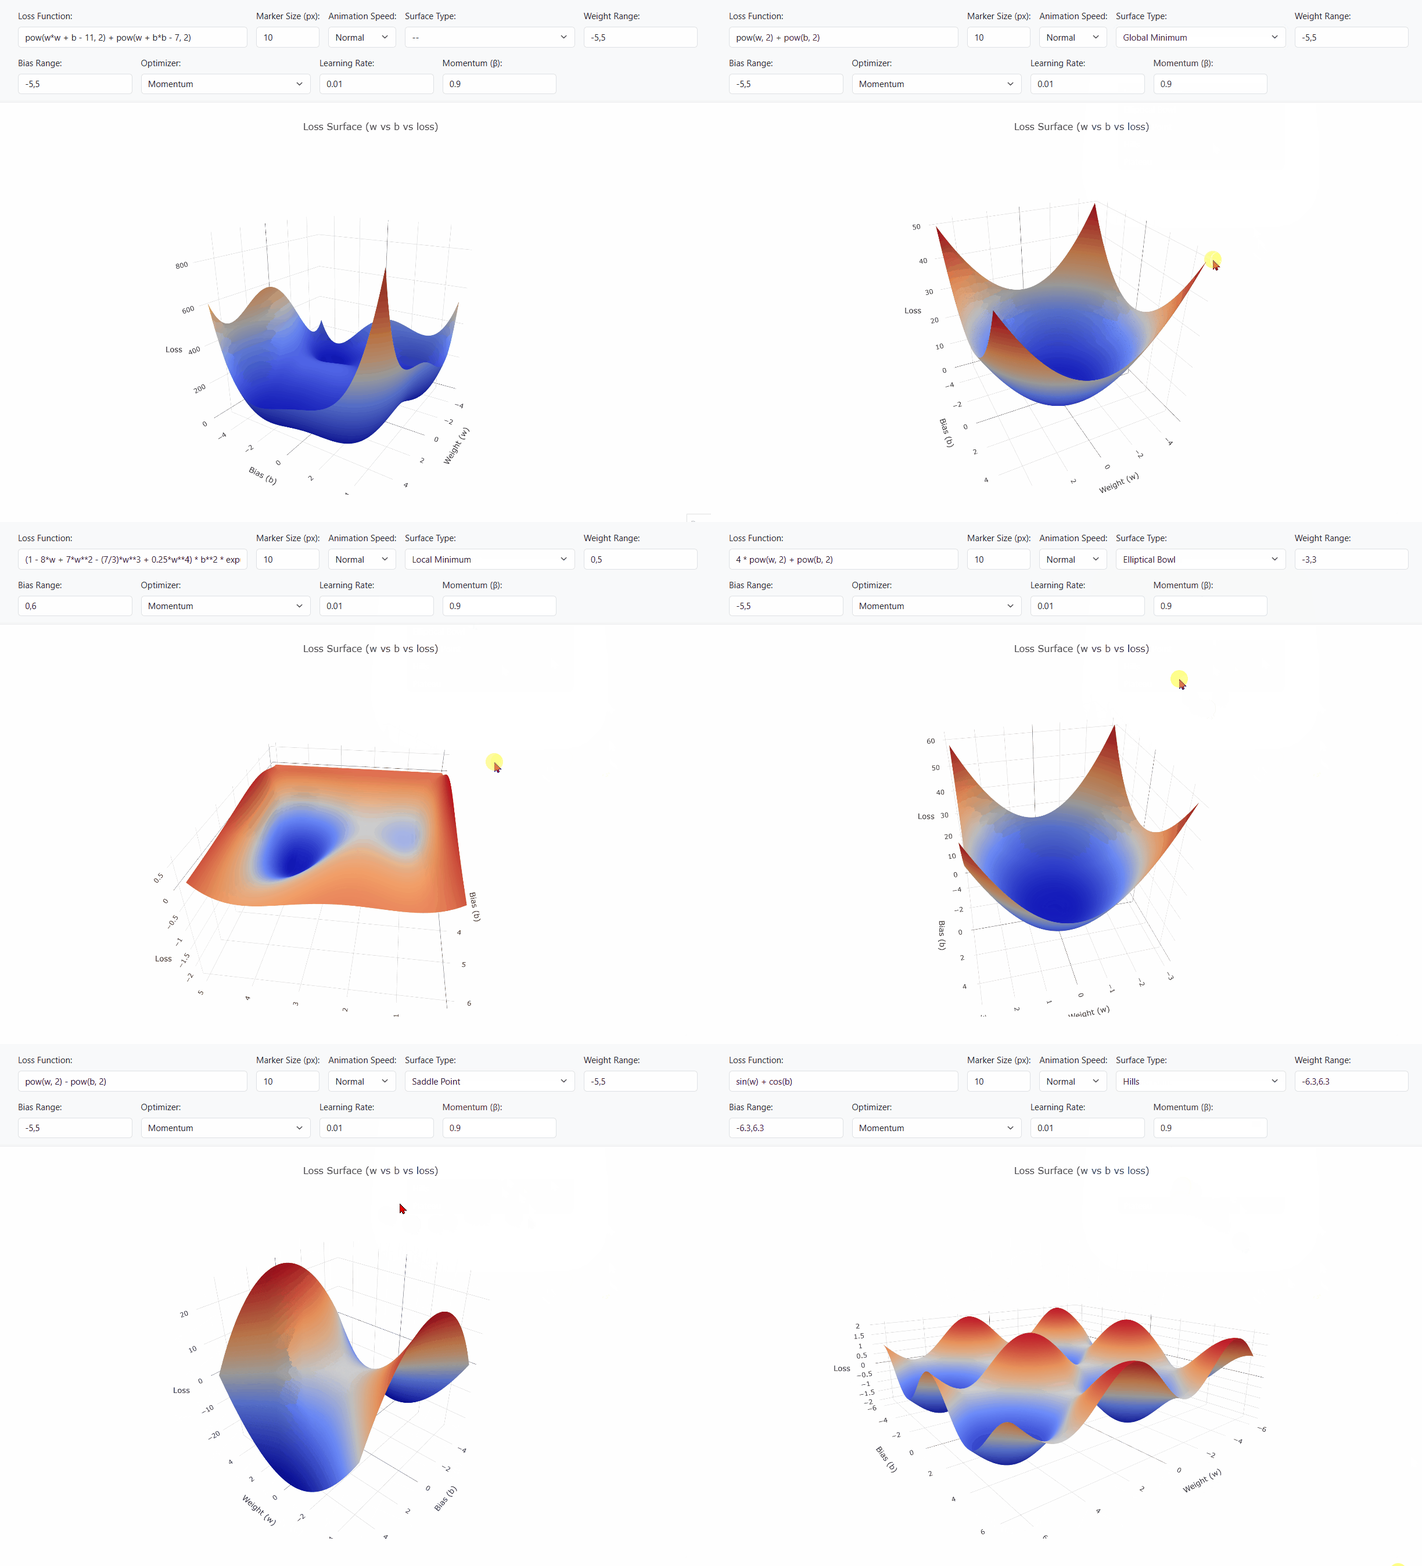
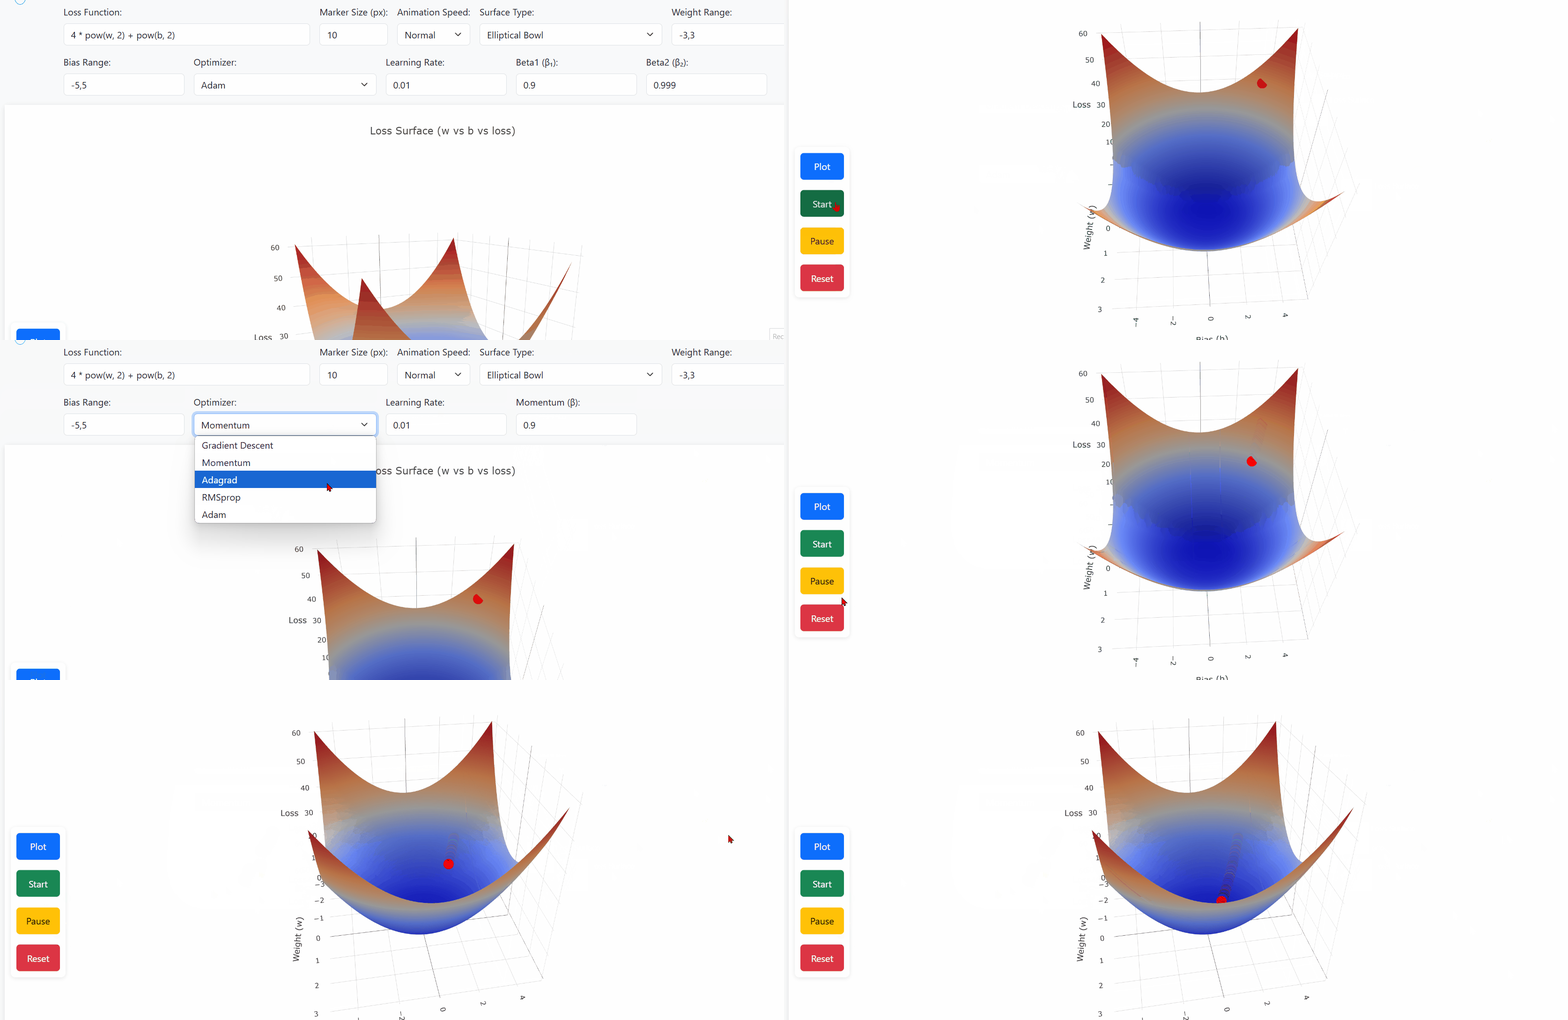
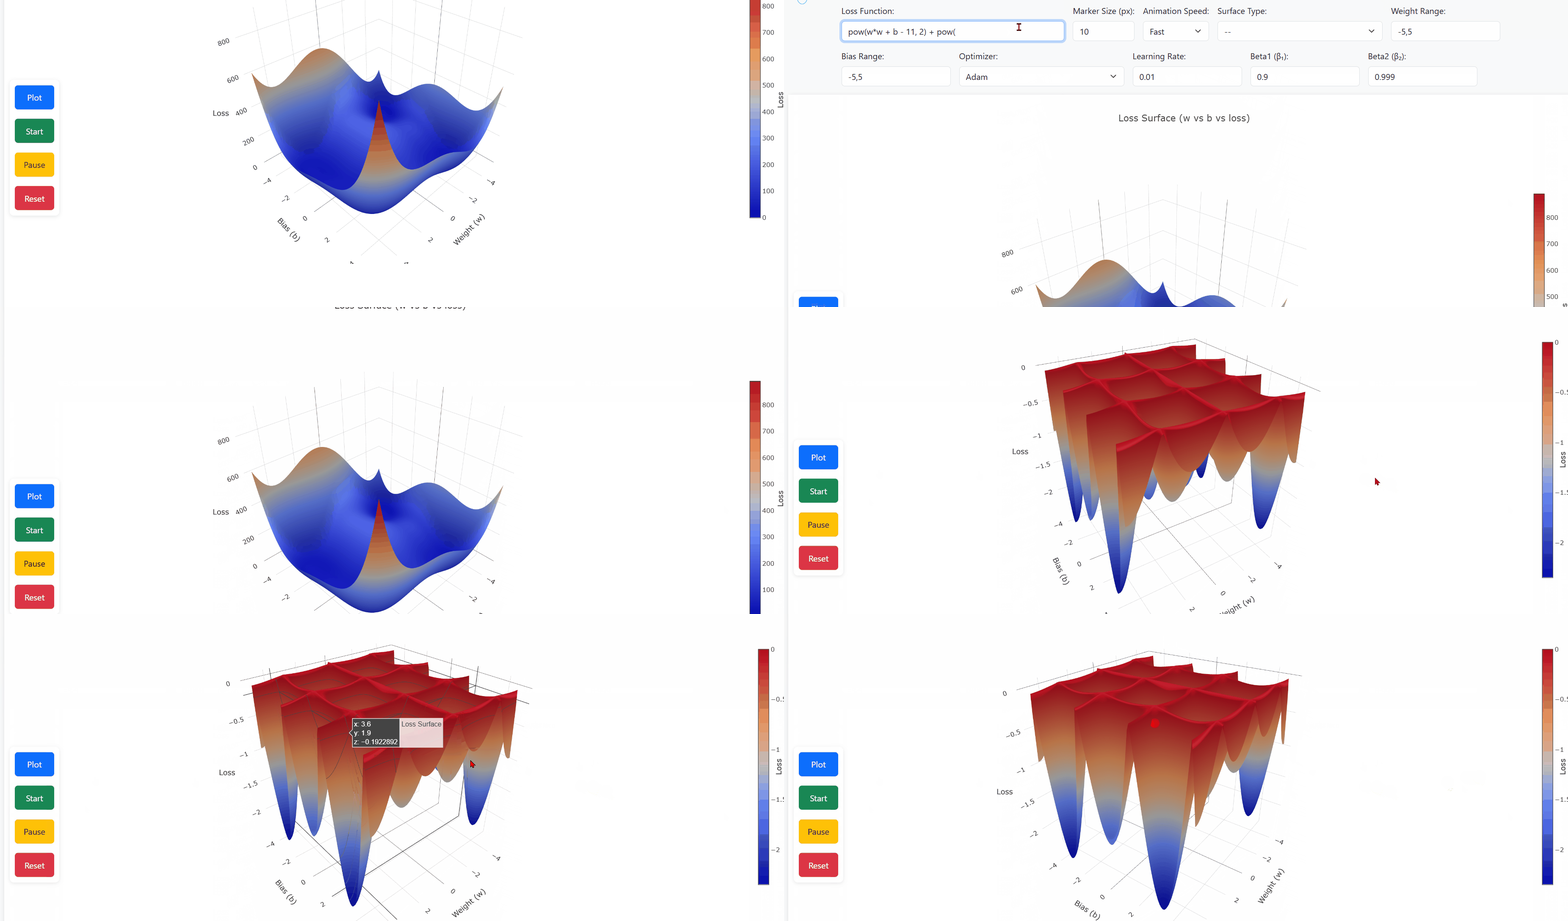
A dynamic 3D tool to explore how optimization algorithms traverse a loss surface in real time.
| 3D Loss Surface | Different optimizers | Custom surface |
|---|---|---|
 |
 |
 |
- 🧠 Explore optimizers: SGD, Momentum, Adagrad, RMSProp, Adam
- 📈 Real-time 3D visualizations using Plotly
- ✍️ Input custom loss surfaces using different functions
- 🎚️ Adjust hyperparameters: learning rate, momentum, decay, beta values
- ⏯️ Play, pause, reset animations and reinitialize points
- Enter a loss function or select a default surface, e.g.:
pow(w*w + b - 6, 2) + pow(w + b*b - 5, 2) - Choose an optimizer and adjust its parameters
- Click or tap on the plot to place a starting marker
- Press Start to begin optimization
- Pause or reset to test different configurations
This project was built to help learners visually grasp the behavior of optimization algorithms used in deep learning and machine learning.