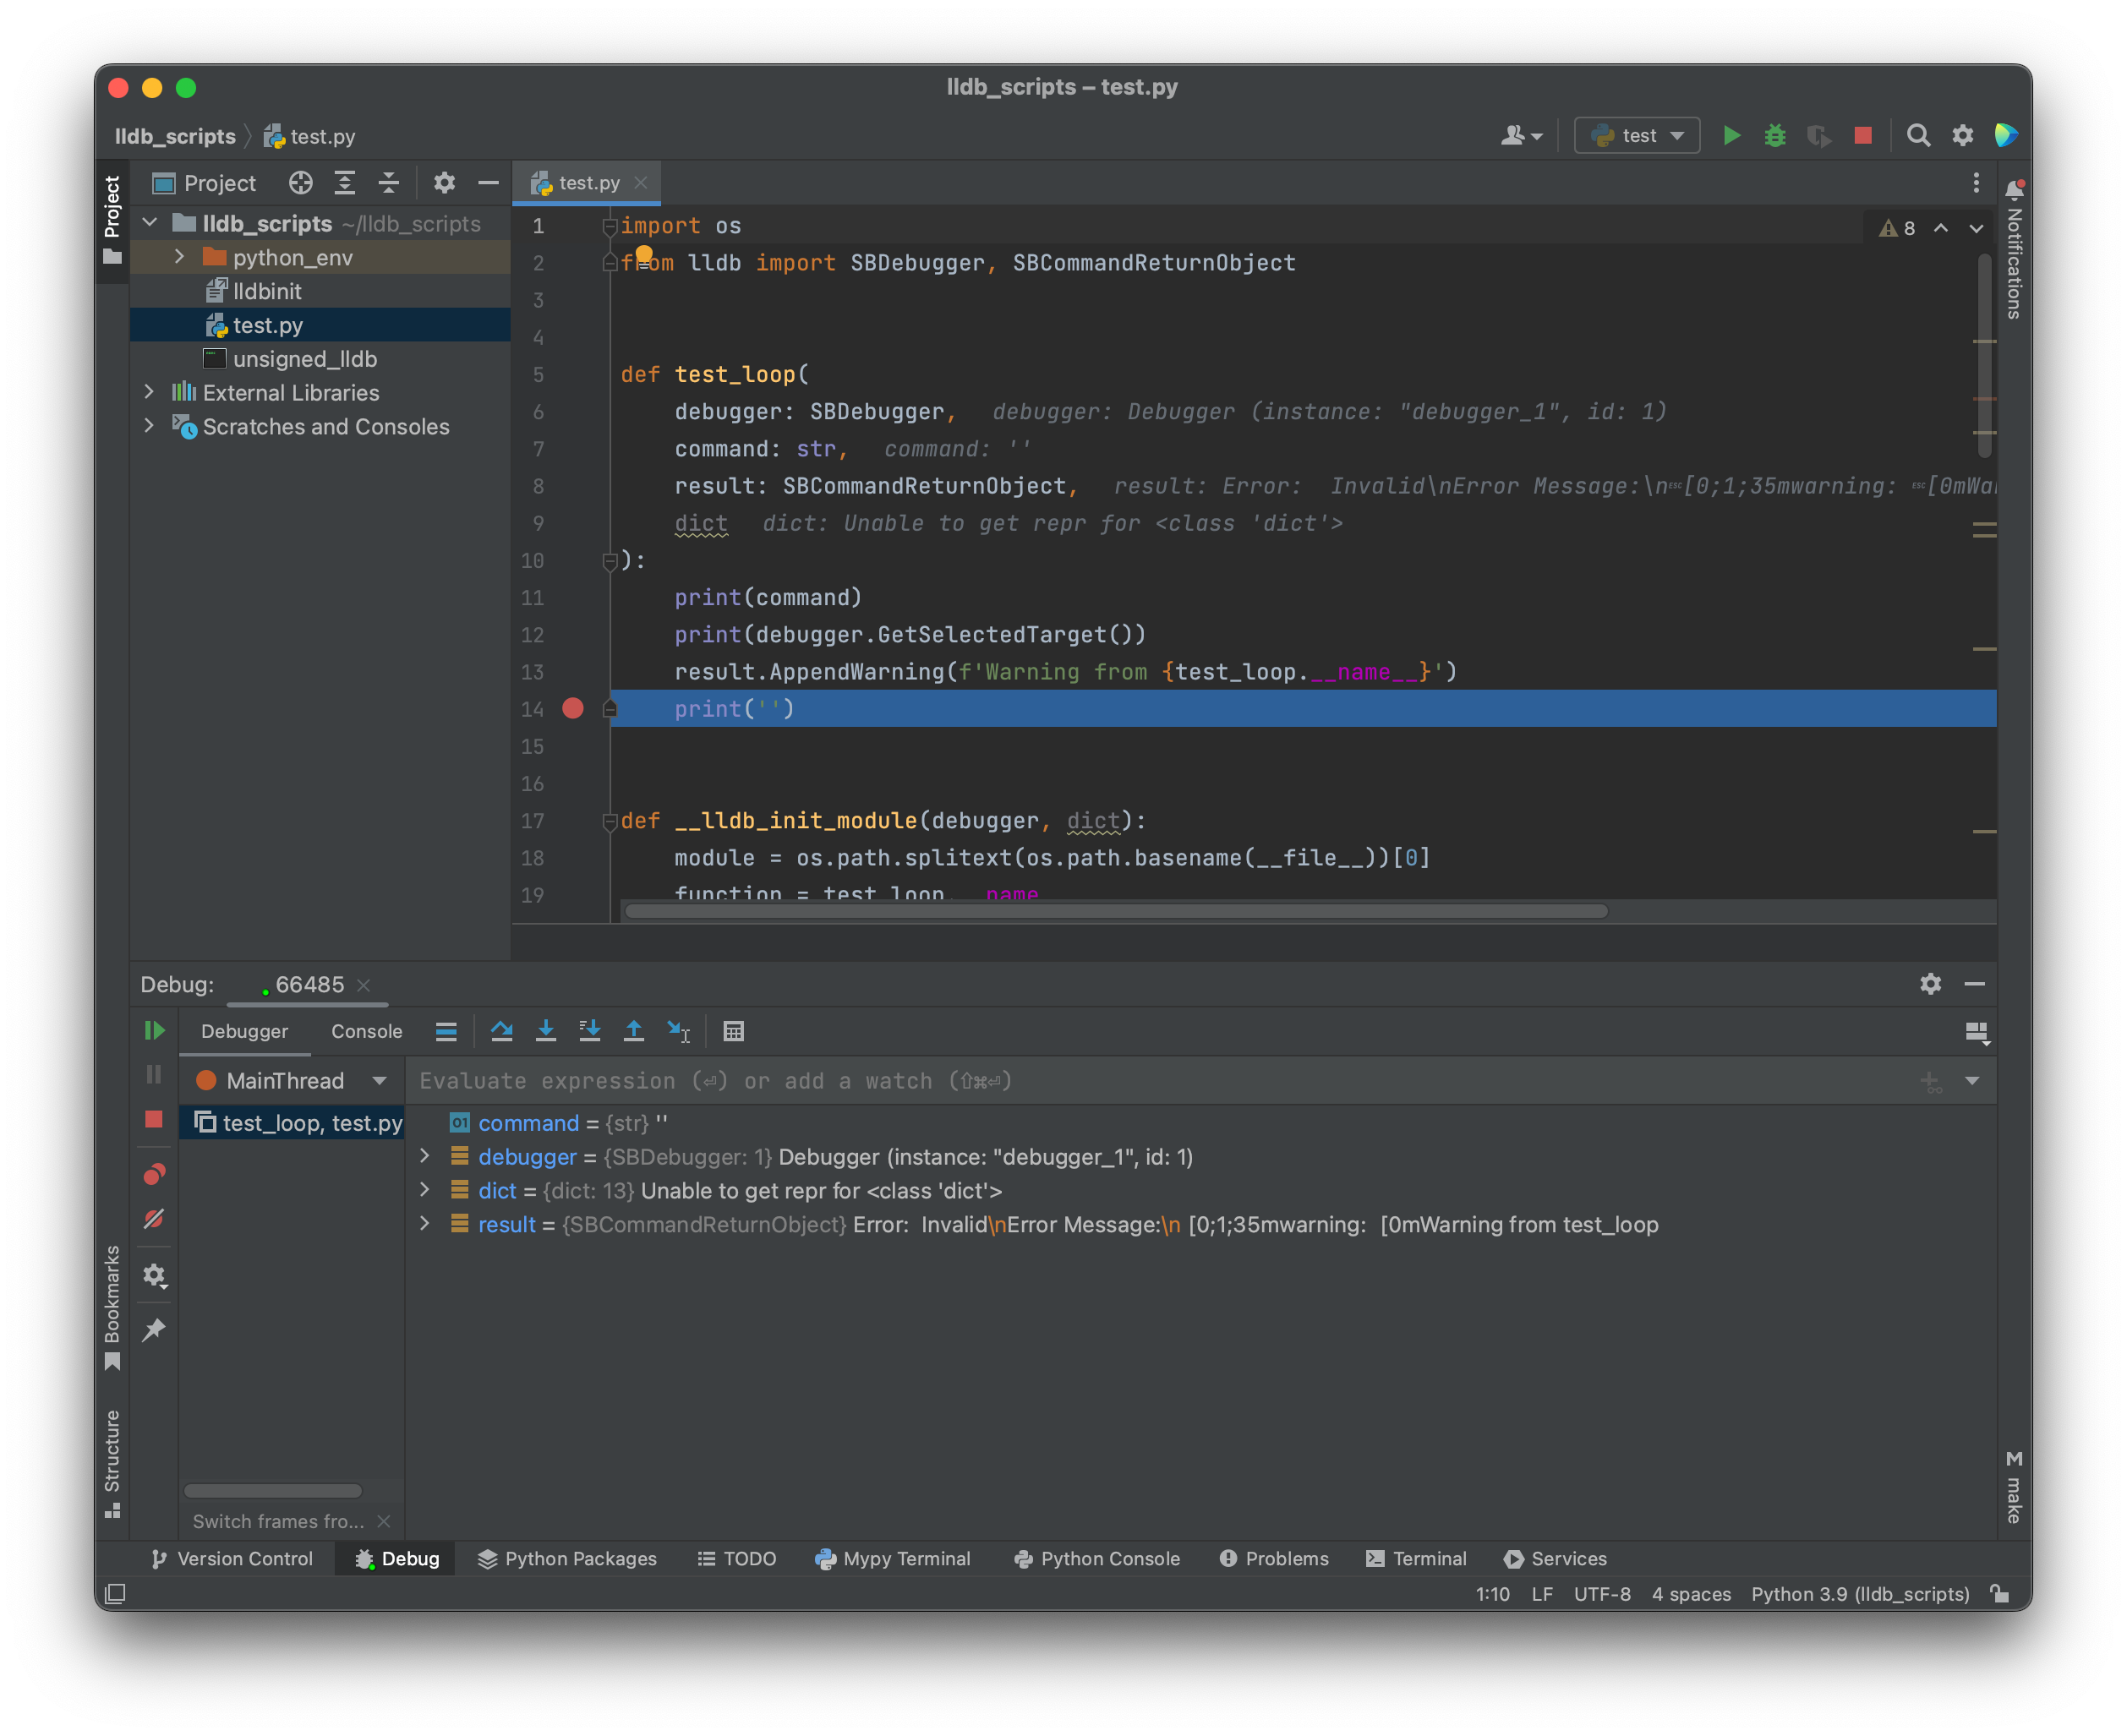
This is the setup I use to work on lldb Python scripts in PyCharm with debugging and code-completion:
First you will need a copy of lldb with an ad-hoc signature; otherwise, PyCharm won't be able to attach:
cp "$(xcrun -f lldb)" unsigned_lldb
codesign --force --sign - unsigned_lldb
Next you will need a virtual environment:
sh -c 'exec "$(xcode-select -p)"/Library/Frameworks/Python3.framework/Versions/Current/bin/python3 -m venv python_env'Make a script for lldb and import it in .lldbinit. If you are on an arm64 macOS you will need to compile a custom pydevd shim because PyCharm only ships x86_64 binary. The source code for the shim is shipped with PyCharm:
cd "/Applications/PyCharm CE.app/Contents/plugins/python-ce/helpers/pydev/pydevd_attach_to_process/linux_and_mac"
g++ -fPIC -D_REENTRANT -std=c++11 -arch arm64 -c -o attach_arm64.o attach.cpp
g++ -dynamiclib -nostartfiles -arch arm64 -o attach_arm64.dylib attach_arm64.o -lc
and use configure_pydevd() from pydevd_support.py.
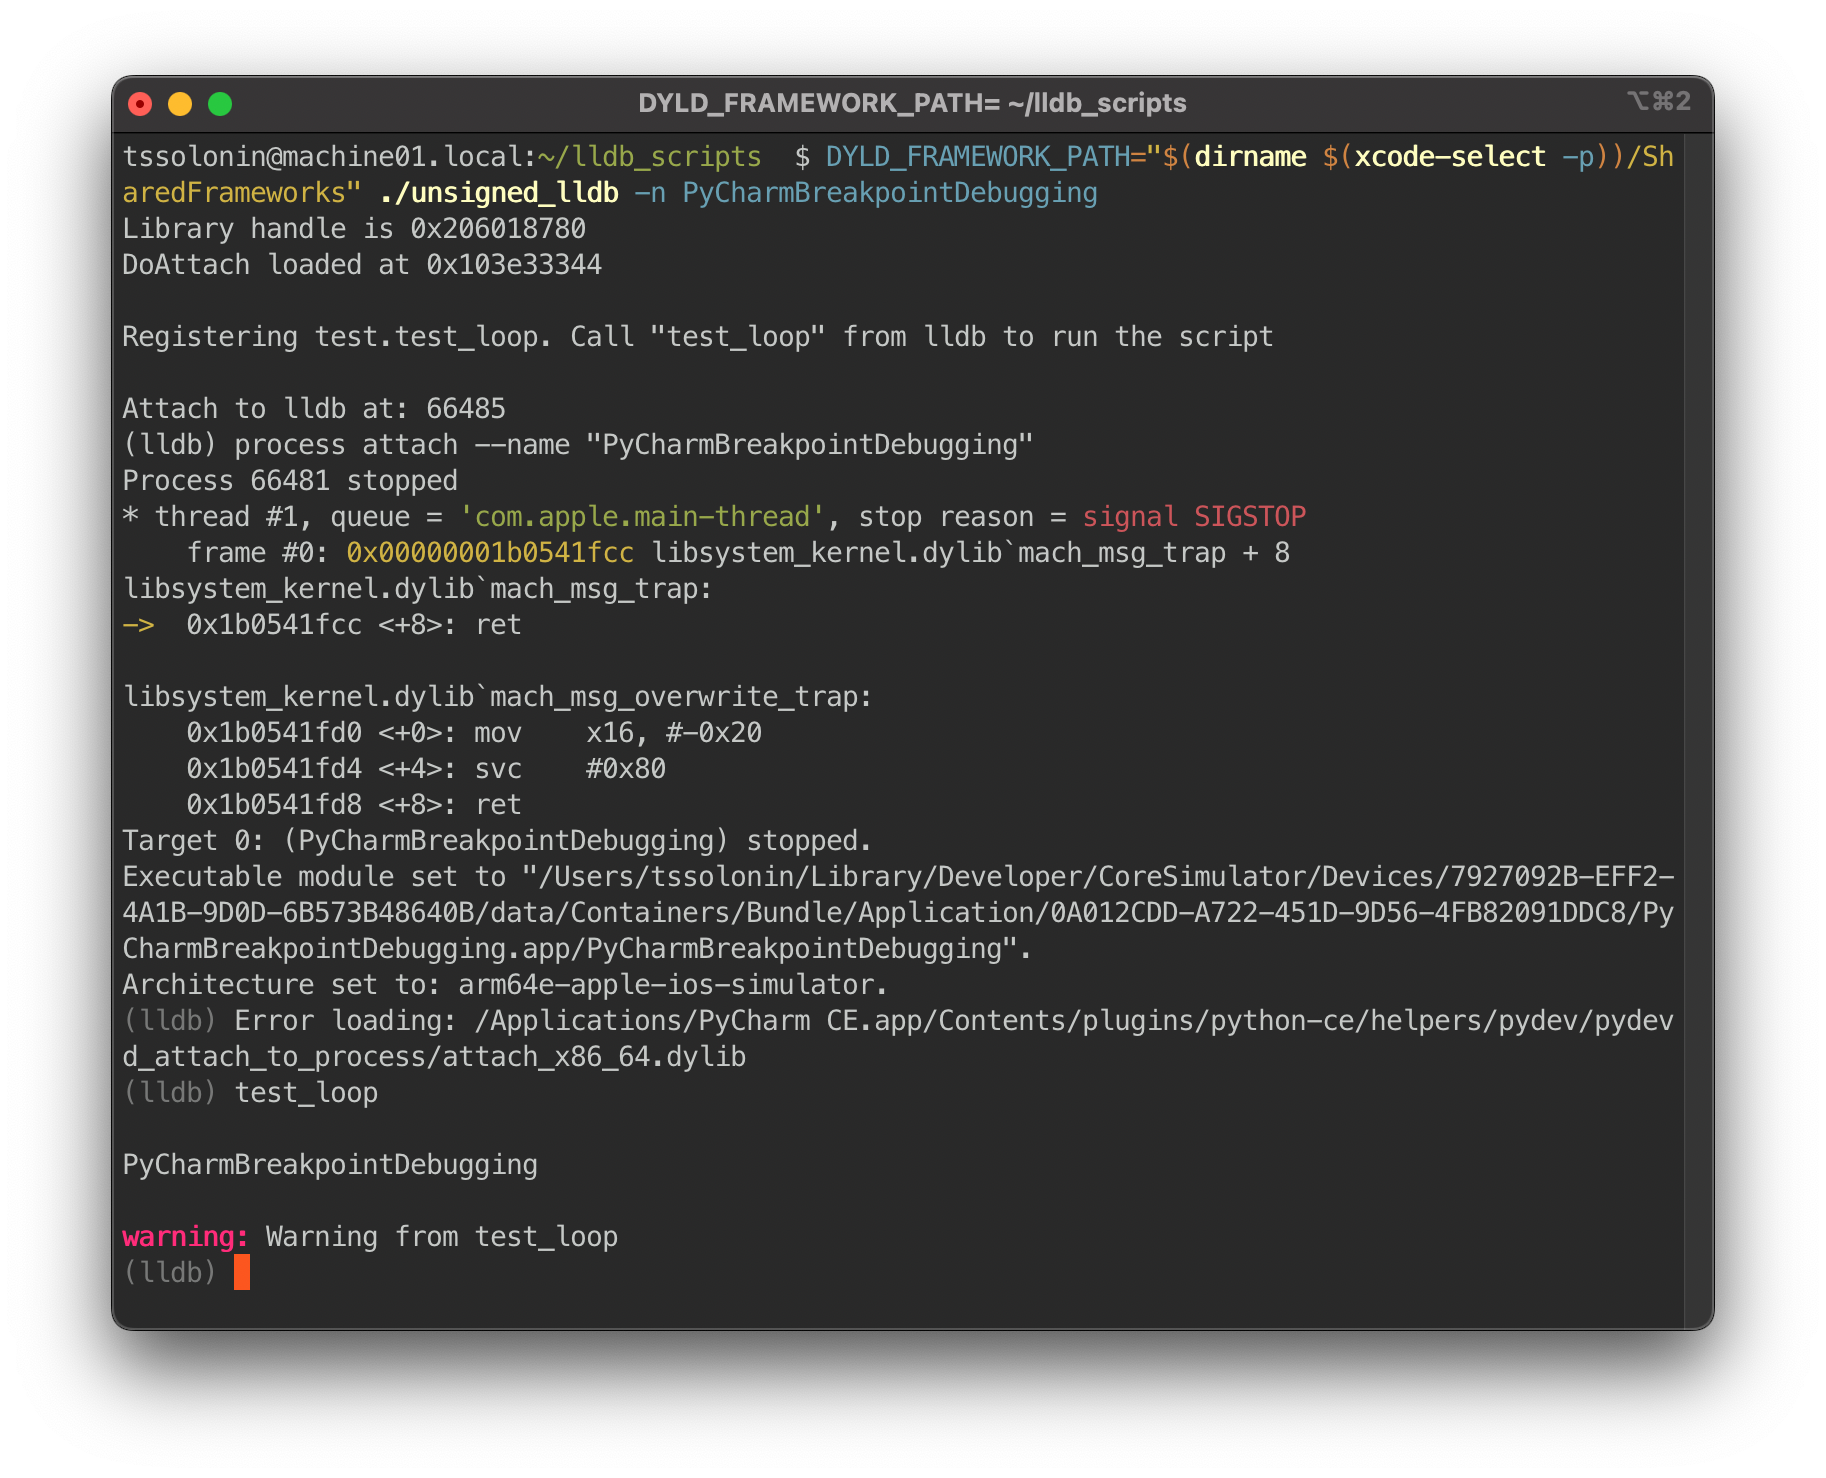
Now run lldb:
DYLD_FRAMEWORK_PATH="$(dirname $(xcode-select -p))/SharedFrameworks" ./unsigned_lldb --local-lldbinitAttach to the lldb process in PyCharm, set a breakpoint and run the command. PyCharm will break at a breakpoint, and you will be able to debug.
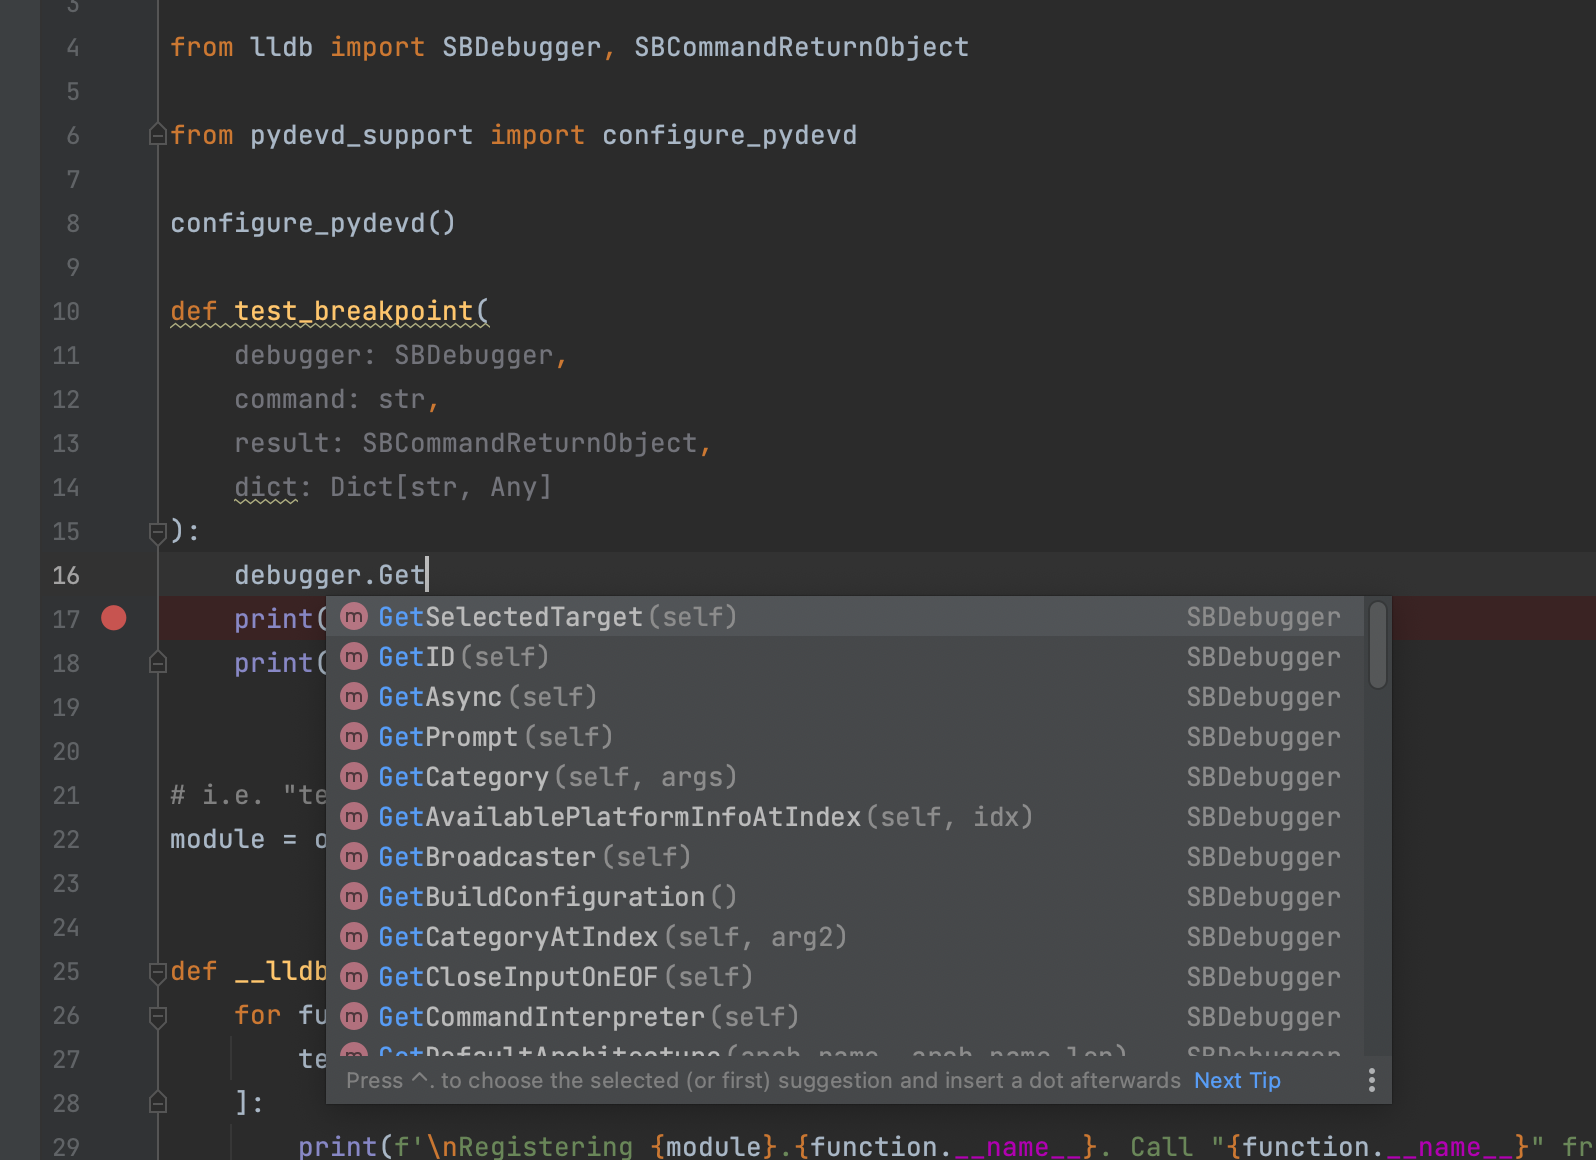
For completions support create a pth pointer to the lldb module:
echo "$(dirname $(xcode-select -p))"/SharedFrameworks/LLDB.framework/Versions/A/Resources/Python > "$(echo python_env/lib/python*)/site-packages/lldb.pth"

