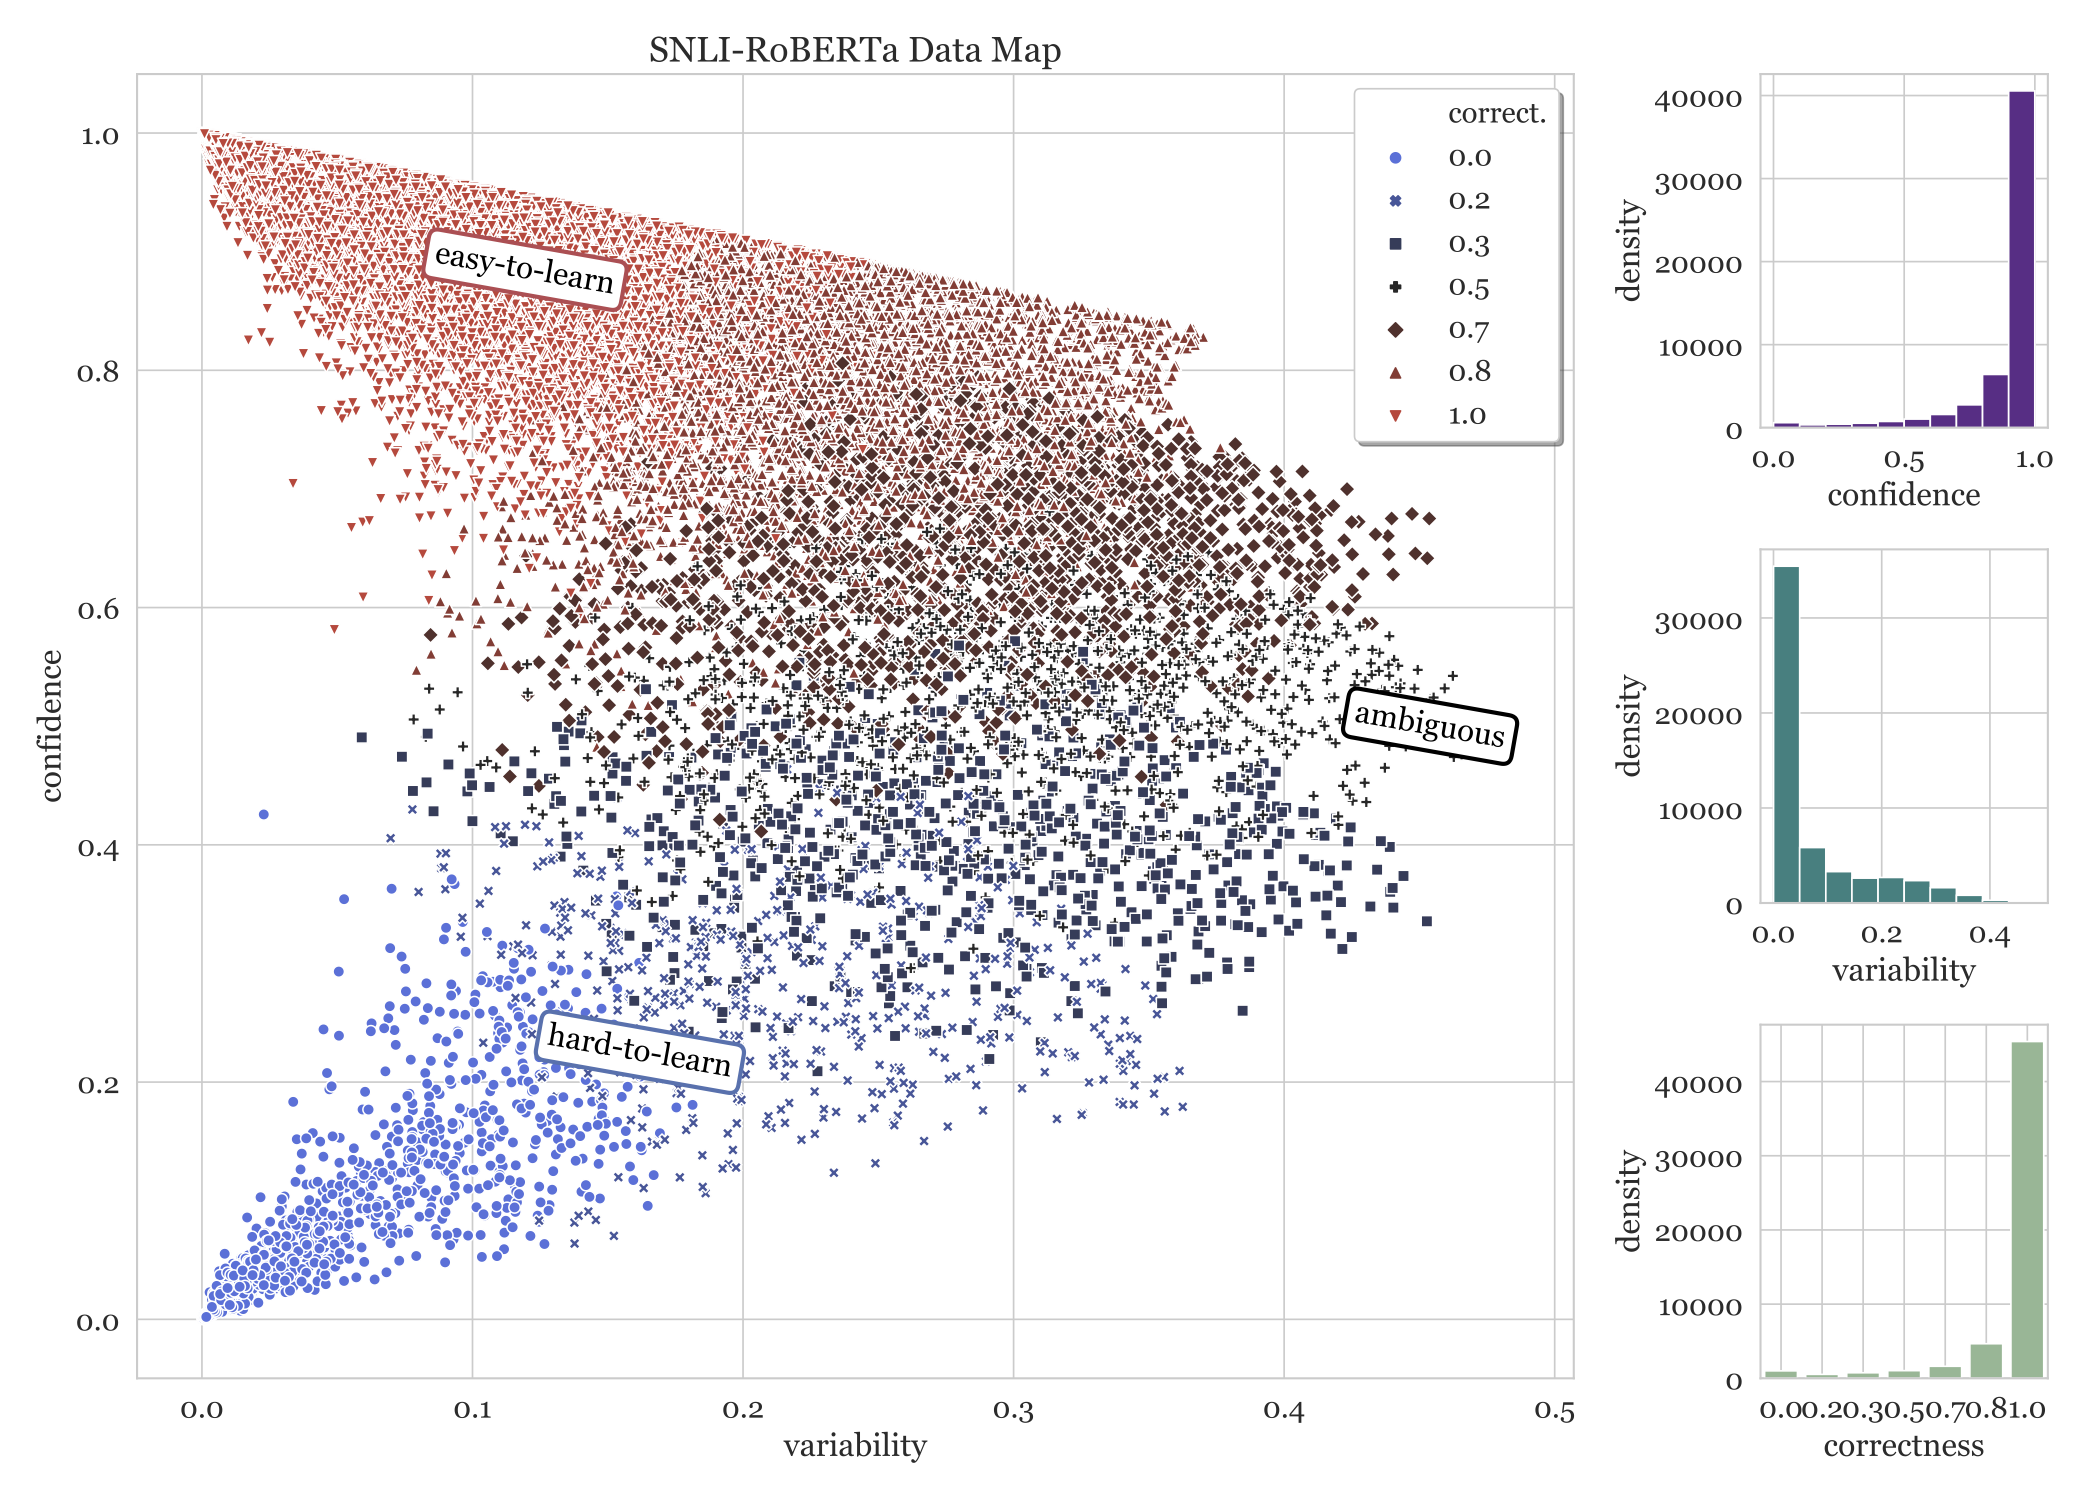
Code for the paper Dataset Cartography: Mapping and Diagnosing Datasets with Training Dynamics at EMNLP 2020.
This repository contains implementation of data maps, as well as other data selection baselines, along with notebooks for data map visualizations.
If using, please cite:
@inproceedings{swayamdipta2020dataset,
    title={Dataset Cartography: Mapping and Diagnosing Datasets with Training Dynamics},
    author={Swabha Swayamdipta and Roy Schwartz and Nicholas Lourie and Yizhong Wang and Hannaneh Hajishirzi and Noah A. Smith and Yejin Choi},
    booktitle={Proceedings of EMNLP},
    url={https://arxiv.org/abs/2009.10795},
    year={2020}
}
This repository can be used to build Data Maps, like this one for SNLI using a RoBERTa-Large classifier.

This repository is based on the HuggingFace Transformers library.
To train a GLUE-style model using this repository:
python -m cartography.classification.run_glue \
    -c configs/$TASK.jsonnet \
    --do_train \
    --do_eval \
    -o $MODEL_OUTPUT_DIR
The best configurations for our experiments for each of the $TASKs (SNLI, MNLI, QNLI or WINOGRANDE) are provided under configs.
This produces a training dynamics directory $MODEL_OUTPUT_DIR/training_dynamics, see a sample here.
Note: you can use any other set up to train your model (independent of this repository) as long as you produce the dynamics_epoch_$X.jsonl for plotting data maps, and filtering different regions of the data.
The .jsonl file must contain the following fields for every training instance:
guid: instance ID matching that in the original data file, for filtering,logits_epoch_$X: logits for the training instance under epoch$X,gold: index of the gold label, must match the logits array.
To plot data maps for a trained $MODEL (e.g. RoBERTa-Large) on a given $TASK (e.g. SNLI, MNLI, QNLI or WINOGRANDE):
python -m cartography.selection.train_dy_filtering \
    --plot \
    --task_name $TASK \
    --model_dir $PATH_TO_MODEL_OUTPUT_DIR_WITH_TRAINING_DYNAMICS \
    --model $MODEL_NAME
To select (different amounts of) data based on various metrics from training dynamics:
python -m cartography.selection.train_dy_filtering \
    --filter \
    --task_name $TASK \
    --model_dir $PATH_TO_MODEL_OUTPUT_DIR_WITH_TRAINING_DYNAMICS \
    --metric $METRIC \
    --data_dir $PATH_TO_GLUE_DIR_WITH_ORIGINAL_DATA_IN_TSV_FORMAT
Supported $TASKs include SNLI, QNLI, MNLI and WINOGRANDE, and $METRICs include confidence, variability, correctness, forgetfulness and threshold_closeness; see paper for more details.
To select hard-to-learn instances, set $METRIC as "confidence" and for ambiguous, set $METRIC as "variability". For easy-to-learn instances: set $METRIC as "confidence" and use the flag --worst.