Check out my visualization dashboard here!
This project creates a visualization dashboard website using weather visualizations I created previously, where weather data were requested from API, analyzed, and plotted.
This dashboard contains the following pages:
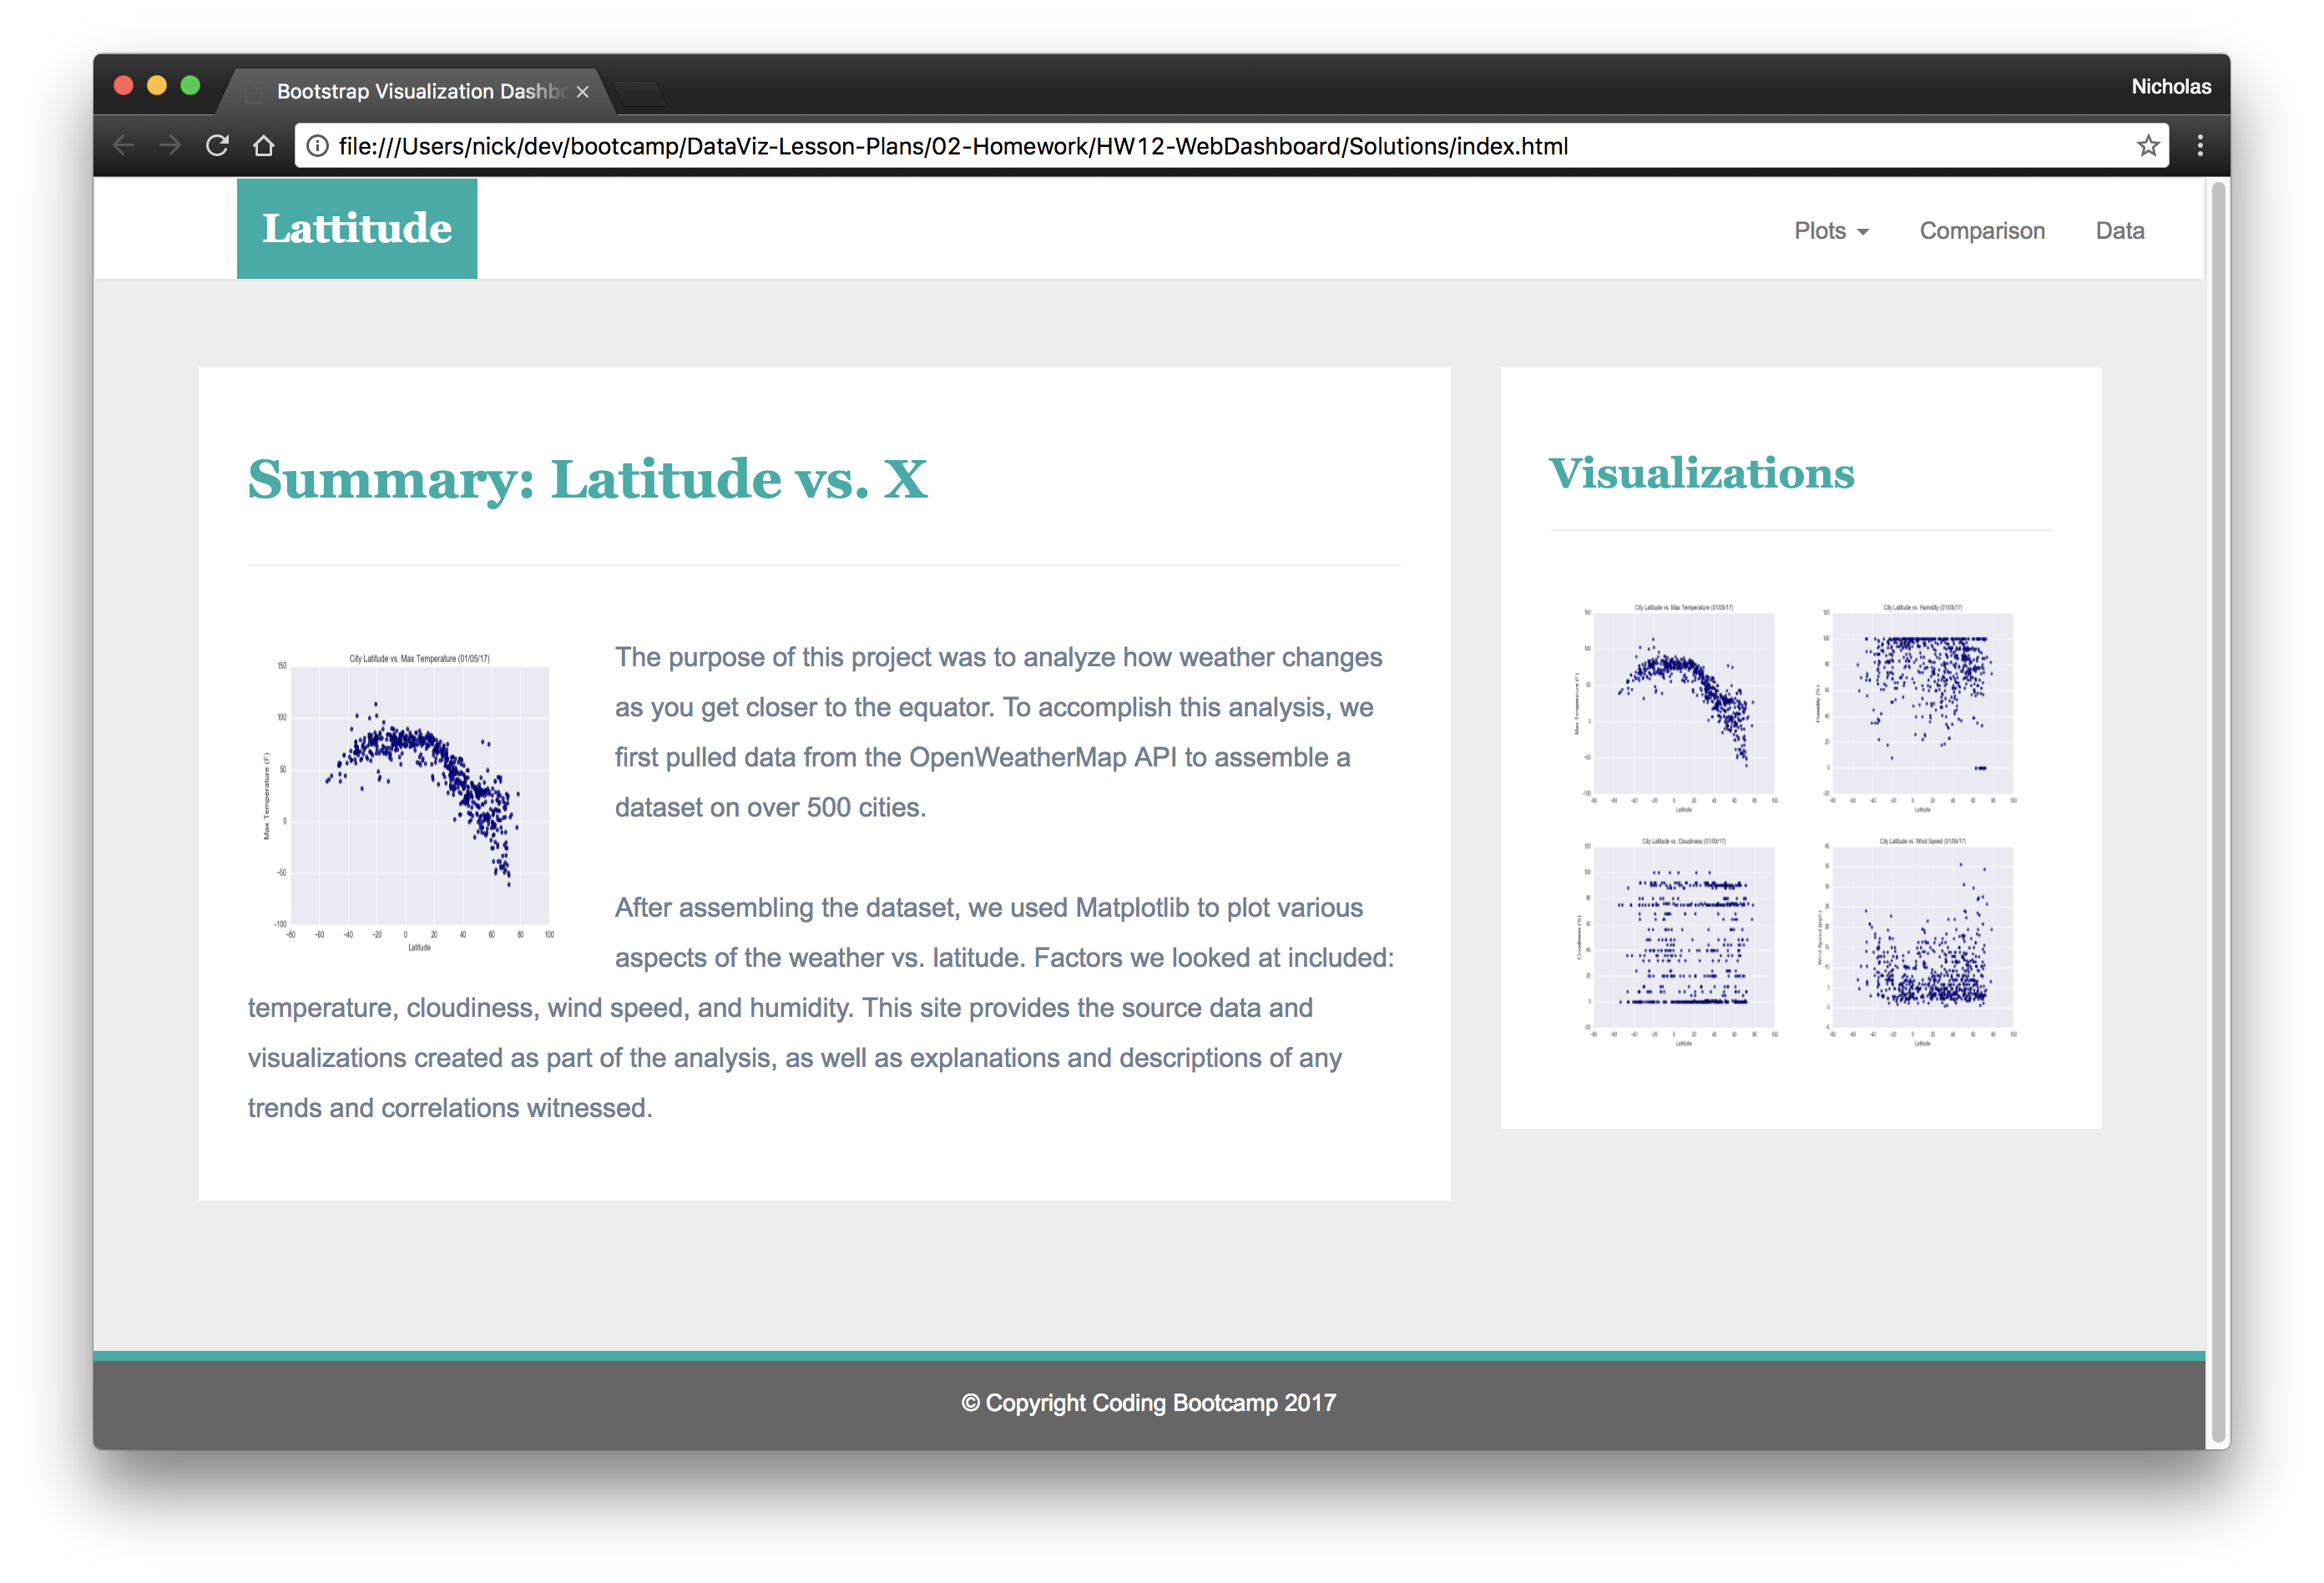
- A landing page:
- An explanation of the project.
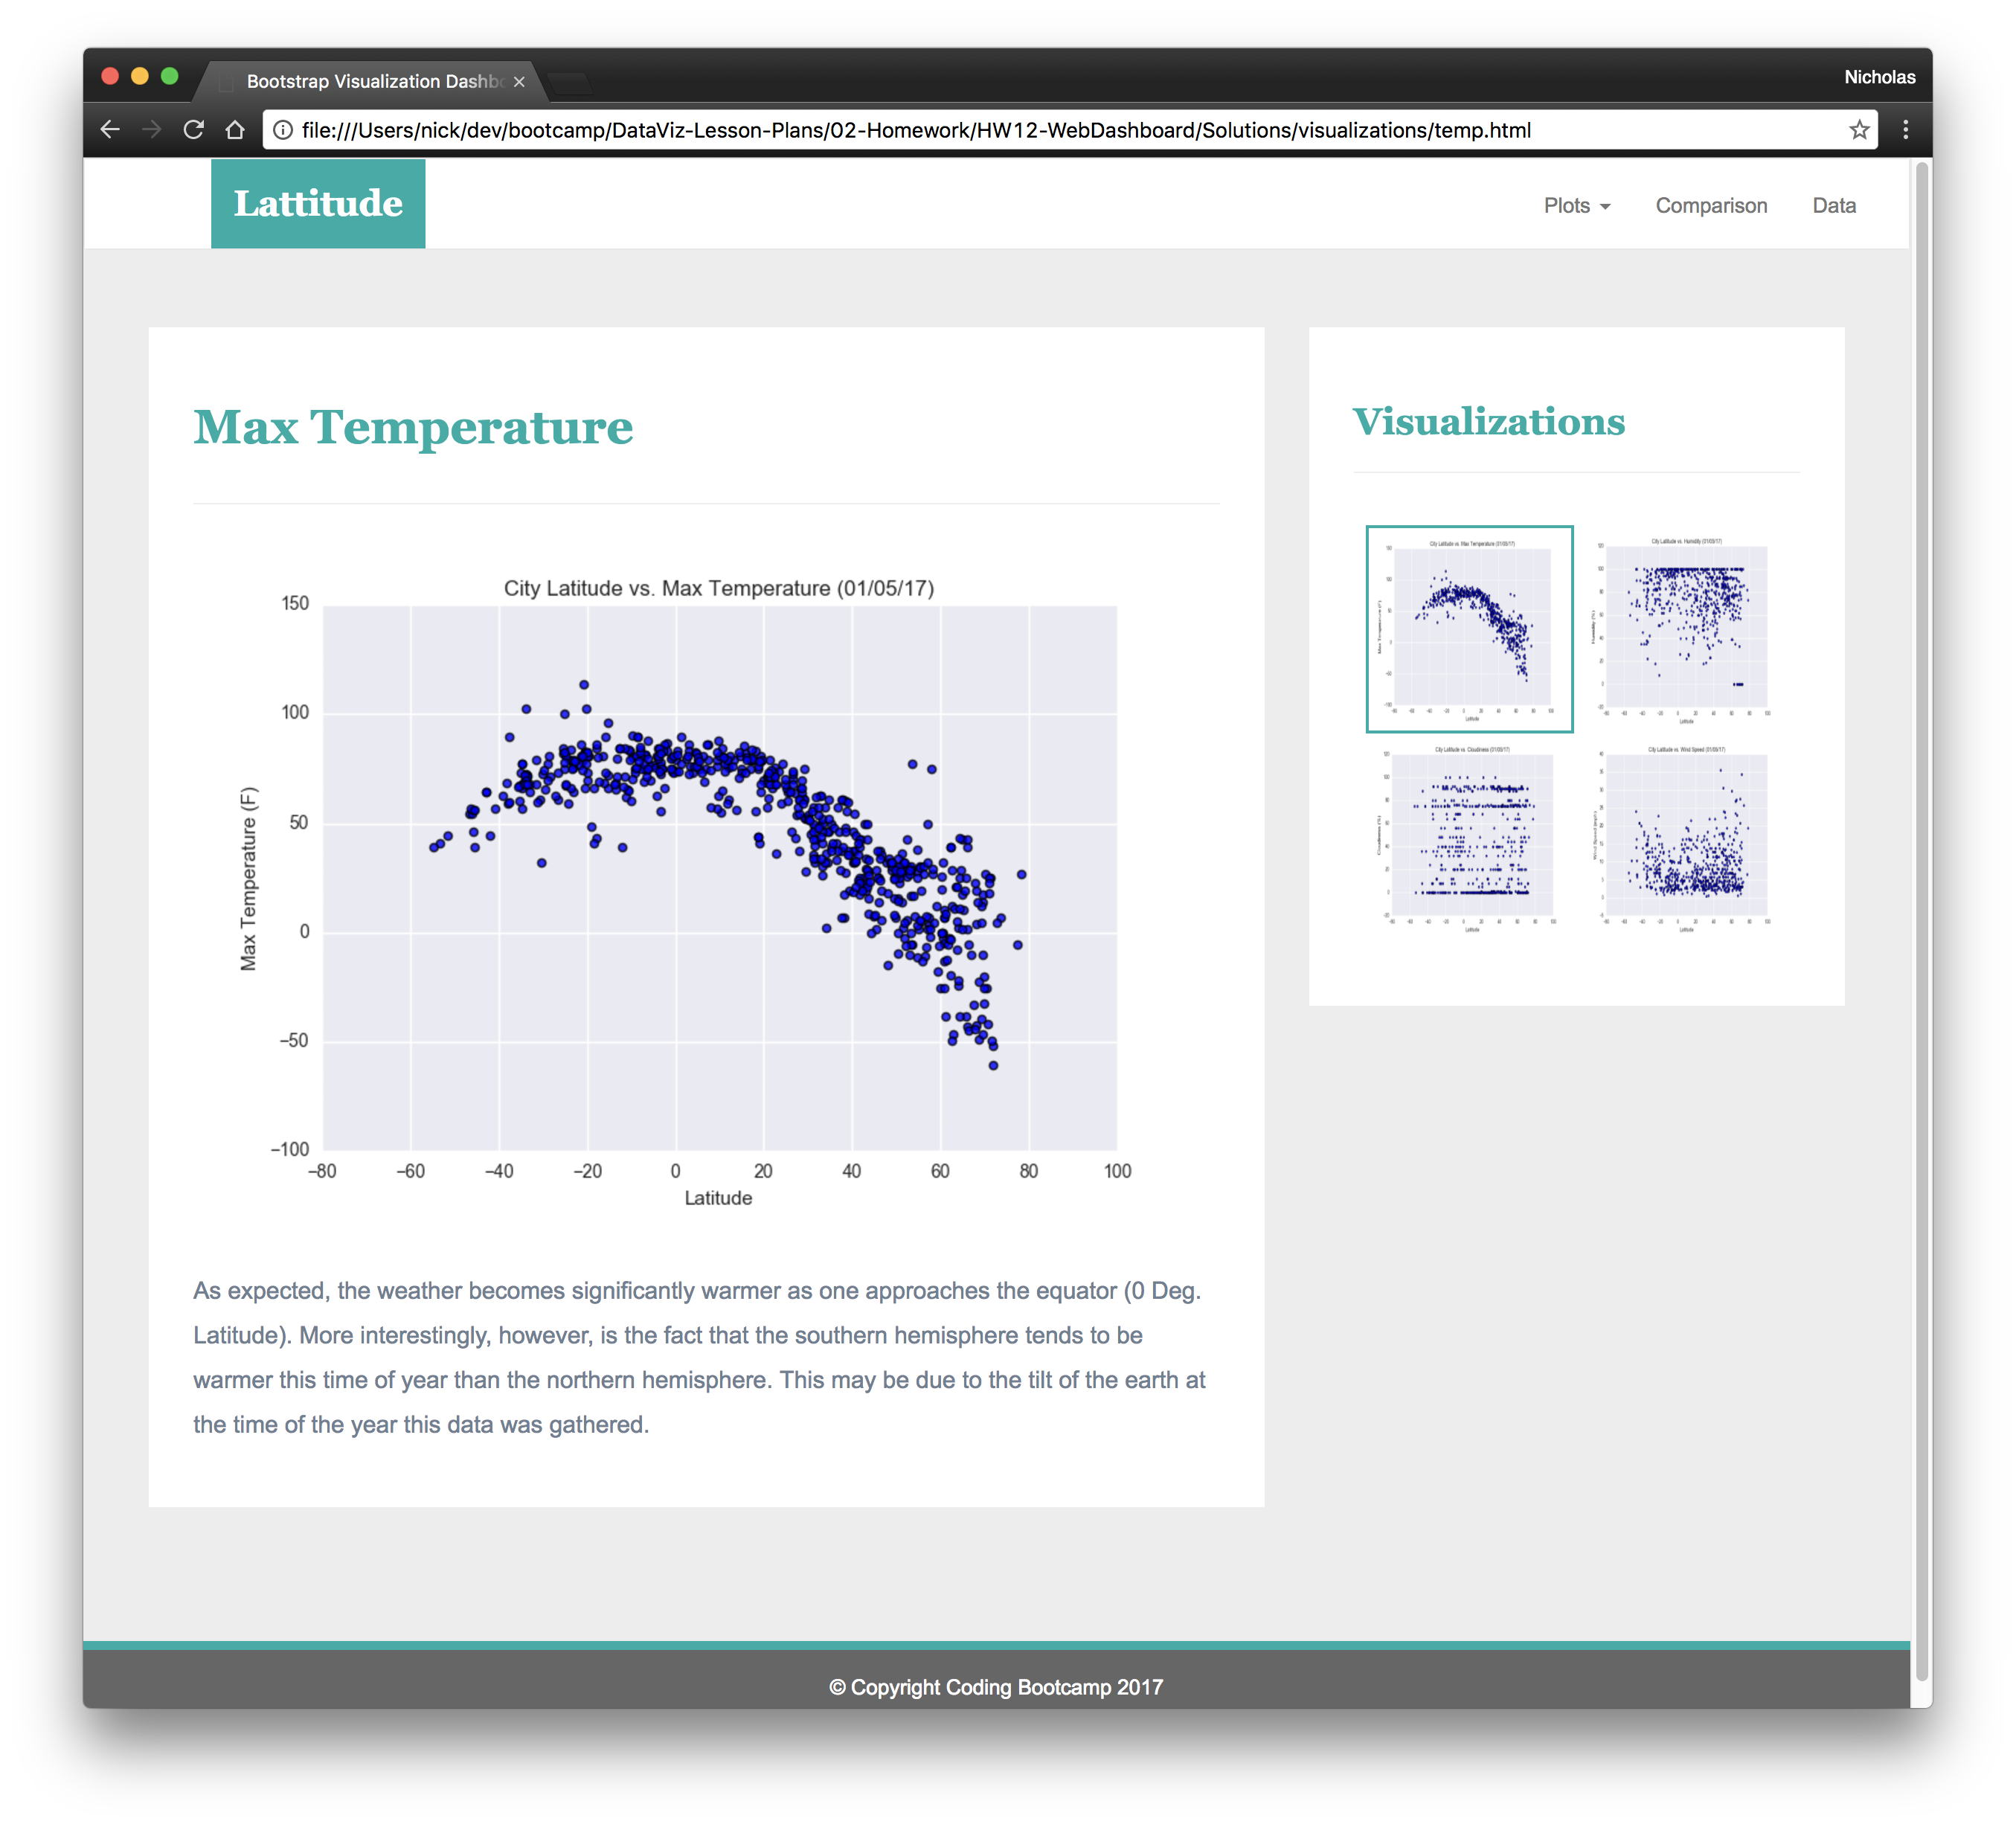
- Four visualization pages(temperature, humidity, cloudiness, and wind speed):
- The plot/visualization for the selected comparison.
- A paragraph describing the plot and its significance.
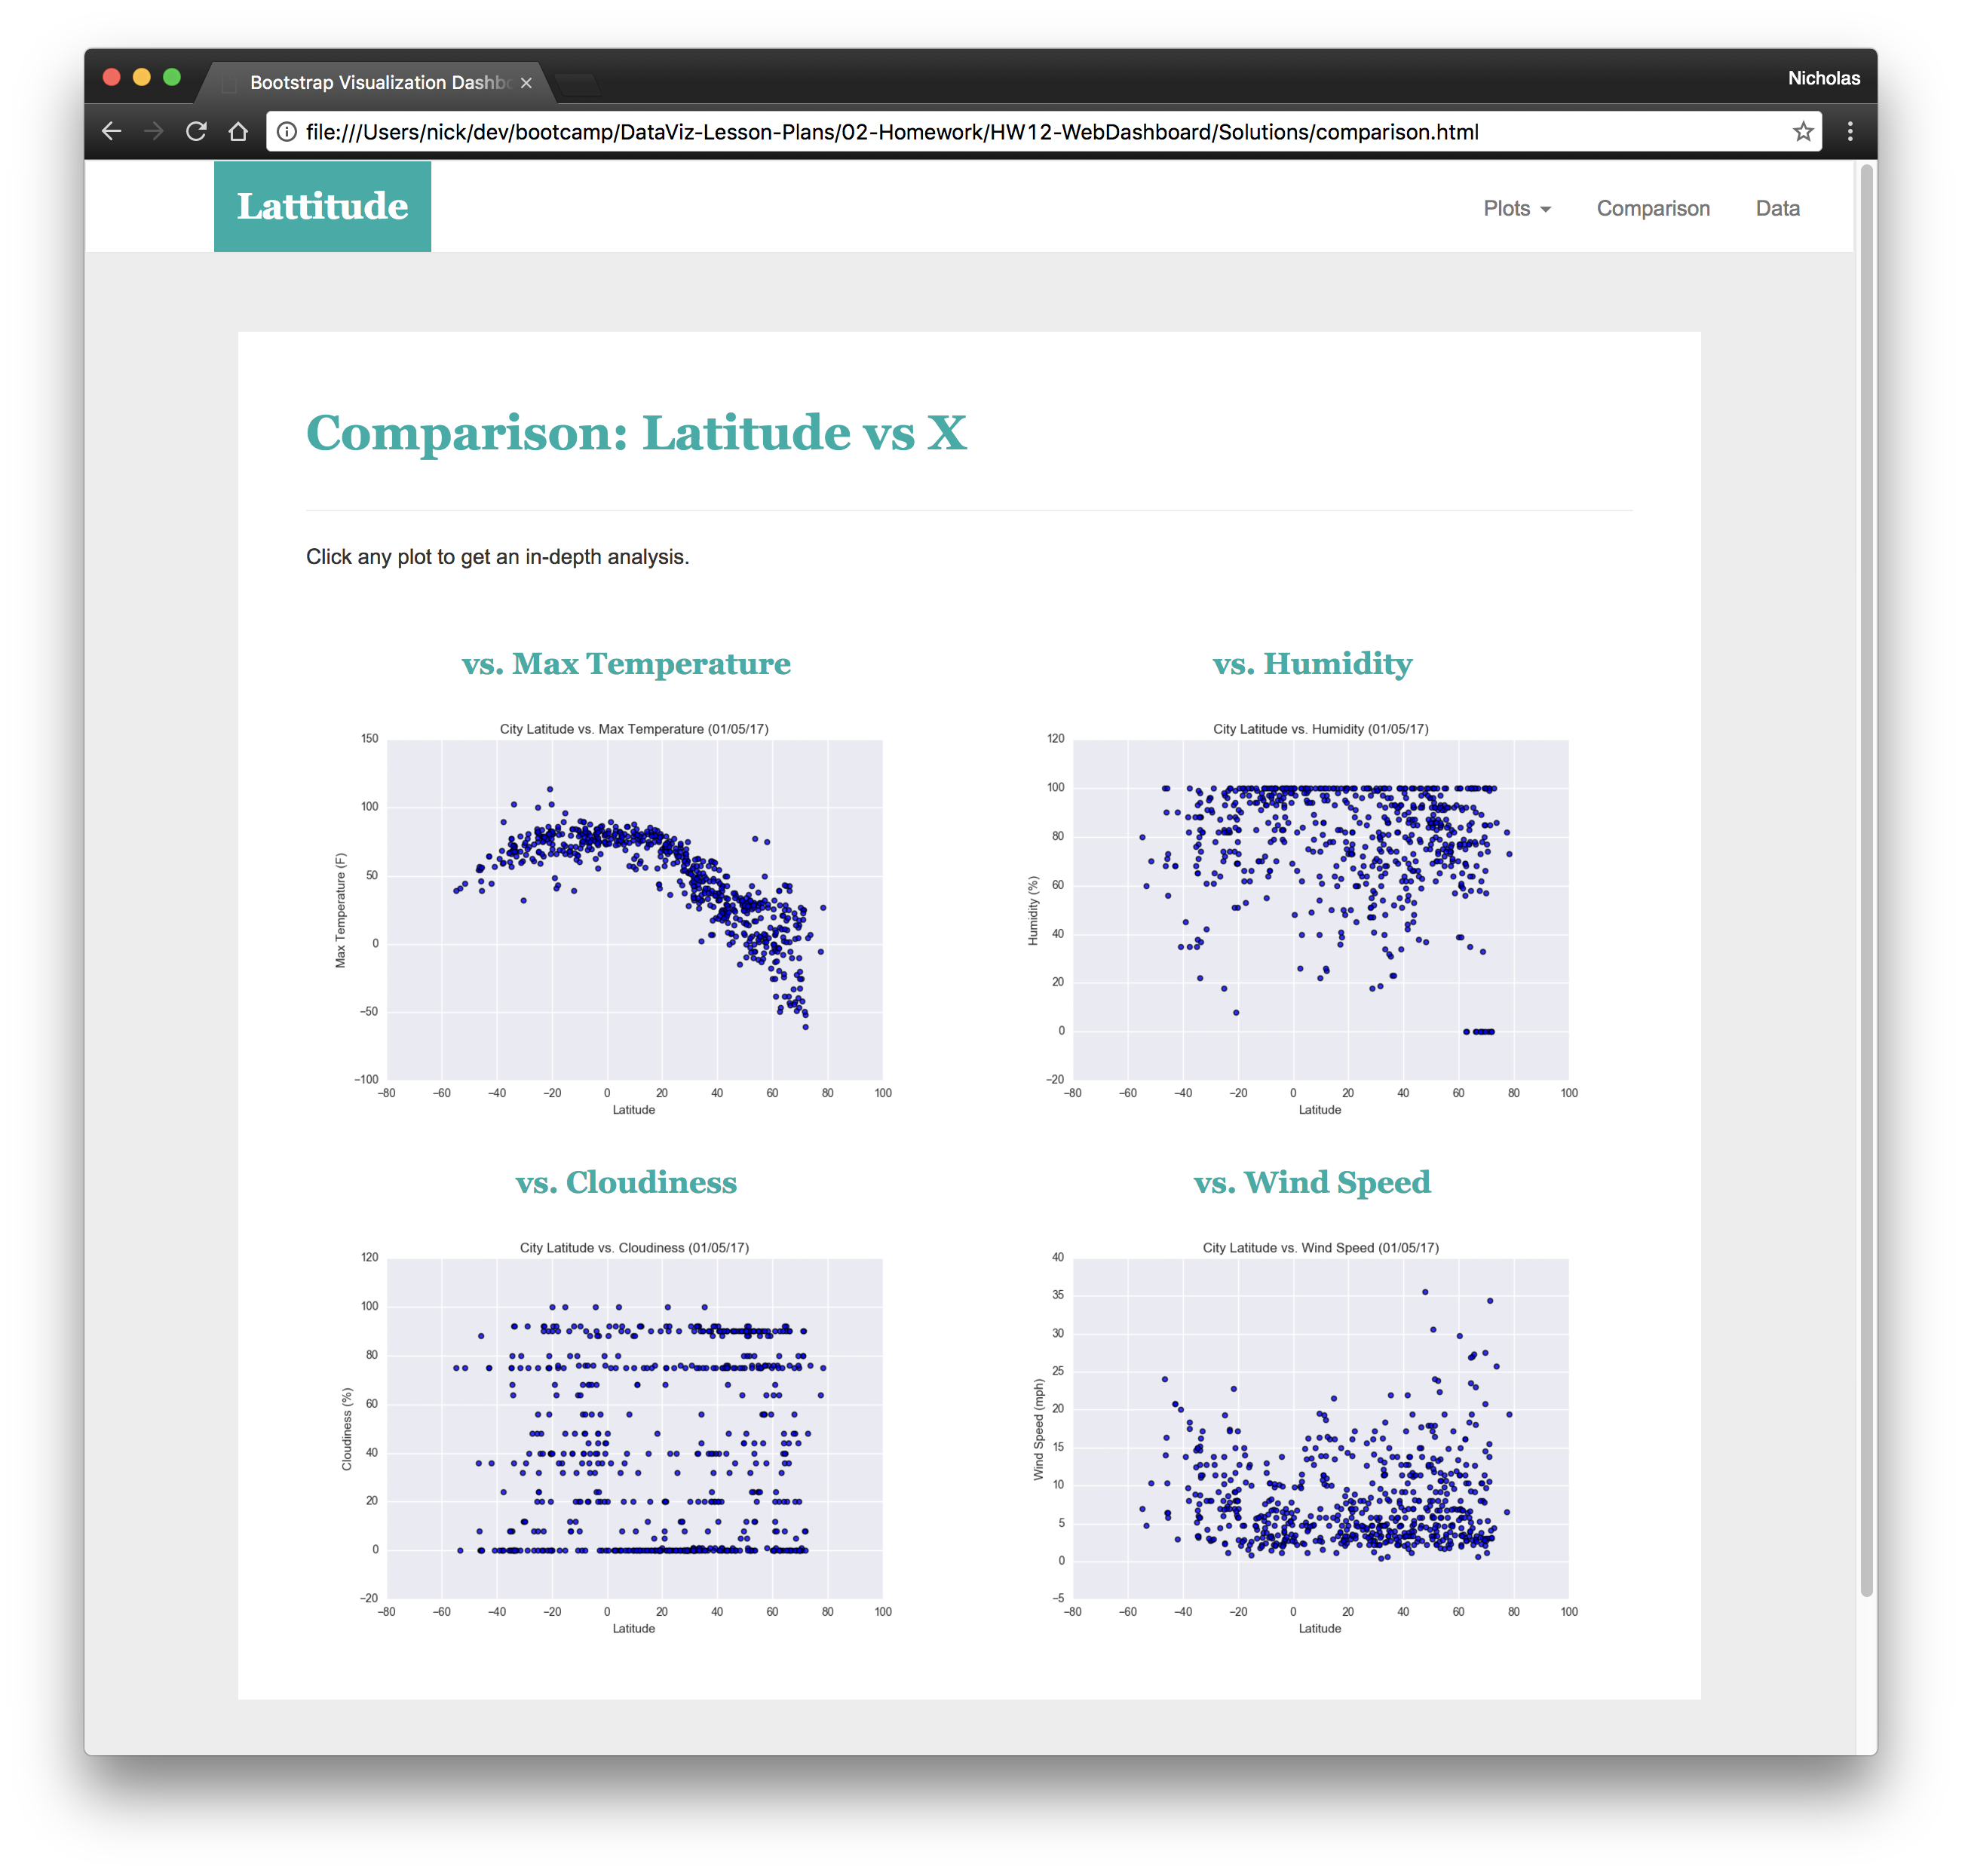
- A comparison page:
- All of the visualizations on the same page so we can easily visually compare them.
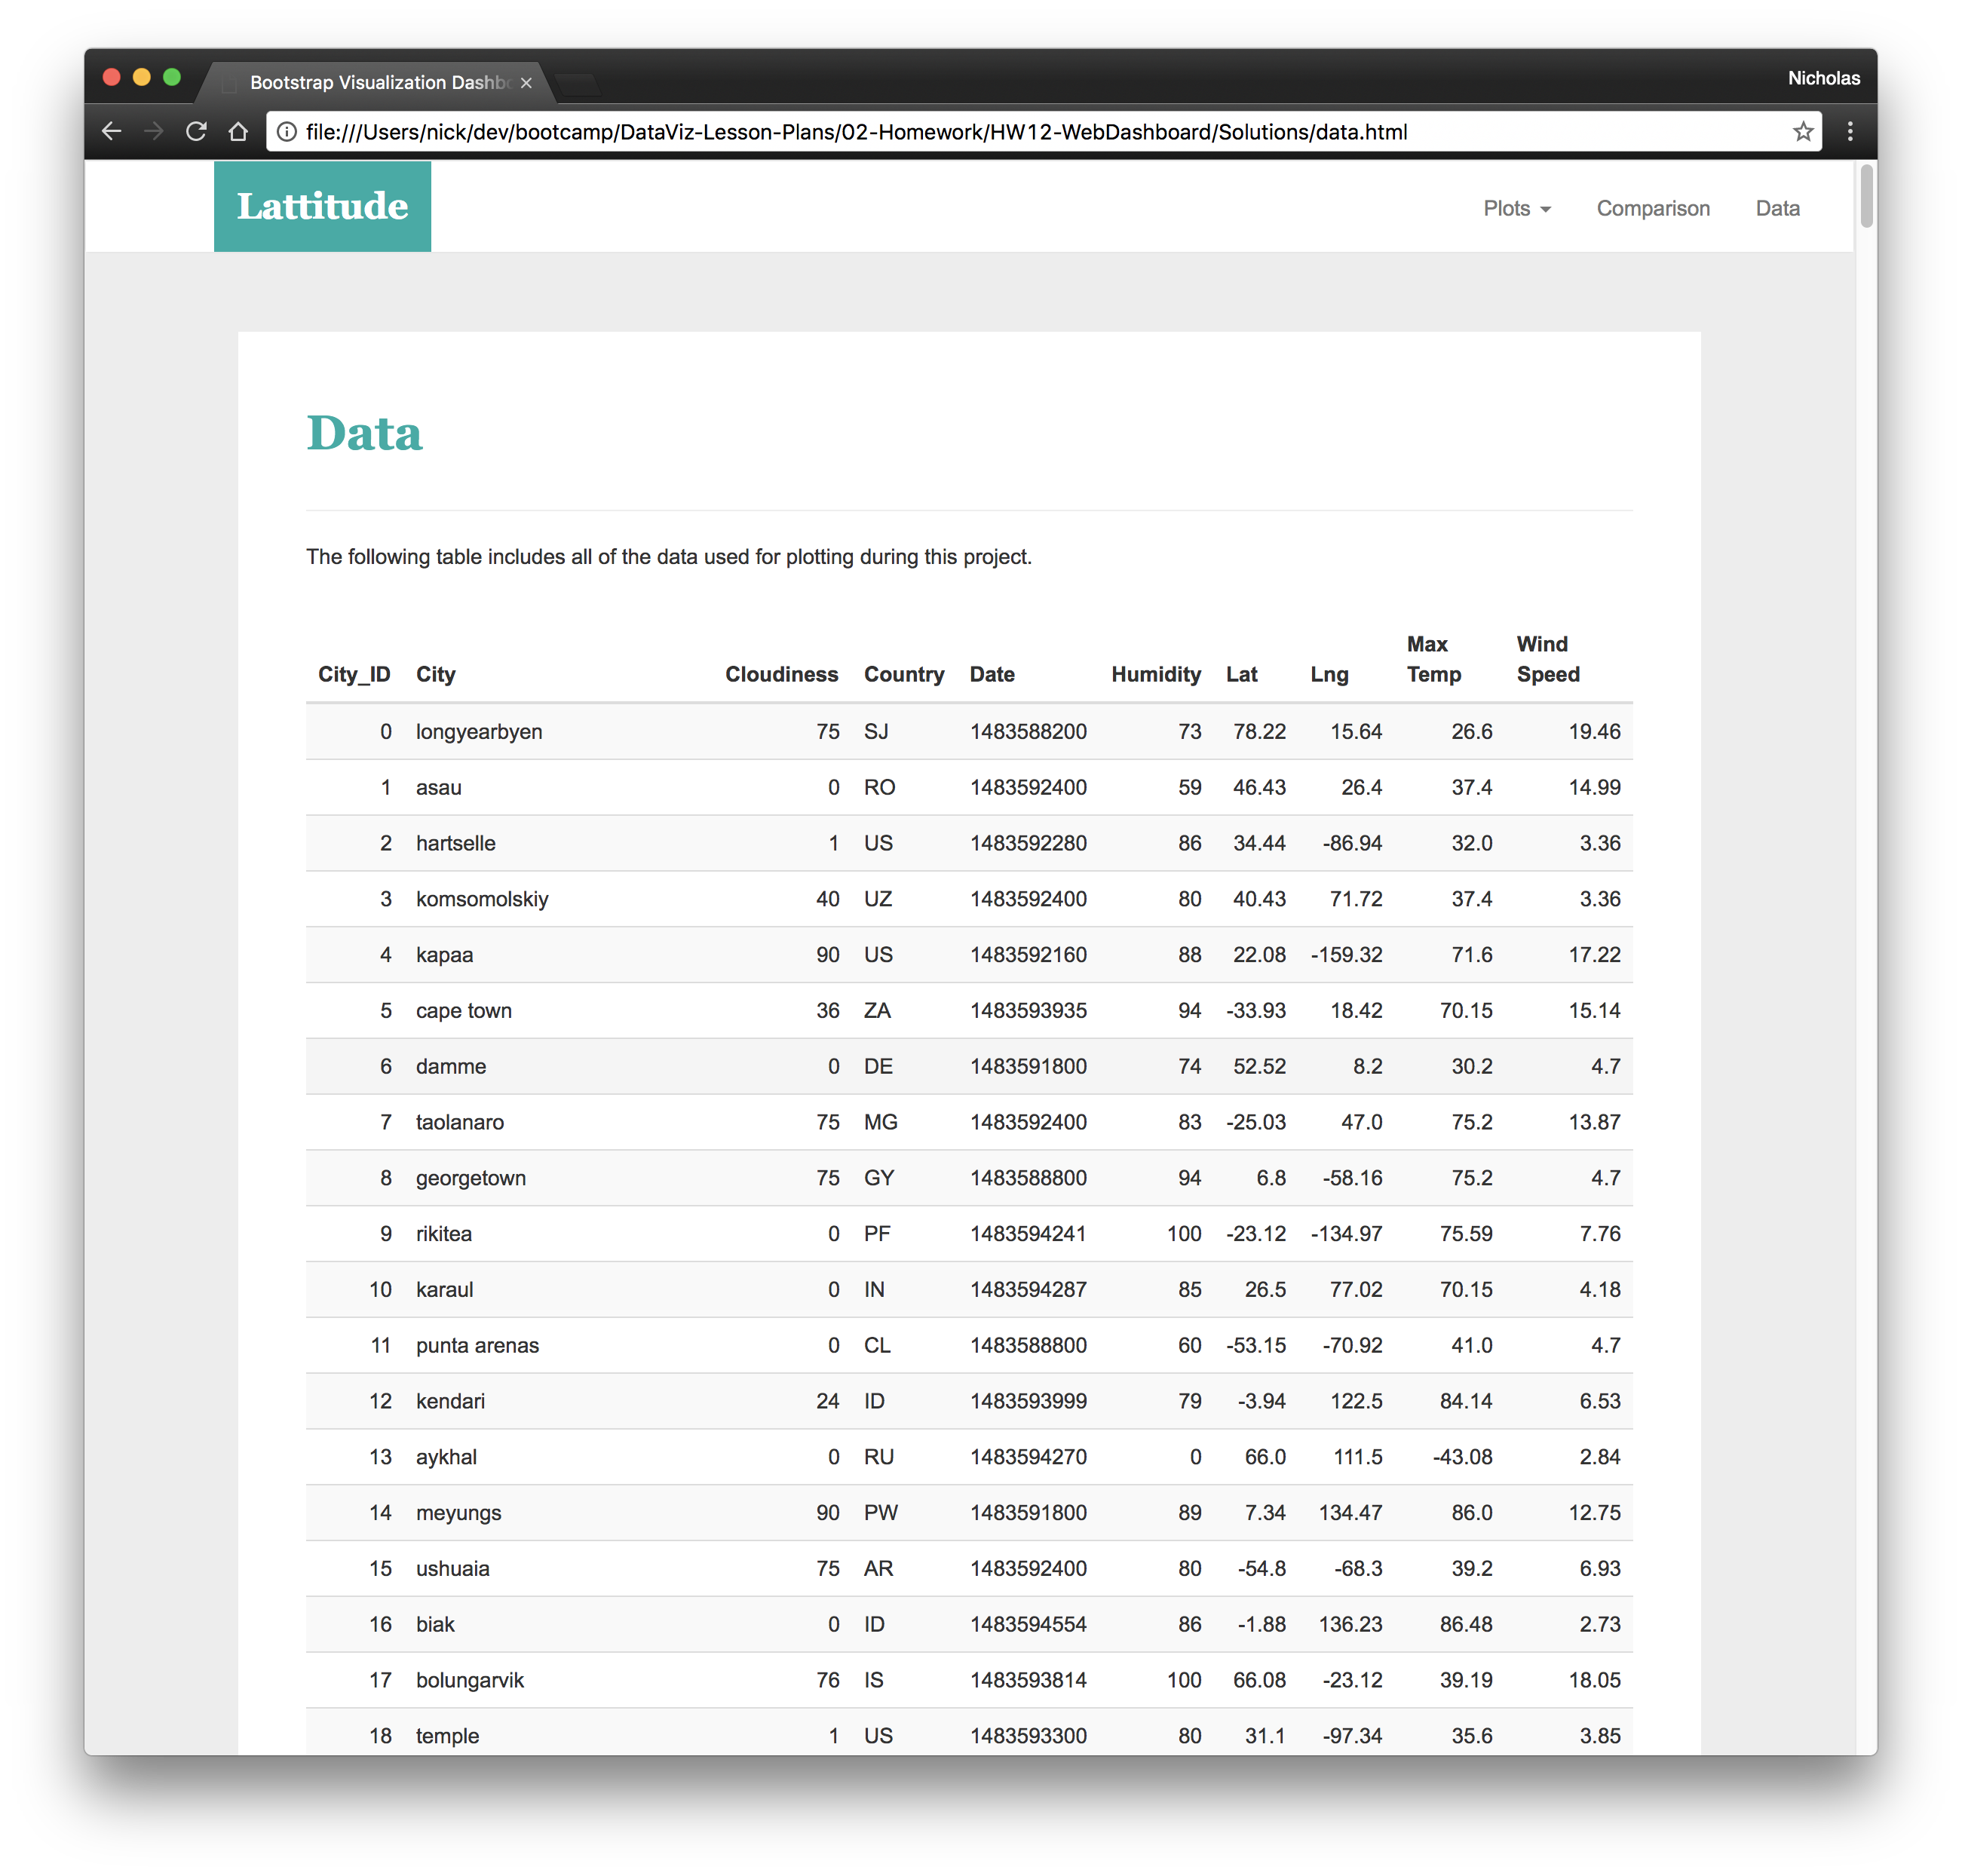
- A data page:
- Displays a responsive table containing the data used in the visualizations.
Each page includes a navigation menu that links to all other pages. All pages are responsive to various screen sizes, aka., mobile friendly.
- Clone this repository
- Open
index.html. The webpage will then display on the browser.
This section contains screenshots of each page.
Here's an example of one:
Data Boot Camp © 2018. All Rights Reserved.


