📕 Übersicht Homepage :pushpin: Übersicht Widgets :page_facing_up: Widgets GitHub Repo
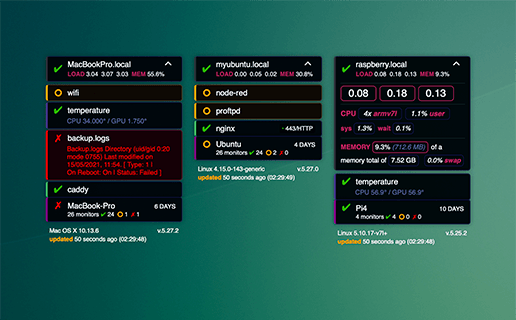
The Widget displays the status of your services monitored with monit on your macOS desktop with Übersicht.
With the json configuration file, you can manage the monit instances, but also define what is displayed, reorganize the services and change some styles of the widget.
| Name | Type | Value | Description |
|---|---|---|---|
| debug | bool/number |
true/false 1 or 2 | output info to the console |
| refreshFrequency | number |
ms | monit data fetch frequency |
| idle | number |
seconds | seconds of inactivity after the widget stop fetching data |
| group | bool |
true/false | experimental: group instances (in array) and display each group alternatively. Caveat: This redraw all the widget each time. |
| curl | string |
path | path to the curl binary |
| instances | array |
instance |
array of instance definition |
| showOk | bool or array |
true/false or array | true to show all ok services or an array of services names or types to show |
| showUnmonitoredInfos | bool/number |
true/false, 1, 2 | show unmonitored services infos, 1 or true for all, 2 for only essential services |
| forceColumn | bool |
true/false | force columns instead of rows when showOk is false |
| top | string |
css value | top position of the widget |
| left | string |
css value | left position of the widget |
| maxWidth | string |
css value | max width of each instance |
| maxHeight | string |
css value | max height of the widget |
| color1 | string |
css color | color used in the header |
| color2 | string |
css color | color used in the system stats |
| programOutputColor | string |
css color | color of the program service type output |
| listBackgroundColor | string |
css color | default list item background color |
| listBorderColor | string |
css color | default list item border color |
| listInfosColor | string |
css color | default service infos color (shown on item click) |
| listCompression | number |
0 to 6 | list vertical spacing |
| unmonitoredServices | object |
- | unmonitored service styles definitions |
| failedServices | object |
- | failed service styles definitions |
| dimOk | bool or string |
false or css color |
css color for ok services |
| ordered | bool |
true/false | reorder services, false to display as is |
| coloredIndicator | bool |
true/false | show color indicator on left side of the service |
| servicesOpts | object |
service type | config for each service type (see below) |
instance
| Name | Type | Value | Description |
|---|---|---|---|
| id | string |
text | instance name (used as id) |
| url | string |
url | complete url to fetch the xml data |
| user | string |
text | basic auth username |
| passwd | string |
text | basic auth password |
| insecure | bool |
- | accept insecure https connection |
| noncritical | array |
- | array of less critical services names shown in different style |
| showStats | bool |
- | auto display system stats |
| enabled | bool |
- | false to disable this instance |
servicesOpts
| Name | Type | Value | Description |
|---|---|---|---|
| key | object |
- | service type |
| p | number |
0 to 7 | service order, use same number to keep the original order |
| c | string |
css color | service type indicator color |
| s | object |
css styles | additional service type style |
{
    "debug": 0,
    "refreshFrequency": 60000,
    "idle": 300,
    "group": false,
    "curl": "/usr/local/opt/curl/bin/curl",
    "instances": [
        {
            "id": "Ubuntu Server",
            "url": "https://monit.myubuntu.tld/_status?format=xml",
            "user": "ubuntu",
            "passwd": "*****",
            "insecure": false,
            "noncritical": ["ftpd"],
            "showStats": false
        },
        [
            {
                "id": "Server 01",
                "url": "https://myserver1.local/monit/_status?format=xml",
                "user": "",
                "passwd": "",
                "insecure": true,
                "noncritical": ["temperature", "nginx"],
            },
            {
                "id": "Server 02",
                "url": "https://myserver2.local/monit/_status?format=xml",
                "user": "",
                "passwd": "",
                "insecure": true,
            },
            {
                "id": "Server 03",
                "url": "https://myserver3.local/monit/_status?format=xml",
                "enabled": false
            },
        ],
        {
            "id": "Raspberry",
            "url": "https://monit.mypi.local/_status?format=xml",
            "user": "pi",
            "passwd": "****",
            "insecure": true
        }
    ],
    "showOk" : [7, "nginx", "temperature", "mysql"],
    "showUnmonitoredInfos": 2,
    "top": "30px",
    "left": "20px",
    "forceColumn": true,
    "maxWidth": "220px",
    "maxHeight": "90vh",
    "color1": "#b7275d",
    "color2": "#c22963",
    "programOutputColor": "#62679f",
    "listBackgroundColor": "rgba(0, 6, 10, 0.98)",
    "listBorderColor": "#1a1748",
    "listInfosColor": "#8e95ce",
    "listCompression": 5,

    "unmonitoredServices": {
        "default": {
            "style": {
                "borderColor": "#8a5c00 #8a5c00 #8a5c00 orange",
                "backgroundColor": "rgba(87, 38, 0, 0.98)"
            },
            "programOutputColor": "orange",
            "listInfosColor": "orange"
        },
        "noncritical": {
            "style": {
                "borderColor": "#4b3621 #4b3621 #4b3621 orange",
                "backgroundColor": "rgba(14,8,4,0.98)"
            },
            "programOutputColor": "orange",
            "listInfosColor": "orange"
        }
    },

    "failedServices": {
        "default": {
            "style": {
                "borderColor": "#560025 #560025 #560025 red",
                "backgroundColor": "rgba(20, 0, 5, 0.99)"
            },
            "programOutputColor": "red",
            "listInfosColor": "red"
        },
        "noncritical": {
            "style": {
                "borderLeftColor": "red",
                "backgroundColor": "rgba(20,0,0,0.98)"
            },
            "programOutputColor": "red",
            "listInfosColor": "red"
        }
    },

    "_dimOk": "#a4a4d6",
    "ordered": true,
    "coloredIndicator": true,
    "servicesOpts": {
        "5": { "p": 0, "c": "#2c2b36", "s": {"marginTop": "0", "marginBottom":"5px"}},
        "8": { "p": 1, "c": "#498152"},
        "0": { "p": 2, "c": "#88786d"},

        "1": { "p": 4, "c": "#3d4c50"},
        "2": { "p": 4, "c": "#3d4c50"},
        "3": { "p": 4, "c": "#4eb668"},
        "4": { "p": 4, "c": "#7169b9"},
        "6": { "p": 4, "c": "brown"},
        "7": { "p": 4, "c": "#453687"}
    }
}Show more info by clicking on a service list item, or open the monit instance page by clicking on the footer.
The widget is written with React. If you show something that can be improved, as it's the first time I use this framework, open an issue.
Things that could be improved:
- Toggle item visibility without refreshing all the widget via AppleScript.
- Groups: Update only what changed.
