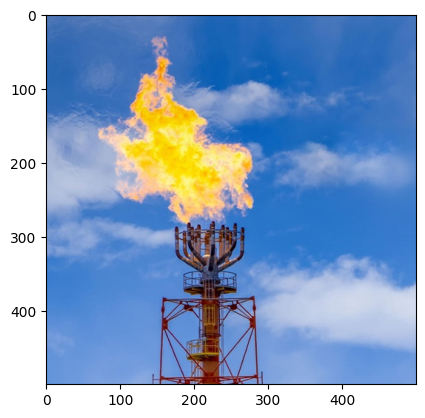
Welcome! this repository contains a notebook to showcase a simple workflow to
calculate the area (in percentage)of a flame at a flare stack by applying KMeans
clustering. The notebook will show an exercise to determine the optimum number
of cluster using scikit-learn KMeans class, and a custom KMeans
clustering model to enable user to select the distance method used to update the
new centroid within each training iterations.
- As the repository is not a Python package, ensure that you already have an environment with your desired Jupyter suite to open the notebook
- The required packages are simple data science libraries. A requirement file is provided should you want to ensure the installation.
pip install -r requirements.txt- The notebook starts with module imports and image loading of
flare_example.jpgwithmatplotlibimage class. The loaded image is then cropped to square and converted to dataframe to ease further processing.
-
A custom transformer is then provided to normalize the RGB values in the dataframe to 0-1 by dividing it with 255 (the largest pixel value possible). This step can be beneficial to provide equal weighting of features (if one channel has a much larger values than others, it might dominate the distance calculation, leading to biased clustering), improved convergence, and interpretability
-
The custom transformer is then combined in a pipeline with
KMeansto sensitize optimum number of cluster using elbow plot and domain judgement.
With the result above, it is safe to say that 4 clusters would be a sufficient number to distinguish the flame at the flare stack
- As we know, the way KMeans updates its clusters assignment is by firstly
calculating the distance between each point and the cluster center. This
distance itself is something to be sensitized on and can provide better result
if tuned from the default one in
KMeansclass. Since the implementation to select other distance type is not provided, a custom KMeans class is provided in the notebook that have this hyperparameter available to be tuned.
a. Euclidean Distance: Often referred as the "ordinary" distance, it is the
length of the straight line between two points in Euclidean space.
b. Manhatttan Distance: Known as the "taxicab" or "city block" distance. It's
the sum of the absolute differences of their Cartesian coordinates.
c. Chebyshev Distance: A metric defined on a vector space where the distance
between two vectors is the greatest of their differences along any coordinate
dimension.
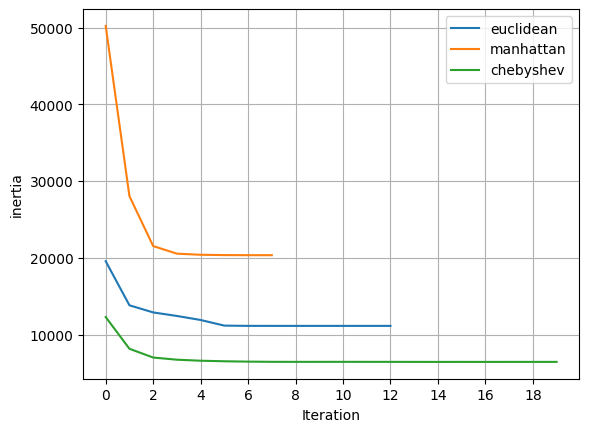
If we plot the inertia (within-cluster sum of squares) that measures the compactness of each cluster of each distances. We would know that Euclidean and Chebyshev distance is better compared to Manhattan in this case. But seeing from a metric is not enough to tell the most suitable solution.
The image above shows the Silhouette score (representation of how well each object lies within its cluster. It lies from -1 to 1, where a high value indicates that the object is well matched to its own cluster and poorly matched to neighboring clusters). From the Silhouette score, it is known that the performance between Chebyshev and Euclidean are similarly good, but from the plots, we would know that the Chebyshev distance might have some over-estimation as some parts of the flare rig are considered as the same cluster as the flame.
This workflow can be replicated to your flare-monitoring image, and deployed to automate the flare monitoring process. By monitoring the flare stacks, you can quickly identify abnormal conditions, such as an unexpected change in flame size or pattern, which could indicate safety issues. Further development could be the construction of other algorithm to calculate the flare gas flowrate from the flame size. An integration to alert system is also something noteworthy, as it ensures immediate response to potential issues.
All in all, an automated system reduces the need for continuous human supervision, potentially decreasing monitoring costs, and enabling preventive maintenance that will enhance equipment lifetime.
-
Rozanov, A. (2024, March 15). Semantic Segmentation of Remote Sensing Imagery using k-Means. Towards Data Science. Retrieved from https://towardsdatascience.com/semantic-segmentation-of-remote-sensing-imagery-using-k-means-e4c165d9218e
-
scikit-learn developers. (n.d.). sklearn.metrics.silhouette_score. scikit-learn. Retrieved from https://scikit-learn.org/stable/modules/generated/sklearn.metrics.silhouette_score.html#sklearn.metrics.silhouette_score


