HR Visualizer
Opened this issue · 0 comments
tangyefei commented
Introduction
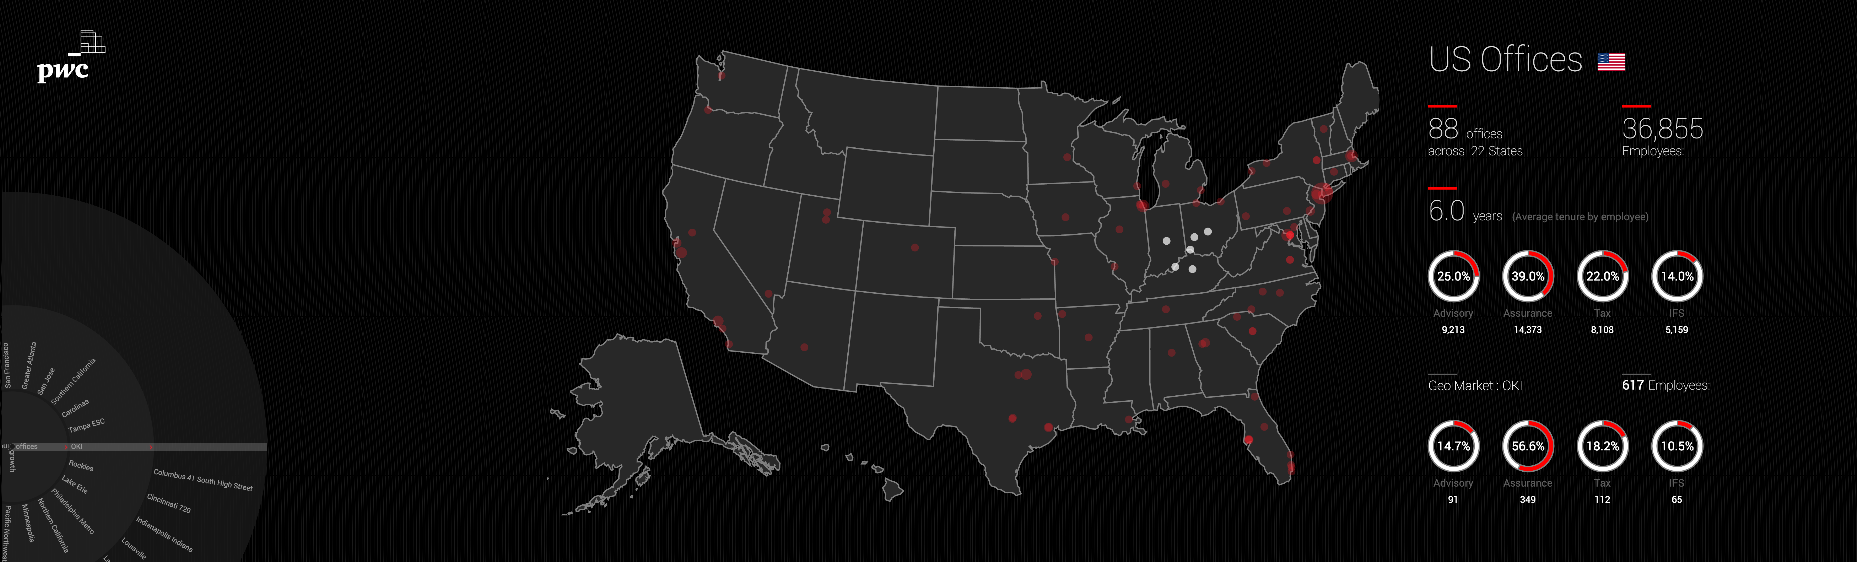


HR Visualizer is a large-scale data visualization platform for exploring data, collaborating with business leaders, and facilitating data-driven decision making.
Features
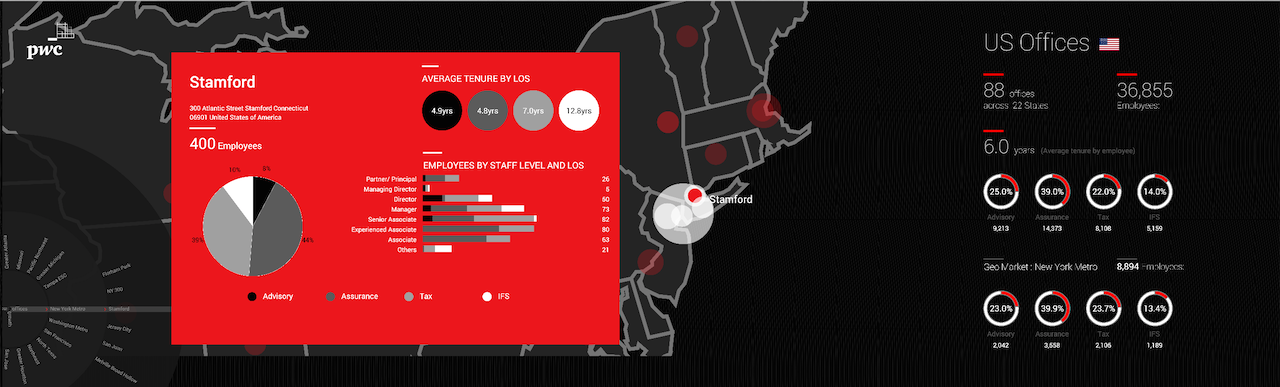
- It provide three dimension for analysis for PWC US statistics: office, growth, industries.
- Charts, maps and animated navigation help user easily switch between dimension so they can focus on what they are really interested in.
Technologies
- AnyLogic - A simulation tool that supports all the most common simulation methodologies in place today: System Dynamics, Process-centric (AKA Discrete Event), and Agent Based modeling.
The unique flexibility of the modeling language enables the user to capture the complexity and heterogeneity of business, economic and social systems to any desired level of detail. - Ruby on Rails - A dynamic, interpreted, open source programming language with a focus on simplicity and productivity, with an universal adoption web framework
- PostgreSQL - A popular open source relational database for storing the system data. e.g. user info, role, organization, etc. which could be seamless integrated with Rails ORM modules in Ruby.
- D3.JS - A JavaScript library for manipulating documents based on data. D3 helps bring data to life using HTML, SVG and CSS. D3’s emphasis on web standards gives the full capabilities of modern browsers without tying to a proprietary framework, combining powerful visualization components and a data-driven approach to DOM manipulation.