Brand Graph
Opened this issue · 0 comments

Table of Contents
Introduction
BrandGraph is a web application that can be used to display relationships between brands. By analyzing brands data, user can have a intuitive understanding about the brand scale, similarity, business intersection.
About This Document
We create this document as some kind of conclusion so that we can easily pick it up when we need it in a new project.
Features
- Provide both desktop and wall version, user can use it both on browser and high solution device(7100*2160).
- Provide multiple query dimension(brands, categories) and filters.
- Provide a lot of graph parameters, which means all nodes, edges, text and even animation could been changed dynamically.
Used Technologys
- HTML/CSS/JavaScript
- Neo4j the world’s leading graph database
- Flask a microframework for Python based on Werkzeug, Jinja2
- AngularJS a popular structural framework for dynamic web apps
- Other Tools
How to Run
BrandGraph's code was hosted on Github, you can config on your local environment according to the README. Or you can directly visit the deployed version on Heroku.
Core Implementation
Architecture
-
Dev Architecture:
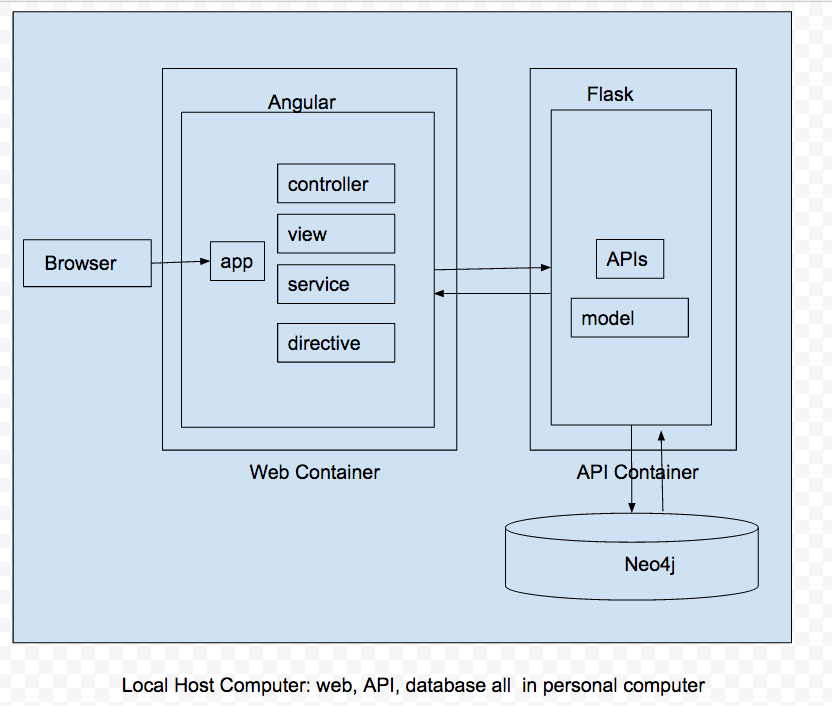
-
Deployed Architecture:
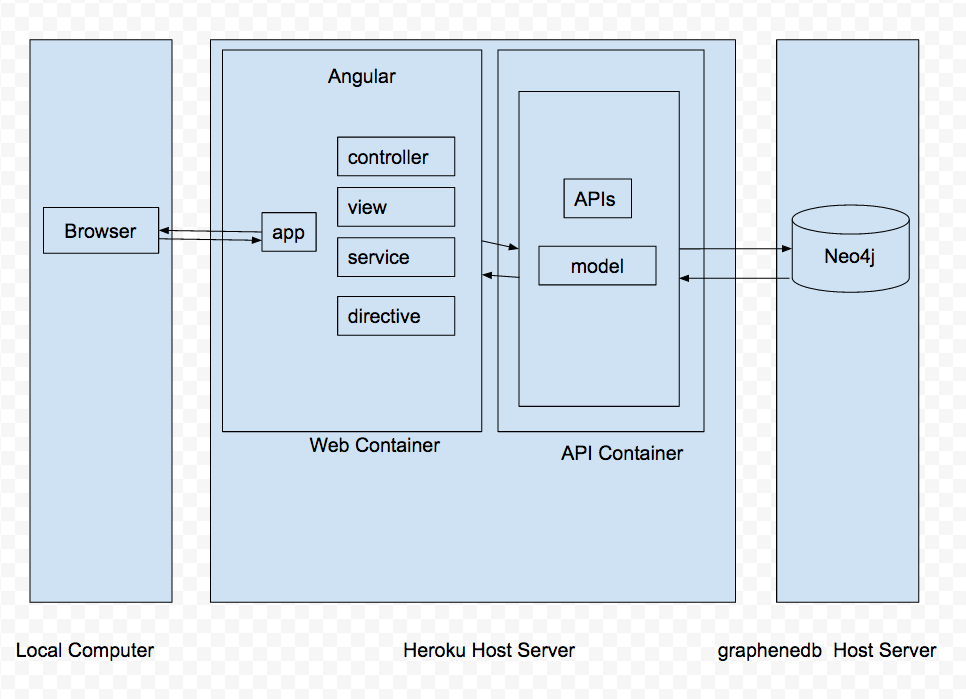
Database: Neo4j
We use Neo4j as database, you can download it or refer to BrandGraph README's concerned step: "db environment" .
_Note:_ As the environment was ran locally, when we create connection in code just provide a database file location would be enough. But if it was on a remote server, we may need to add username and password for access.
Server: Flask
Prepare Python and Flask
Make sure you have installed Python and Flask, if not please refer to the BrandGraph README's concerned part "server environment" and make sure your environment right configured. After all that, let's get started to do source code analysis!
Application Structure
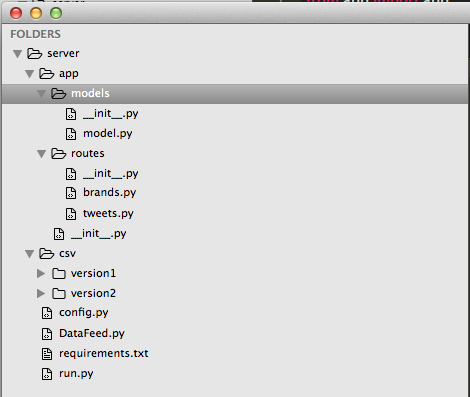
- config.py: common used variables defined
- DataFeed.py: database initialization
- csv: data orignal files location
- app/init.py: application entrance, flask instance created here
- app/routes: APIs defined
- app/models: database querying, would been called by routes
Datafeed
We feed data with command python DataFeed.py which would read csv files and insert them into database. Below will focus on DataFeed.py code fragment. First, import packages would been used:
/brand_graph/server/DataFeed.py
# ...

'''
py2neo: a external python package used to integrate with neo4j
csv and system: python build-in module used for file read).
'''

from py2neo import neo4j, Graph, Node, Relationship
import csv
import sys
from config import NEO4J_DB_ADDR
# ...
As there are some system environment would be used more than one time, we recommand to write all them in to one file:
/brand_graph/server/config.py
#...
NEO4J_DB_ADDR = "http://localhost:7474/db/data/"
#...
Then we can create the database instance and batch writer, remember to empty the database to prevent data duplicate.
/brand_graph/server/DataFeed.py
graph = Graph(NEO4J_DB_ADDR)
graph.delete_all()
batch = neo4j.WriteBatch(graph)
After create connection, we need to initialize the database structure:
- Create nodes: loop modularity.csv we get attributes and produce brand, add it to batch writer and submit the batch into Neo4j.
- Increase features: loop twitter.csv and get more detailed brand features, query the concerned brand and update it with new features.
- Build connections: loop melt.csv and build the realationship between different brands.
Below is the code of first step:
/brand_graph/server/DataFeed.py
nodes_file = open(pathCSV + 'modularity.csv', "rb")

 # skip the header line because the csv file contains attribute name header
reader = csv.reader(nodes_file)
next(reader, None)

for id, name, group, page_rank in reader:
    index = index + 1
    brand = batch.create(Node(name= name.strip().lower(), group= group))
    batch.set_labels(brand, 'Brand')
    batch.submit()
Define Route
There are three APIs been used in BrandGraph, they are list below:
| Name | Method | URL |
|---|---|---|
| get all brands | GET | /brand_graph/api/v1.0/brands |
| get the brand with specified name | GET | /brand_graph/api/v1.0/brands/string:brandname |
| get the category with specified name | GET | /brand_graph/api/v1.0/category/string:categoryname |
Here is the fragment of get all brands API:
/brand_graph/server/app/routes/brands.py
import json
from flask.ext.cors import CORS, cross_origin
from app.models.model import Brand
from app import app

brandModel = Brand()

@cross_origin(origin='*', methods=['GET', 'POST', 'OPTIONS'], headers=['X-Requested-With', 'Content-Type', 'Origin'])
@app.route('/brand_graph/api/v1.0/brands',methods=['GET'])
def get_brands():
    brands = brandModel.get_all()
    return json.dumps(brands)
There are some tips need to be noticed when format an API in Flask:
- Flask API is decorated with @app.route. The
appis the Flask application instance imported from entrance module _brand_graph/server/init.py_. - As our web and server are hosted in different container, we must add @corss_origin decorator.
- The data access process belong to model, so we abstract all the query process in model Brands.
Query Database
The model.py contains both query methods and data formated methods. Here we just try to explain how we use py2neo query the database and obtain the data we want.
Of course the first step is new the database instance:
/brand_graph/server/app/models/model.py
from py2neo import Graph
from config import NEO4J_DB_ADDR

graph = Graph(NEO4J_DB_ADDR)
Then we would define our class Brand and format the get_all methods structure:
/brand_graph/server/app/models/model.py
#...

class Brand(object):
    def get_all(self):
        nodes, edges, names, results_nodes = [], [], set(), {}
        try:
            # query loic code here
        except:
            pass
        return brands_results

#...
The Neo4j cypher is a querying language which can let us execute the SQL directly, below is the logic how we use graph.cypher to query and format response with customized method mapping_node:
#...

class Brand(object):
    def get_all(self):

        #...

        query_nodes = "MATCH (n:Brand) WHERE exists(n.company) RETURN n.name, n.group, n.company, n.followers"
        results_nodes = graph.cypher.execute(query_nodes)

        for rec in results_nodes.records:
            name, group, company, followers = rec['n.name'], rec['n.group'], rec['n.company'], rec['n.followers']
            node = self.mapping_node(name, group, company, followers)
            nodes.append(node)

        # same-like edges query and format logic here


        nodes = sorted(nodes, key=itemgetter("followers"), reverse=True) # nodes sort decending by followers

        brands_results = {  'nodes': nodes, 'edges': edges, 'industries': self.mapping_industries()}

        #...
Web: AngularJS
Application Structure
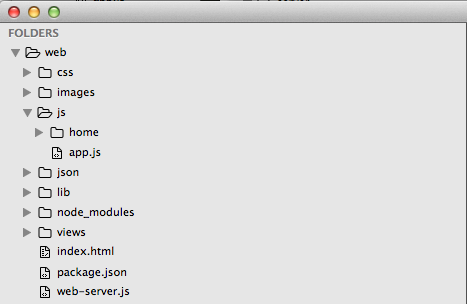
- web-server.js: used to produce a web container
- requirements.txt: contains packages would been used by grunt tasks
- index.html: home page
- node_modules: where packages installed
- css/js/images/libs/json: as it described
User Cases
- Show Brands
- By default we would show all brands
- User can search by brand name, category name
- User can click on brand and show top 10 concerned brands
- Filters
- Can set the tweets followers as filter
- Setting
- Simple setting: graph edge, node and text visible, animation toggle, etc.
- Advanced setting: more setting about graph
How to Integrate Sigma.js with Angular.js
Sigma.js is a Javascript library dedicated to graph drawing, for low coupling and better reusability, we write all graph-drawing code in service.js. You just need to define methods in service.js and expose methods as public.
/brand_graph/web/js/home/service.js
angular.module('brand_graph')
  .factory('sigma', ['$rootScope', function($rootScope) {

    var sigmaExport = {}, sigmaInstance;


    var _draw = function() {
        // ...
    }

    var _initInstance = function() {
        // ...
    }

    _initInstance();

    sigmaExport.s = sigmaInstance;
    sigmaExport.s.draw = _draw;;

    return sigmaExport;
}]);
/brand_graph/web/js/home/home-controller.js
angular.module('brand_graph')
  .controller('HomeController', ['$scope', 'sigma', function ($scope, sigma) {

    // ...

    sigma.s.draw(); // use sigma serive exposed function directly

    // ...
}]);
Use Sigma.js
Steps to Draw Graph
- Create sigma instance with a container id and default setting
sigmaInstance = new sigma({
    container: 'graphContainer',
        renderer: {
            container: document.getElementById('graphContainer'),
            type: 'canvas'
        },
    settings: defaults
});
-
Draw Graph with Data
sigmaInstance.graph.read(data);
sigmaInstance.refresh();
sigmaInstance.startForceAtlas2(force);
There are something need to be noticed:
- The data's structure must satisfied some mode so that they could be known.
- After read the data, you can still adjust nodes and edges before final refresh and drawing. Just loop the
sigmaInstance.graph.nodes()orsigmaInstance.graph.edges() - Both defaults and force variable are the paramters would been used for graph drawing, you could refer to the official site for optional paramters.
Redraw the Graph
If you need to refresh the graph with another bunch data, remember to do the kill and clear before draw again:
    sigmaInstance.killForceAtlas2();
    sigmaInstance.graph.clear();
    // draw steps in previous part
How to Hide or Show Nodes
Loop the nodes and edges, you can determine their visibility with yourself's logic.
sigmaInstance.graph.nodes().forEach(function(n) {

    var flag = NODE_SHOW_OR_HIDE_LOGIC_FUNC(n);

    // we have saved the original color, label, size for setting back use
    // set the color as transparent for hiding purpose

    n.color = flag ? n.originalColor : inactiveColor;
    n.size = flag ? n.originalSize * 2 : n.originalSize;
    n.label = flag ? n.originalLabel : '';
});

sigmaInstance.graph.edges().forEach(function(e) {
    var flag = EDGE_SHOW_OR_HIDE_LOGIC_FUNC(e);
    e.color = flag ? e.originalColor : inactiveColor;
    e.size = flag ? e.originalSize * 2 : e.originalSize;
});

sigmaInstance.refresh();
How to Place Nodes Around and Recover
There is a requirement in our project: once you click on brands, place all concerned top 10 brands around it and hide the rest. What we gonna todo is change all nodes' visbible and coordinates(x, y) attributes:
/brand_graph/web/js/home/service.js
var placeAround = function(nodeId) {

    sigmaInstance.stopForceAtlas2();

    // connects is a tool method defined to get all connected nodes
    var activeHash = sigmaInstance.graph.connects(nodeId);

    activeHash[nodeId] = {};

    var activeNum = _.keys(activeHash).length;
    var radius = 1, i = 0;

    // calcuate the max x to determine the round circle
    sigmaInstance.graph.nodes().forEach(function(n) {
        if (radius < n.x) radius = n.x;
    });

    sigmaInstance.graph.nodes().forEach(function(n) {
        n.originalX = n.x;
        n.originalY = n.y;
        if (n.id === nodeId) { // clicked node
            n.x = 0;
            n.y = 0;
        }
        else if (activeHash[n.id]) { // concerned nodes
            n.x = Math.cos(Math.PI * 2 * i / (activeNum - 1)) * radius * 0.7;
            n.y = Math.sin(Math.PI * 2 * i / (activeNum - 1)) * radius * 0.7;
            i ++;
        }
    });

    sigmaInstance.refresh();
}
Other Widgets been Used
To provide the user with toggle and filter function, we use different widgets, here we would make brief introduction.
Filter: ion.rangeSlider
Sigma.js provide a lot of parameters for size, color and animation setting. By using ion.rangeSlider we can detect the paramteter value changing and trigger sigma redraw. Here is a slider example:
/brand_graph/web/views/components/forceComponent.html
<input id="slider-gravity" />
/brand_graphp/web/js/home/directives.js
$("#slider-gravity").ionRangeSlider({
    min: 0,
    max: 10,
    from: scope.getSigmaForce('gravity'), // value could be a calculated result
    type: 'single',
    step: 0.1,
    onFinish: function(obj) {
        // execute the simag redraw function
    }
});
Toggle: bootstrap toggle
It's not included in bootstrap or bootstrap-tpls, so you have to download and import the bootstrap-toggle before using. After that you can define the input element as checkbox type with data-toggle attribute and bind on/off events on it.
/brand_graphp/web/views/components/forceComponent.html
<input id="linLogMode-button" type="checkbox" data-toggle="toggle">
/brand_graphp/web/js/home/directives.js
$('#linLogMode-button').bootstrapToggle('on').change(function() {
    // trigger the sigma.js drawing function
});
End