Divvy
Opened this issue · 0 comments
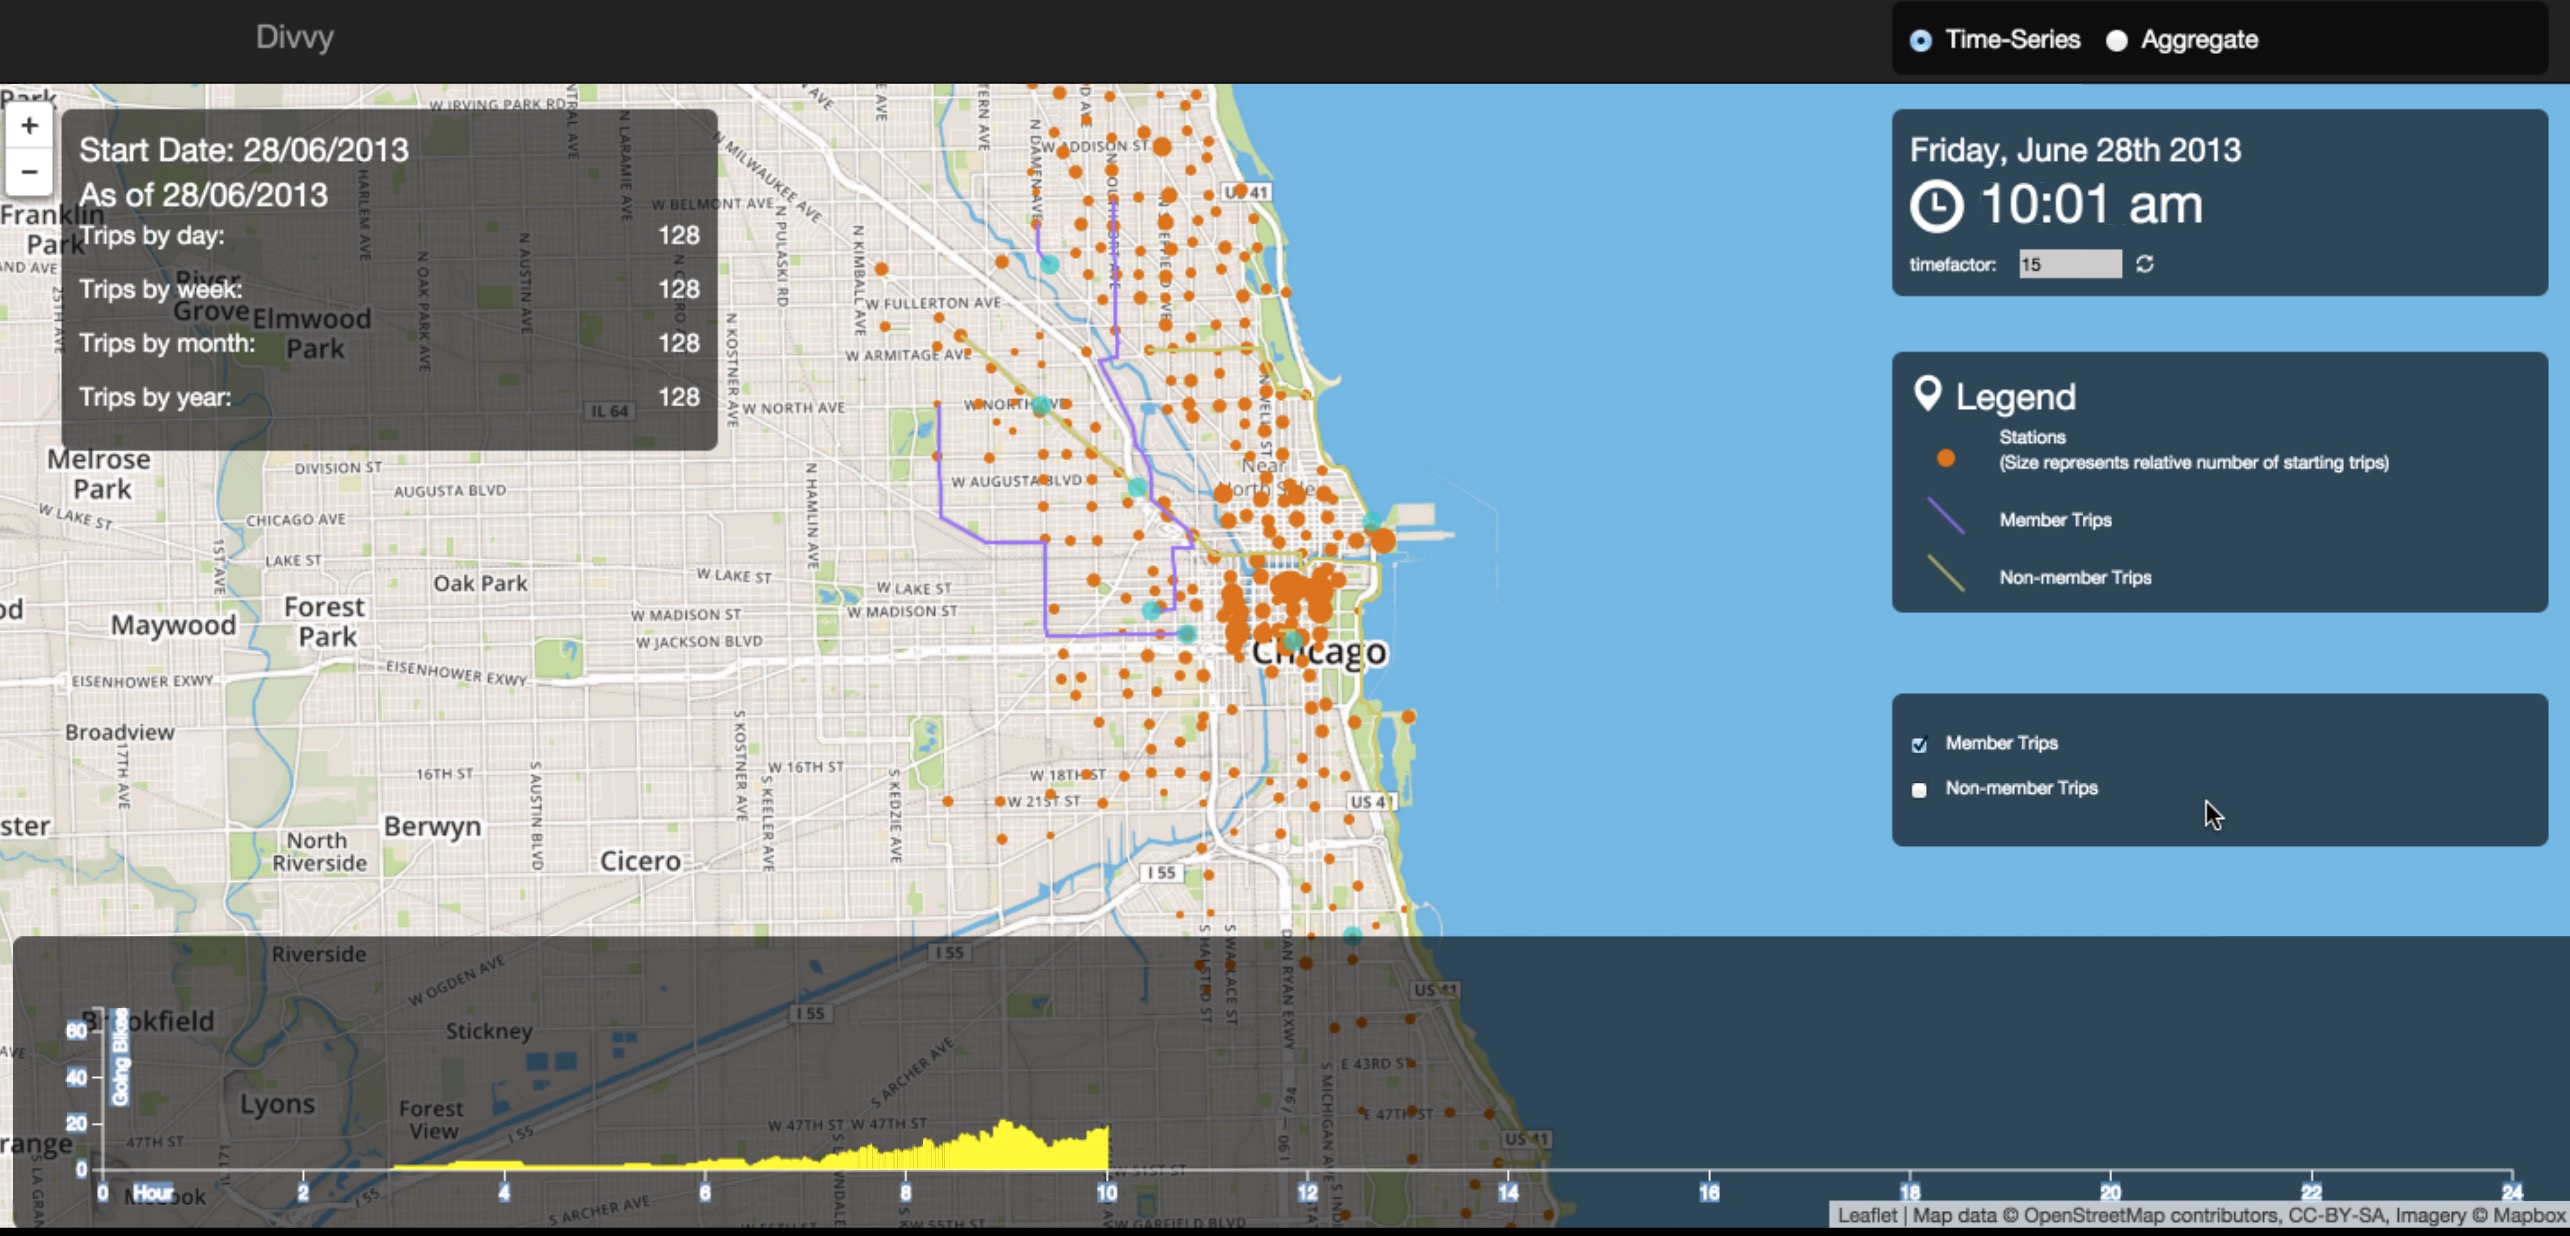
Table of Contents
Introduction
Divvy is a web application that is used to display bike trips for Chicago bike loan project. It monitors every bike's trip in both time-series mode and aggregate mode, provides friendly graphs to display all trips, stations, routes and their relations according to real time.
About This Document
We create this document as some kind of conclusion so that we can easily pick it up when we need it in a new project.
Features
- Provide both time-series and aggregate modes to display bike trips.
- Provide time filter to display trips during a specified period .
- Provide friendly graphic user interface for users.
Used Technologies
- HTML/CSS/JavaScript
- MongoDB the world’s leading NoSQL database
- Redis An open source (BSD licensed), in-memory data structure store, used as database, cache and message broker
- Flask a microframework for Python based on Werkzeug, Jinja2
- AngularJS a popular structural framework for dynamic web apps
- Other Tools
- D3.js a JavaScript library for visualizing data with HTML, SVG, and CSS
- Mapbox An open source mapping platform for custom designed maps
- Leaflet A lightweight yet robust library for interactive maps
- Yeoman web application scaffolding tool
- Git / Github version control tool and platform
- Heroku a cloud Platform-as-a-Service supporting several programming languages
How to Run
Divvy's code was hosted on Github, you can config on your local environment according to the README. Or you can directly visit the deployed version on Heroku.
Core Implementation
Architecture
-
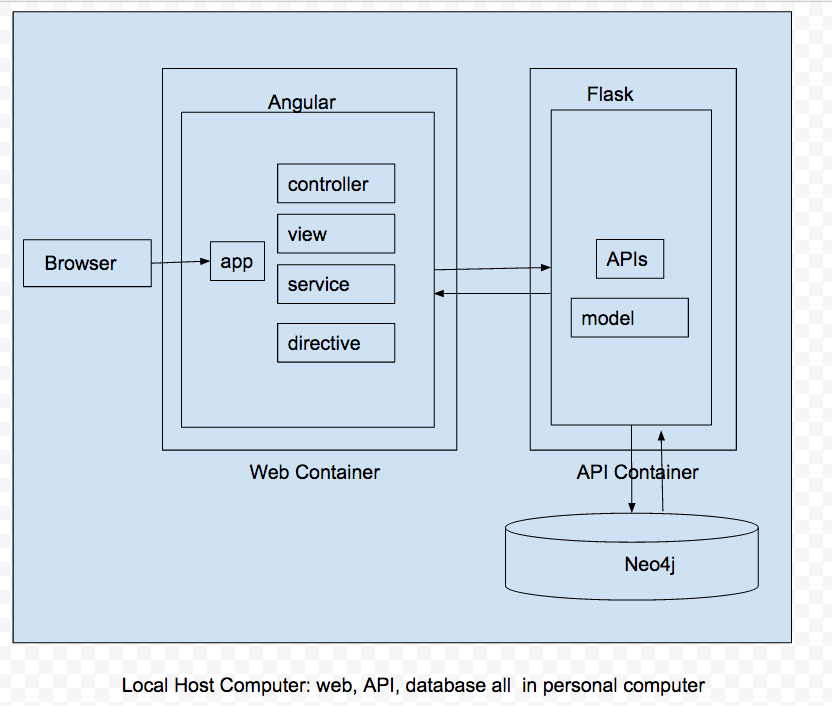
Dev Architecture:
-
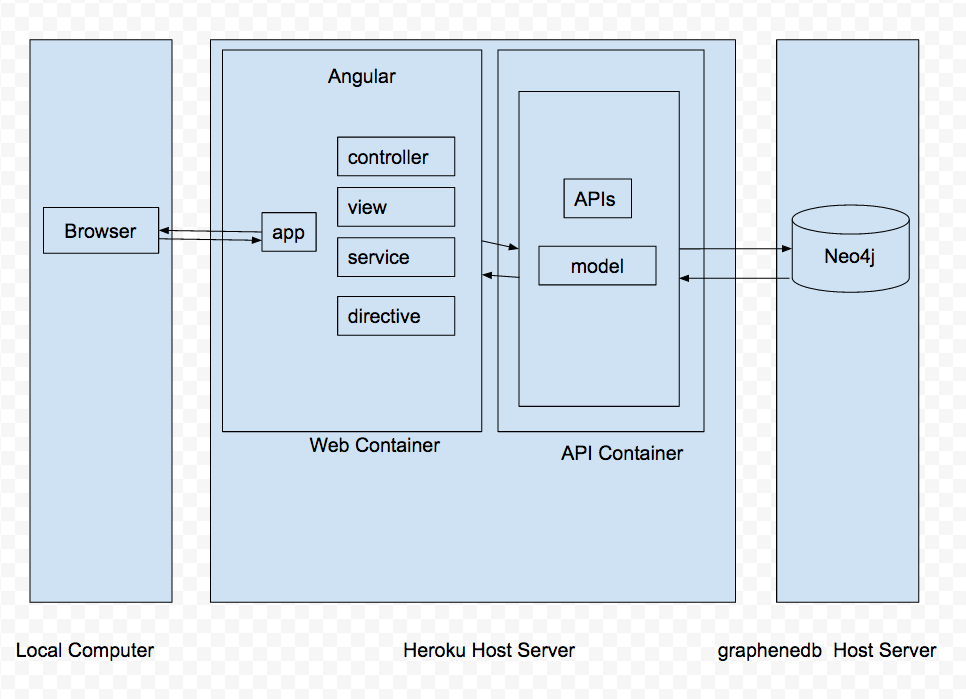
Deployed Architecture:
Database: MongoDB
We use MongoDB as database, you can download it.
_Note:_ As the environment is set locally, when we create connection in code just provide a database file location would be enough. But if it was on a remote server, we may need to add username and password for access.
Big Data Cache: Redis
Divvy needs to fetch almost 1 million records from database, this action will spends several minutes. So we should find a solution to reduce fetch time. In our case, we use Redis. Redis is an open source, in-memory data structure store, used as database, cache and message broker. You can download it or visit the github page
Server: Flask
Prepare Python and Flask
Make sure you have installed Python and Flask, if not please follow the instructions below to make sure your environment right configured.
- Install anaconda: http://continuum.io/downloads

- Install pip: https://pip.pypa.io/en/latest/installing.html

- Install Flask

    `$ pip install Flask --upgrade`

- Install Flask Extensions

    `$ pip install Flask-SQLAlchemy --upgrade`

    `$ pip install -U flask-cors --upgrade`

    `$ pip install pymongo --upgrade`

    `$ pip install redis --upgrade`
After all that, let's get started to do source code analysis!
Application Structure
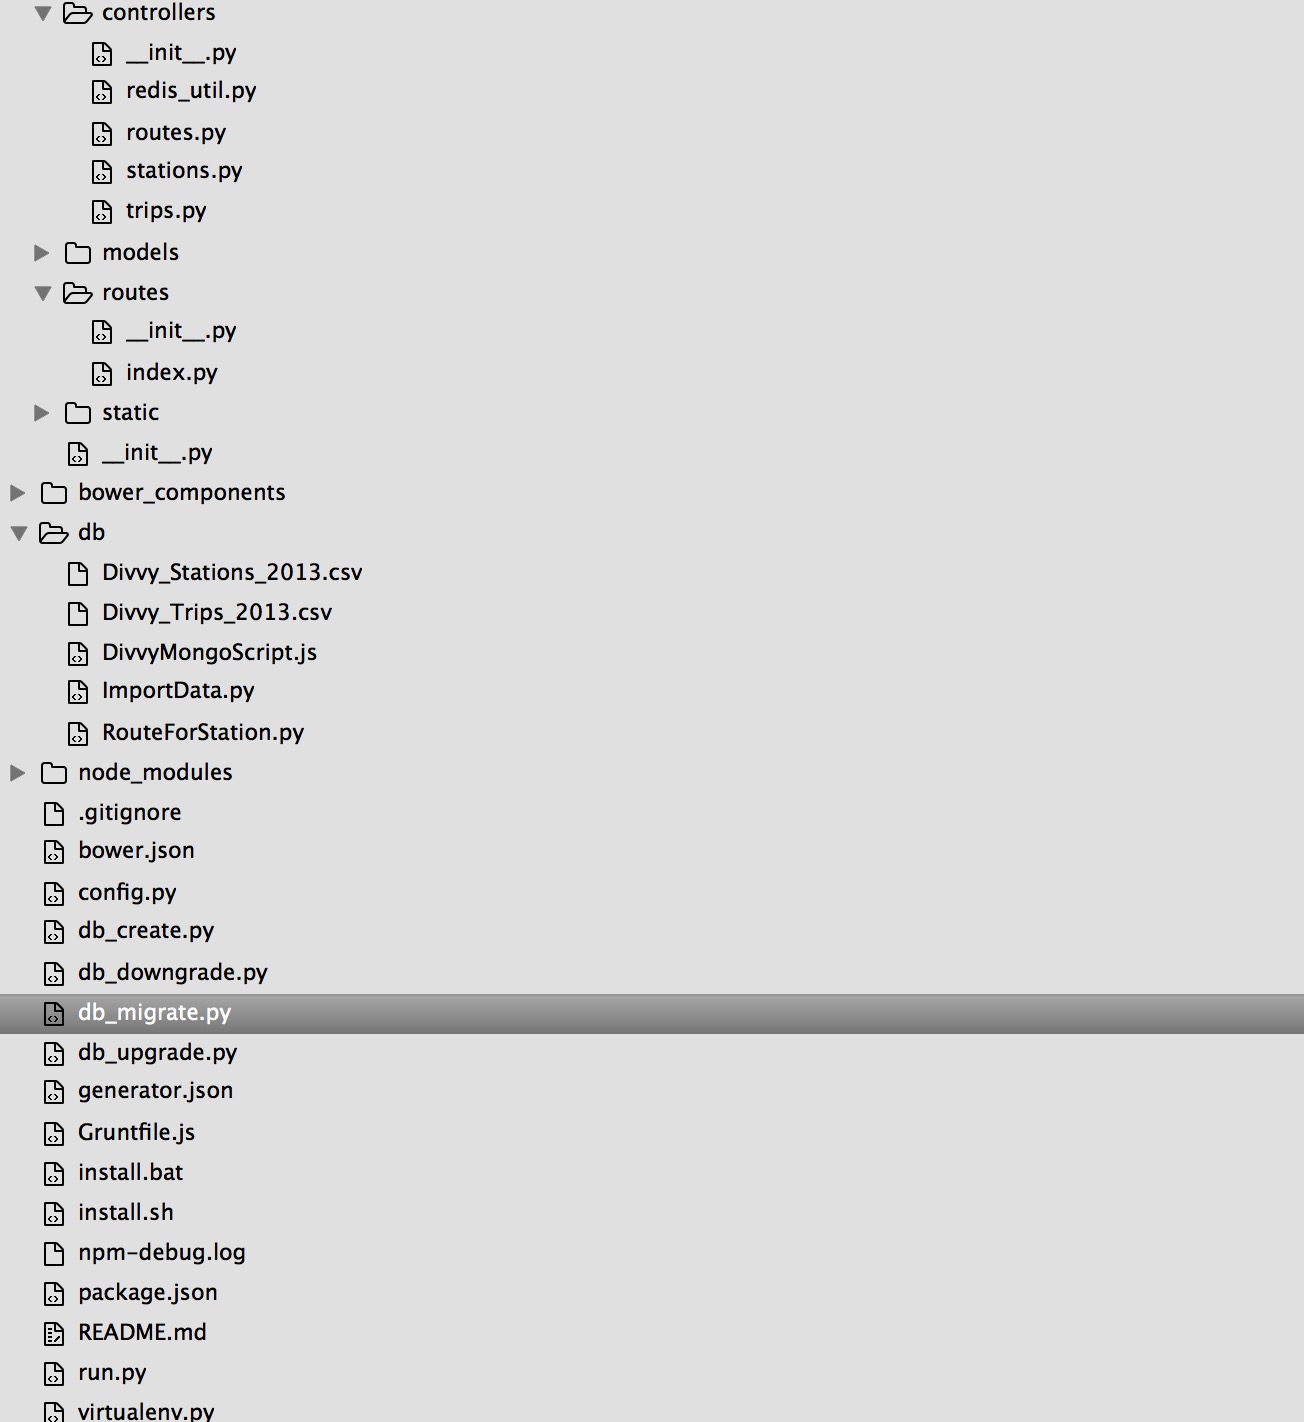
- config.py: common used variables defined
- db/csv: data original files location
- csv/py&js: database feed
- app/init.py: application entrance, flask instance created here
- app/routes&controllers: APIs defined
- run.py: application launcher
Datafeed
We feed data with ImportData.py located in db folder which reads csv files and insert them into database. Let's focus on this file. First, import packages:
/divvy/db/ImportData.py
# ...

'''
pymongo: a external python package used to interact with mongodb
csv and sys: python build-in module used for file read).
'''

import csv
import sys
import pymongo
# ...
Then we create the database instance, remember to flush the database to prevent data duplicate.
/divvy/db/ImportData.py
client = MongoClient('localhost', 27017)
db = client.Divvy

if "Stations" in sys.argv[1]:
    db.stations.drop()
    DataSets = db.stations

elif "Trips" in sys.argv[1]:
    db.trips.drop()
    DataSets = db.trips
After creating connection and flushing database, we read the csv file and insert data into database:
/divvy/db/ImportData.py
with open(sys.argv[1]) as csvfile:
    DataHash = csv.DictReader(csvfile)
    DataSets.insert(DataHash)
Finally, in order to import data using ImportData.py and csv files, we run some commands in terminal which is described in Run part of README.md:
/divvy/README.md
python ImportData.py Divvy_Stations_2013.csv
python ImportData.py Divvy_Trips_2013.csv
After Importing Stations and Trips data into database, we create Routes data using RouteForStation.py, below is the core code of this file:
client = MongoClient('localhost', 27017)
db = client.Divvy

db.routes.drop()
Routes = db.routes

Stations = db.stations.find()
for start_station in Stations:
    Stations_copy = db.stations.find()
    for end_station in Stations_copy:
        if end_station['id'] != start_station['id']:
            RouteHash = {
                'id':id,
                'from_station':str(start_station['id']),
                'from_station_longitude':float(start_station['longitude']),
                'from_station_latitude':float(start_station['latitude']),
                'to_station':str(end_station['id']),
                'to_station_longitude':float(end_station['longitude']),
                'to_station_latitude':float(end_station['latitude']),
                'geo_data':{}
            }
            id += 1
            Routes.insert(RouteHash)
In order to execute this file, we also need to run it by a command below:
python RouteForStation.py
Define Route
There are APIs used in Divvy, they are list below:
| Name | Method | URL |
|---|---|---|
| get all stations | GET | /divvy/api/v1.0/stations |
| get a certain station by id | GET | /divvy/api/v1.0/stations/id=5 |
| get all trips | GET | /divvy/api/v1.0/trips |
| get certain trips of a bike by bikeid | GET | /divvy/api/v1.0/trips/bikeid=1 |
| get the time recorder service of trips | GET | /divvy/api/v1.0/trips/timerecorder |
| get the date filter service of trips | GET | /divvy/api/v1.0/trips/date=[year]-[month]-[day] [hour]:[minute] |
| get the date range filter service of trips | GET | /divvy/api/v1.0/trips/startdate=[year]-[month]-[day]&&enddate=[year]-[month]-[day] |
| get the user type filter service of trips | GET | /divvy/api/v1.0/trips/usertype=member' or 'http://localhost:5000/divvy/api/v1.0/trips/usertype=nonmember |
| get the data range and station filter of trips | GET | /divvy/api/v1.0/trips/originDate=[year]-[month]-[day]&&arrivalDate=[year]-[month]-[day]&&stationID=[station ID]] |
| get all routes | GET | /divvy/api/v1.0/routes |
| get a set of routes | GET | /divvy/api/v1.0/routes/start=0&end=99 |
Here is the fragment of get all stations API:
/divvy/app/controllers/stations.py
def save_to_redis():
    if r.exists('stations') is False:
        print 'start saving stations into redis->' + datetime.now().strftime('%Y-%m-%d %H:%M:%S')
        stations = db.stations.find({},{'_id': False})
        redis_util.save_stations(stations)
        print 'end saving stations into redis->' + datetime.now().strftime('%Y-%m-%d %H:%M:%S')

@app.route('/divvy/api/v1.0/stations',methods=['GET'])
@cross_origin(origin='*', methods=['GET', 'POST', 'OPTIONS'], headers=['X-Requested-With', 'Content-Type', 'Origin'])
def get_stations():
    save_to_redis()
    Geostation = redis_util.format_station_redis(None)
    return json_util.dumps(Geostation, sort_keys=True, indent=4, separators=(',',':'))
There are some tips need to be noticed when format an API in Flask:
- Flask API is decorated with @app.route. The
appis the Flask application instance imported from entrance module _divvy/app/init.py_. - As our web and server are hosted in different container, we must add @corss_origin decorator.
- In this API, we fetch data from redis server. Next step, we will dive into it.
Query Database
We write all data into redis, then we execute data query from redis.
The_redis_util.py_ contains methods of storing all data into redis server. The redis_util.py, routes.py, stations.py and trips.py contains methods of reading data from redis server.
For example, We will see how to read and write station data with redis.
First, let's dive into redis_util.py to see how to store station data into redis server.
/divvy/app/controllers/redis_util.py
r = redis.Redis(host='localhost', port=6379, db=0, password=None, socket_timeout=None, connection_pool=None, charset='utf-8', errors='strict', unix_socket_path=None)
expire_time = 3600
redis_enabled = True
#...
def save_stations(stations):
    for i, station in enumerate(stations):
        key = 'station:' + str(station['id'])
        r.hmset(key, station)
        r.sadd('stations', key)
Then, at the same file, let's see how to read data station data from redis serer.
/divvy/app/controllers/redis_util.py
#...
def format_station_redis(id):
    Geostation = {
        'type':'FeatureCollection',
        'features': []
    }

    set_to_loop = set()
    if id is not None:
        key = 'station:' + str(id)
        if r.exists(key):
            set_to_loop = set([key])
    else:
        set_to_loop = r.smembers('stations')

    for entry in set_to_loop:
        station = r.hgetall(entry)
        Datahash = {
                    'type':'Feature',
                    'geometry':{
                        'type':'Point',
                        'coordinates':[float(station['longitude']),float(station['latitude'])]
                    },
                    'properties':{
                        'name':station['name'],
                        'landmark':station['landmark'],
                        'dpcapacity':station['dpcapacity'],
                        'id':station['id']
                    }
                }

        Geostation['features'].append(Datahash)

    return Geostation
Web: AngularJS
Application Structure
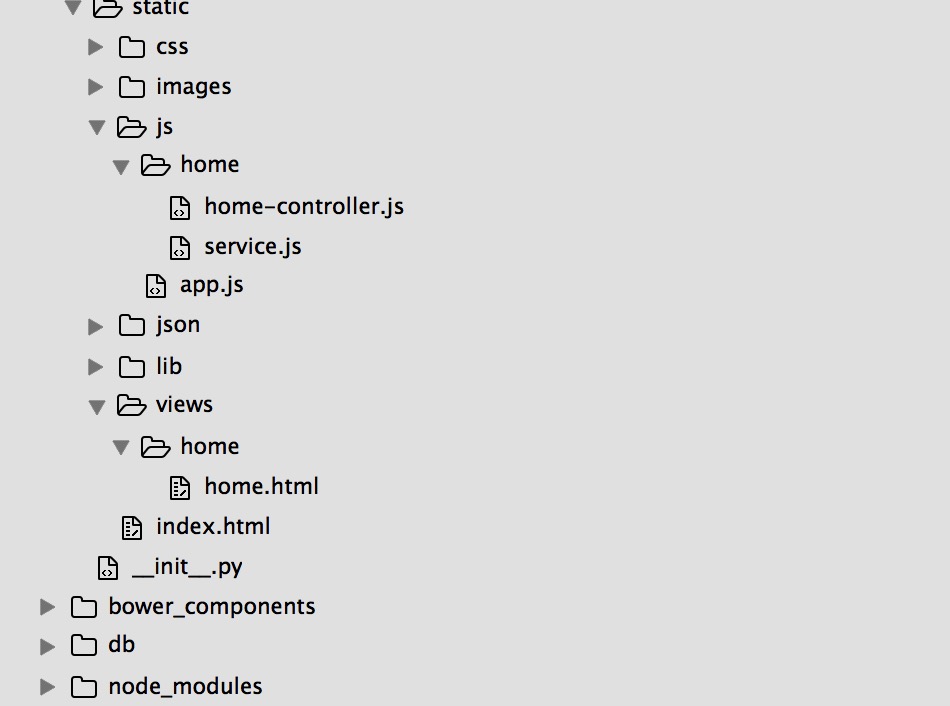
- index.html: home page
- node_modules: where packages installed
- css/js/images/libs/json: as it described
User Cases
- Time-Series
- Show all stations and trips on a map with legend in real-time mode
- Show real-time chart and table of relationship between trips and time
- User can change timefactor to adjust time speed
- User can show trips according to type filter
- Show all stations and trips on a map with legend in real-time mode
- Aggregate
- Show all stations and trips during a certain period
- User can show trips according to time filter
- User can view details of a station by clicking the red node indicating the station on the map
- Show all stations and trips during a certain period
Leaflet & Mapbox
Leaflet is the leading open-source JavaScript library for mobile-friendly interactive maps. Weighing just about 33 KB of JS, it has all the mapping features most developers ever need.
It's very easy to use Leaflet to build your map.
- Include Leaflet CSS file in the head section of index.html:
<link href="lib/leaflet/leaflet.css" rel="stylesheet"/>
- Include Leaflet JavaScript file in the tail of body section of index.html:
<script src="lib/leaflet/leaflet.js"></script>
- Put a div element with a certain id where you want your map to be in home.html:
<div id="map" ng-show="modeChecked"></div>
<div id="map2" ng-hide="modeChecked"></div>
- Make sure the map container has a defined height in app.css:
#map,
#map2 {
    top: 50px;
    left: 0;
    right: 0;
    bottom: 0;
    position: absolute;
    width: auto;
    height: auto;
}
- Ready to initialize the map and do some stuff with it in home-controller.js:
var addMap = function(id) {
var mapId = 'castafiore.k59m8f42';
var latitude = 41.876531, longitude = -87.624098, zoom = 12;
var map = L.map(id, {zoomControl: true}).setView([latitude, longitude], zoom);
L.tileLayer('http://{s}.tiles.mapbox.com/v3/' + mapId + '/{z}/{x}/{y}.png', {
attribution: 'Map data © <a href="http://openstreetmap.org">OpenStreetMap</a> contributors, <a href="http://creativecommons.org/licenses/by-sa/2.0/">CC-BY-SA</a>, Imagery © <a href="http://mapbox.com">Mapbox</a>',
maxZoom: 18
}).addTo(map);
return map;
}
It’s worth noting that Leaflet is provider-agnostic, meaning that it doesn’t enforce a particular choice of providers for tiles, and it doesn’t even contain a single provider-specific line of code, so you’re free to use other providers if you need to (we’d recommend Mapbox though, it looks beautiful).
Use D3.js
D3.js is a JavaScript library for manipulating documents based on data. D3 helps you bring data to life using HTML, SVG, and CSS. D3’s emphasis on web standards gives you the full capabilities of modern browsers without tying yourself to a proprietary framework, combining powerful visualization components and a data-driven approach to DOM manipulation.
Below is the steps to draw stations on map using D3.js:
divvy/app/static/js/home/home-controller.js
    var drawStations = function() {
        g2.selectAll(".station")
            .data(stationData.features)
            .enter().append("circle")
            .attr("class", "station")
            .attr("r", function (d) {
                return d.properties.dpcapacity / 5;
            })
            .attr("fill", "rgb(220,113,0)")
            .attr("transform", function(d){
                return translatePoint(d.geometry.coordinates);
            })
            .attr("cursor", "pointer")
            .on("click", function(d) {
                $('#loading').fadeIn();
                d3.json('http://localhost:5000/divvy/api/v1.0/trips/'
                        + 'originDate=' +  $scope.startdateFormat
                        + '&&arrivalDate=' +  $scope.enddateFormat
                        + '&&stationID=' + d.properties.id, function(data){
                    $scope.$apply(function(){
                        $scope.station.name = d.properties.name;

                        if (data !== null) {
                            var orig = data.Origin;
                            $scope.station.origTotal = orig.TotalNo;
                            $scope.station.origAver = orig.AveNo;
                            $scope.station.origMost = orig.MostTripsNo + ' trip' + (orig.MostTripsNo > 1 ? 's' : '');
                            if (orig.MostTripDate === 'NA') {
                                $scope.station.origMostDate = orig.MostTripDate;
                            } else {
                                var origDate=new Date(Date.parse(orig.MostTripDate.replace(/-/g, "/")));
                                $scope.station.origMostDate = $filter('date')(origDate, 'dd/MM/yyyy');
                            }

                            var arriv = data.Arrival;
                            $scope.station.arrivTotal = arriv.TotalNo;
                            $scope.station.arrivAver = arriv.AveNo;
                            $scope.station.arrivMost = arriv.MostTripsNo + ' trip' + (arriv.MostTripsNo > 1 ? 's' : '');
                            if (arriv.MostTripDate === 'NA') {
                                $scope.station.arrivMostDate = arriv.MostTripDate;
                            } else {
                                var arrivDate=new Date(Date.parse(arriv.MostTripDate.replace(/-/g, "/")));
                                $scope.station.arrivMostDate = $filter('date')(arrivDate, 'dd/MM/yyyy');
                            }
                        }

                        $scope.showInfoBox = true;
                        $('#loading').fadeOut();
                    });
                });
            })
            .on("mouseover", function() {
                d3.select(this)
                .attr("r", function (d) {
                    return d.properties.dpcapacity / 3;
                })
                .attr("fill", "rgb(220,113,0)")
            })
            .on("mouseout", function() {
                d3.select(this)
                .attr("r", function (d) {
                    return d.properties.dpcapacity / 5;
                })
            });

        g.selectAll(".station")
            .data(stationData.features)
            .enter().append("circle")
            .attr("class", "station")
            .attr("r", function (d) {
                return d.properties.dpcapacity / 5;
            })
            .attr("fill", "rgb(220,113,0)")
            .attr("transform", function(d){
                return translatePoint(d.geometry.coordinates);
                // return translatePoint(stationData.features[0].geometry.coordinates);
            })
            .attr("cursor", "pointer")
    }
End