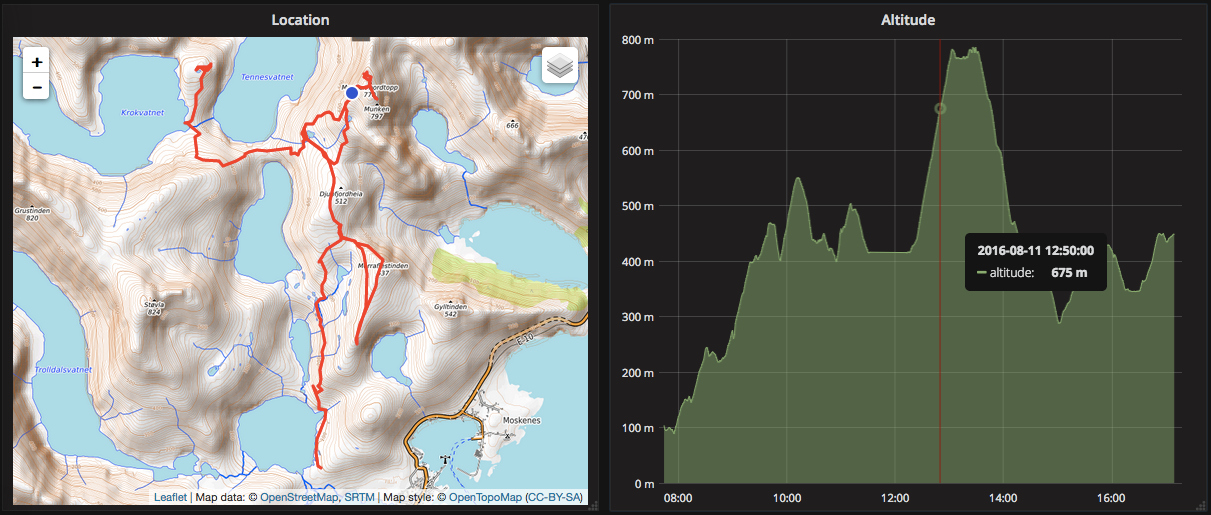
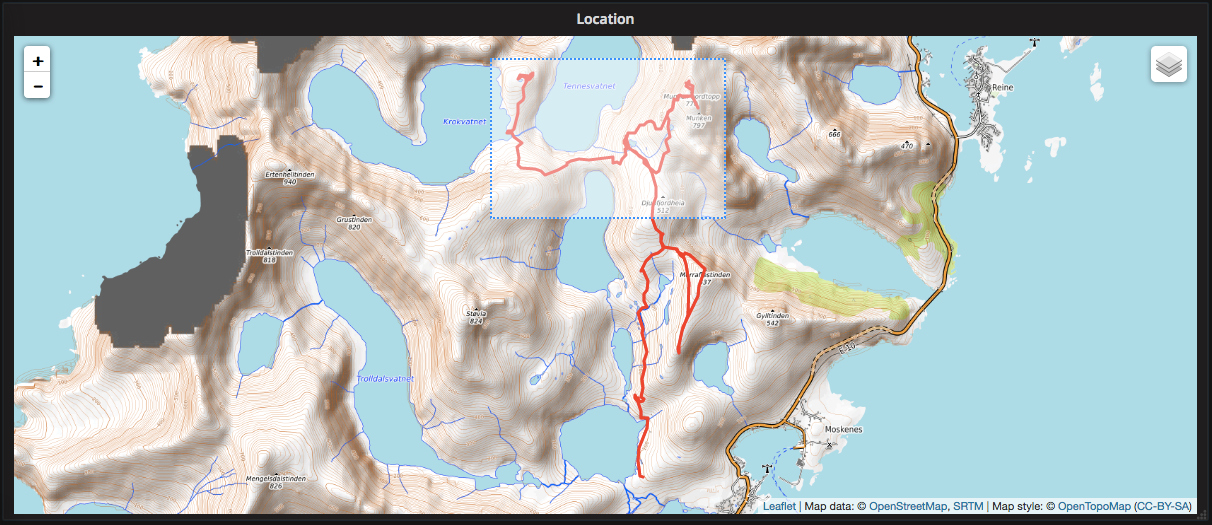
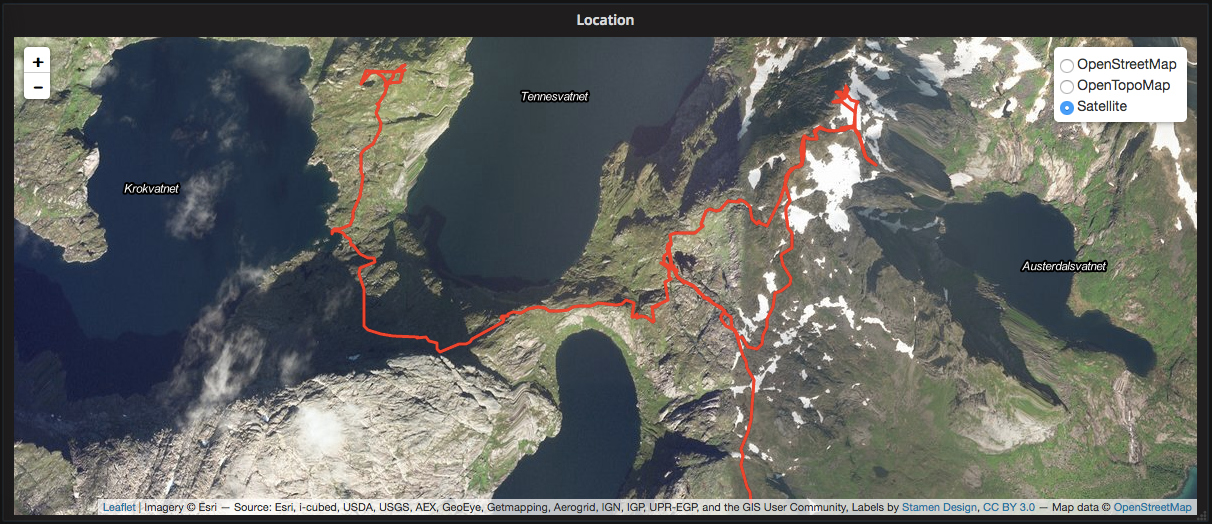
A panel for Grafana that visualizes GPS points as a line on an interactive map.
- Places a dot on the map at the current time as you mouse over other panels.
- Zoom to a range of points by drawing a box by shift-clicking and dragging.
- Multiple map backgrounds: OpenStreetMap, OpenTopoMap, and Satellite imagery.
- Track and dot colors can be customized in the options tab.
To use the latest version of this plugin, clone it into Grafana's plugin directory (you can find
this path in Grafana's logs when it starts up) and run git checkout releases. You should now be
able to select the "TrackMap" panel when adding a new panel to a Grafana dashboard. To use an
earlier version use git to checkout an earlier commit on the releases branch.
To use an unreleased version of the plugin or do development, you will need to manually build it from source.
To build, install npm, check out the master branch (or the commit you want to build) and run the following commands in the plugin's directory:
npm install
npm run build
This will build the currently checked out source into the dist folder for Grafana to use.
The plugin requires latitude and longitude measurements provided as floats in two separate fields formatted by Grafana as a "Time series". The order of the data returned by the query is required (latitude, then longitude) since the labels and tag names are not used.
For example, the following query has been tested using InfluxDB as a data source in the case where
the latitude and longitude series are stored in the location measurement:
SELECT median("latitude"), median("longitude") FROM "location" WHERE $timeFilter GROUP BY time($interval)
Because the plugin only cares about getting 2 series of data, it's also possible to use MySQL/MariaDB as a data source by using 2 queries like so:
A: SELECT "latitude" as value, $__time(timestamp) FROM "location" WHERE $__timeFilter(timestamp) ORDER BY timestamp ASC
B: SELECT "longitude" as value, $__time(timestamp) FROM "location" WHERE $__timeFilter(timestamp) ORDER BY timestamp ASC


