The process of image generation in the stable diffusion model involves comparison between the encoded image (latent) and the encoded words (embedding). The comparison is performed "pixel"-wise on the encoded image. The more related the encoded "pixel" and the encoded word are, the more effect from the word will be applied on the "pixel". This is known as cross-attention, and the strength of the cross-attention can be seem as the strength of the relevance. The image decoder in stable diffusion has a CNN structure, which means it maps adjacent encoded "pixels" to adjacent real pixels. This makes it easy to visualize the cross-attention stength in the encoded space on the decoded image. This extension provides such a visualization.
Put the scripts folder in stable-diffusion-webui/extensions/VisualizeCrossAttention/, and restart the webui. A new tab VXA should be added to the webui.
A visualization can be generated by the following steps:
- Drop a image (height and width is supposed to be multiples of 256) on the left of the ui.
- Enter the prompt that we want to visualize in the prompt box, for example,
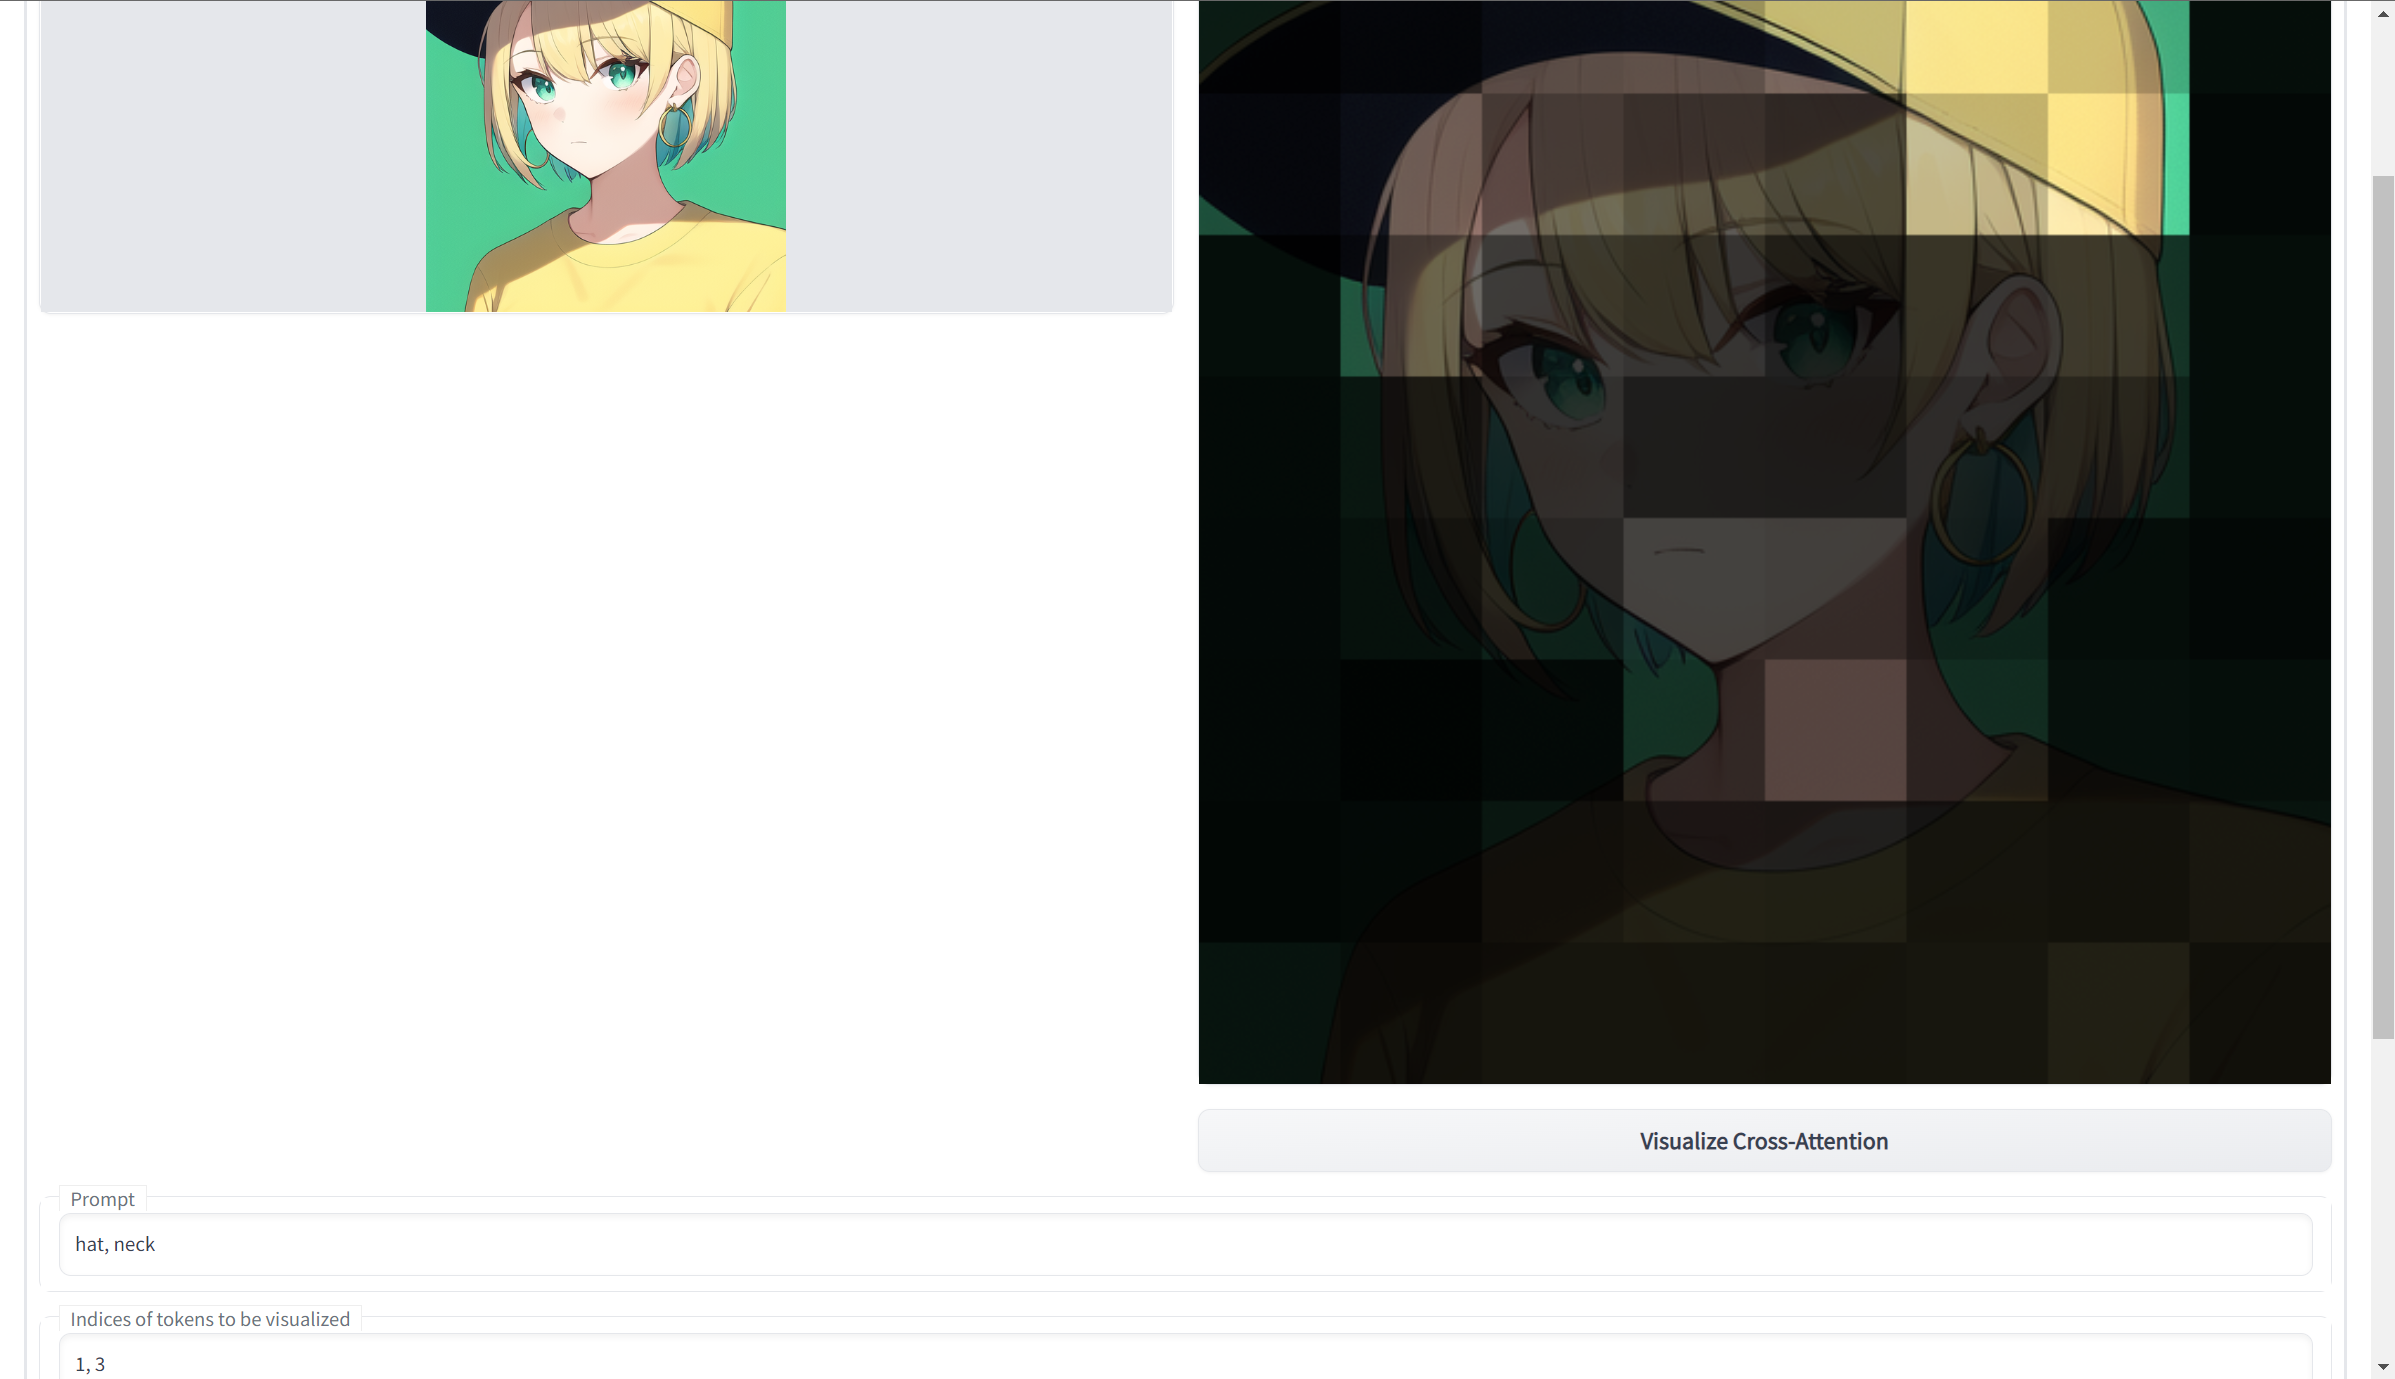
hat, neck. - A word will be first encoded to one or more tokens before input to the diffusion model. For example, in textual inversion, we can choose the number of tokens of a specific tag. For a preview of the tokenize result, use the tokenizer extension. Usually, one simple word will be encoded to one token, and note that a comma will also be encoded to a token.
- In the
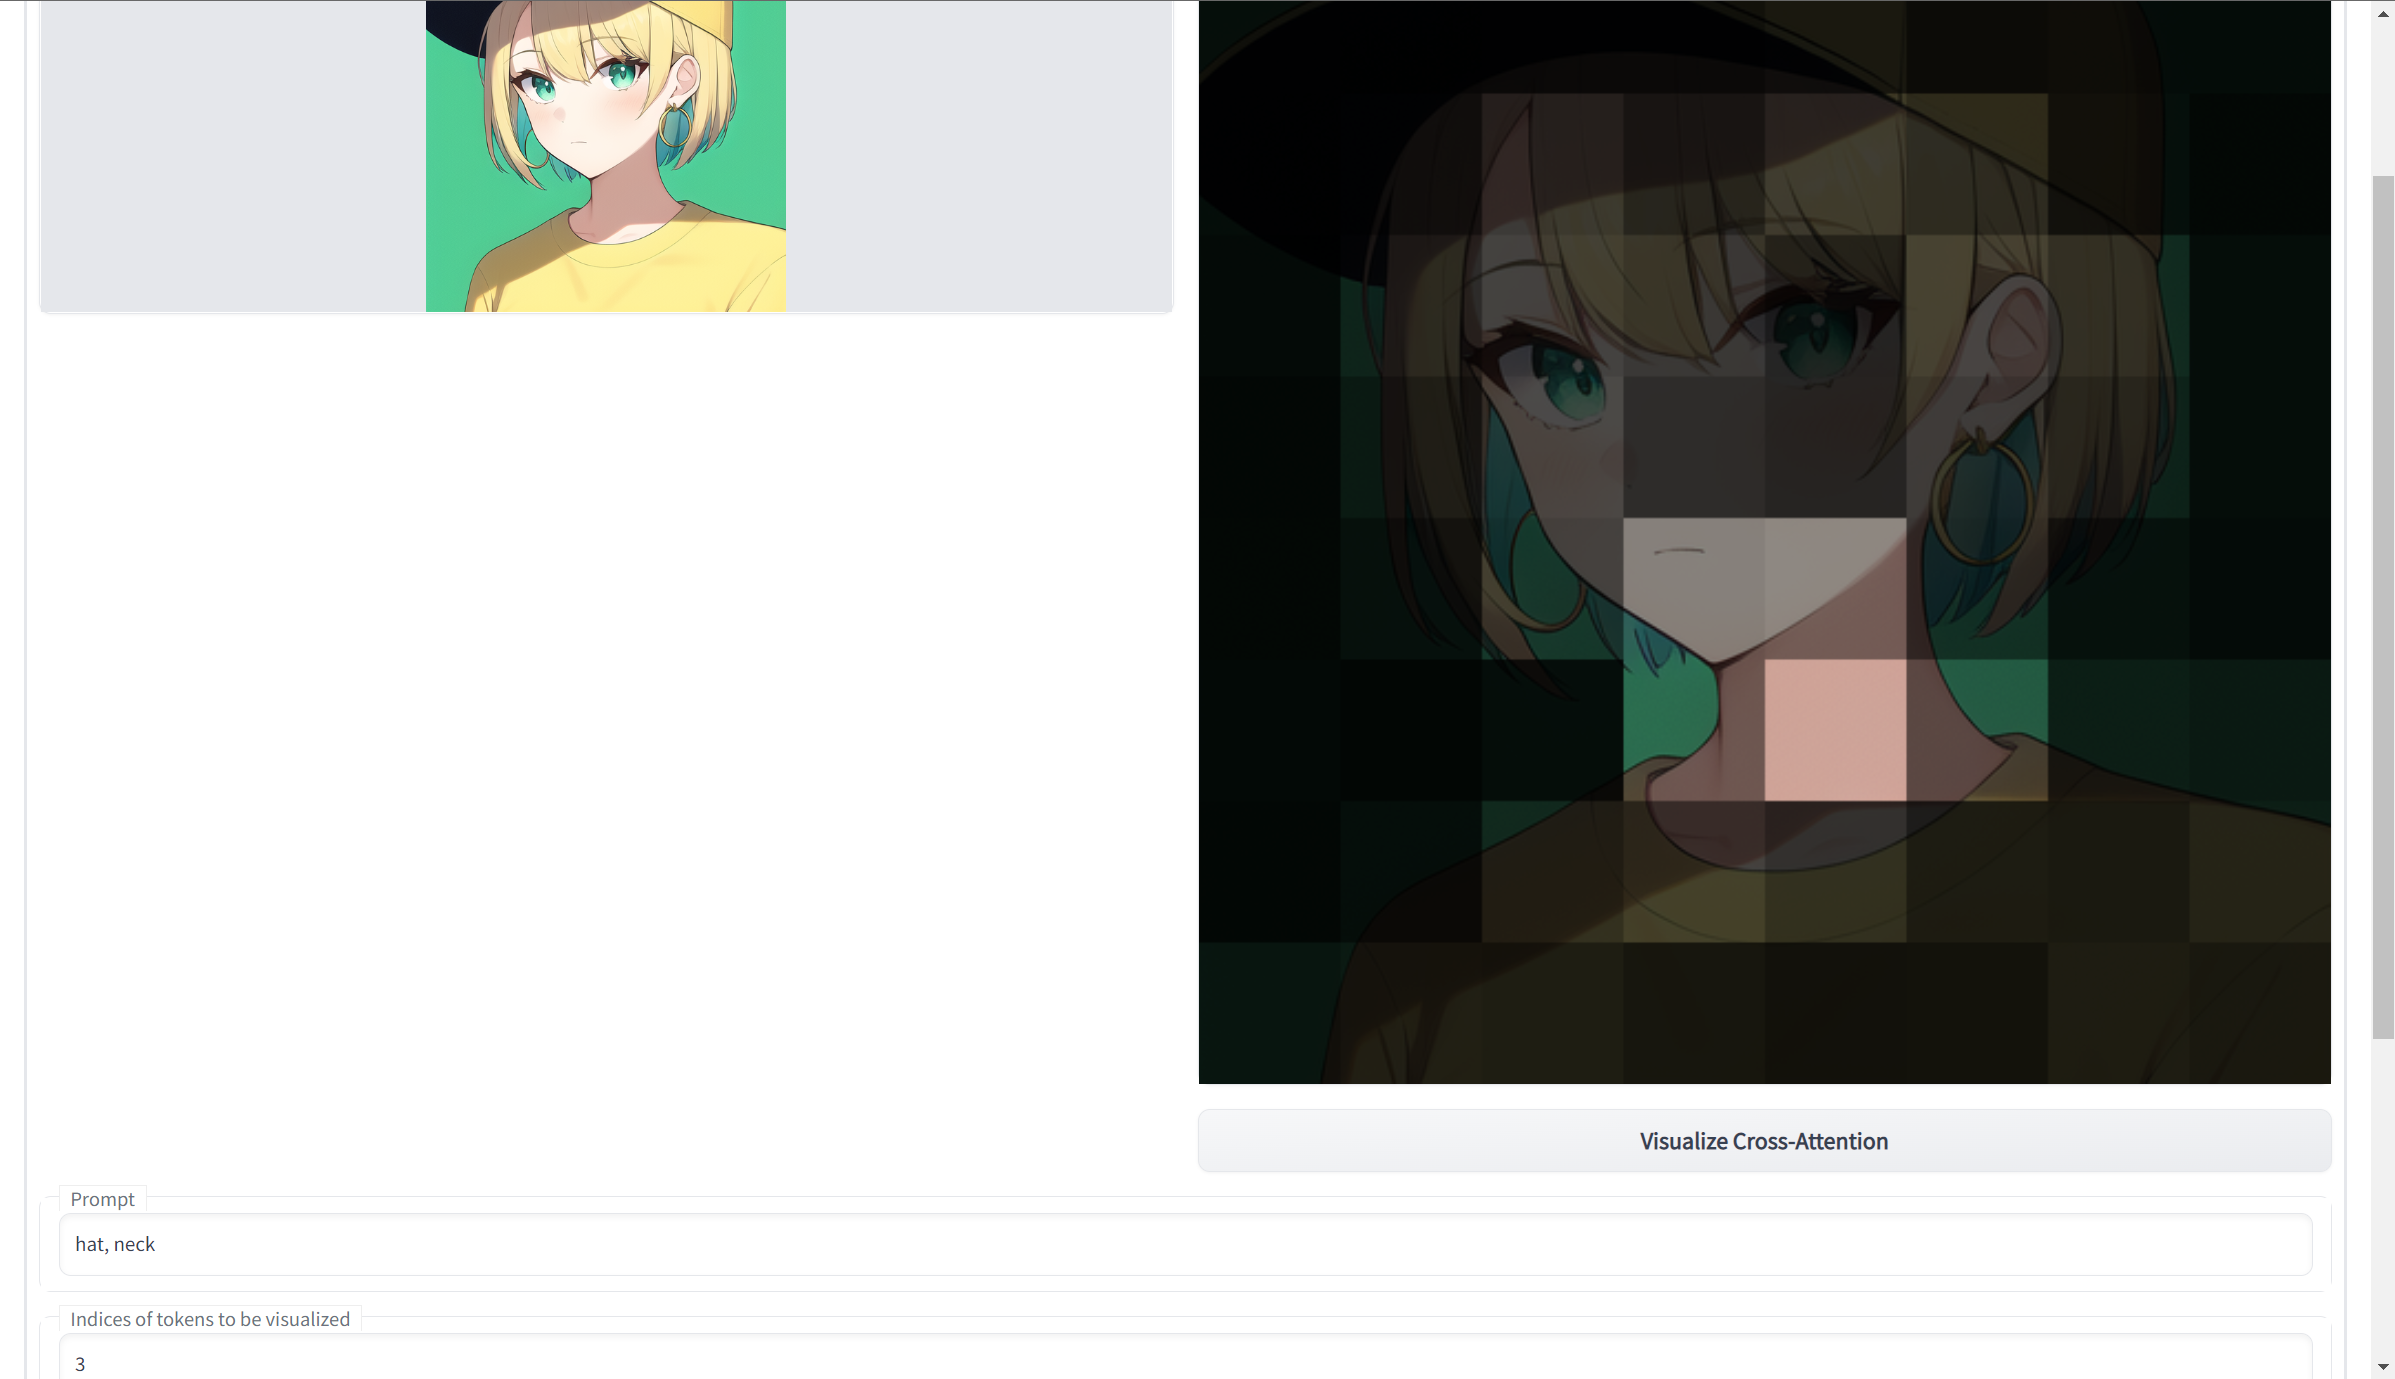
Indices of tokenbox, we should enter the indices of the specific tokens that we want to visualize. For instance,1, 3means the first and the third tokens. In the above example, it corresponds tohatandneck. Theneckprompt is on the third because the comma "," in the prompt is the second token. - If we want to adds up the strength of all tokens, we can leave the
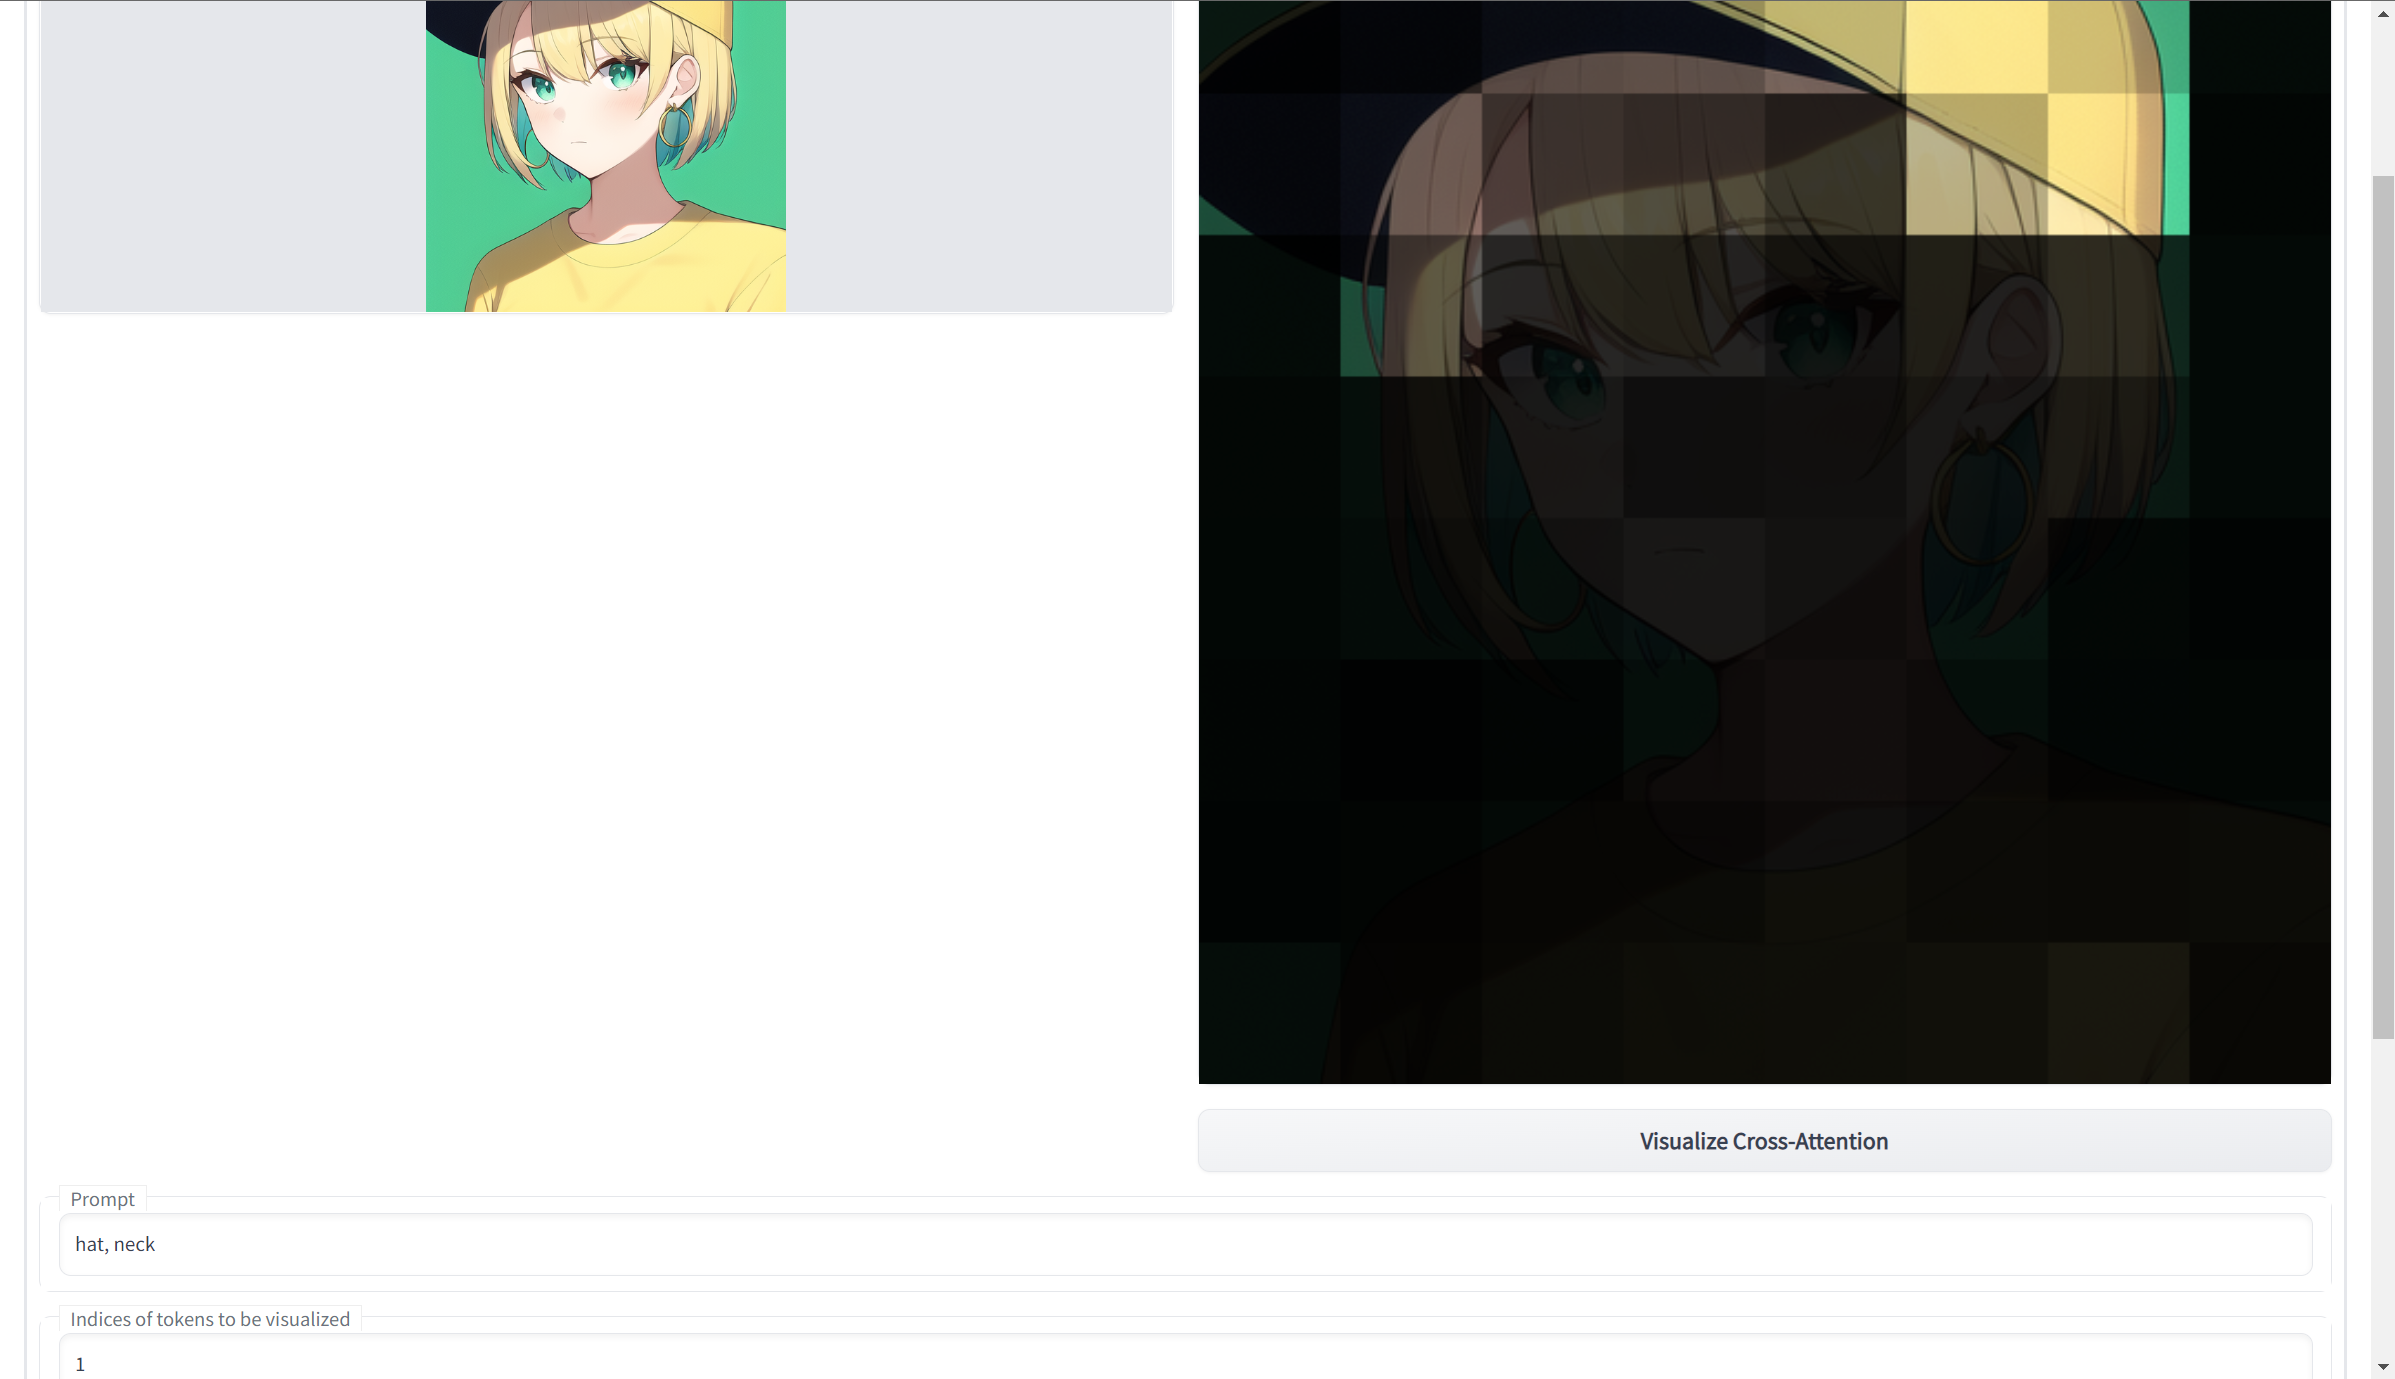
indices of tokenbox blank. We note that there are usually a lot ofend of sentencetoken padding at the end of the encoded prompt. In the above example, there are73such tokens, and they will be added into the summation, which will make the result worse. To obtain a good result, we recommend to specify a single token to be visualized. For example,1for the tokenhat. We further note that the zeroth token is thebegin of sentencetoken, and we exclude it in the summation. - The
Time embeddingseems has little effect on the result, and we can leave it as default. - There are several cross-attention layers in the stable diffusion model, and we can choose which one we want to visualize in the
Cross-attention layerbox. In stable diffusion, a512 x 512real image will be first encoded into a64 x 64latent. In the following layers, the latent will be further downsampled to a32 x 32and16 x 16latent, and then upsampled to a64 x 64latent. So we can see that different cross-attention layers have different resolutions on the result. I found that the middle layer (also the most low-res layer) has the most apparent result, so I set it as the default. It will be an interesting topic to study the relation between different layers and different tokens. - We can choose to output masked or greyscale image for the visualization in the
Output modeselection. - Finally, click the
Visualize Cross-Attentionbutton to obtain a result.
- hat
- neck
- hat and neck