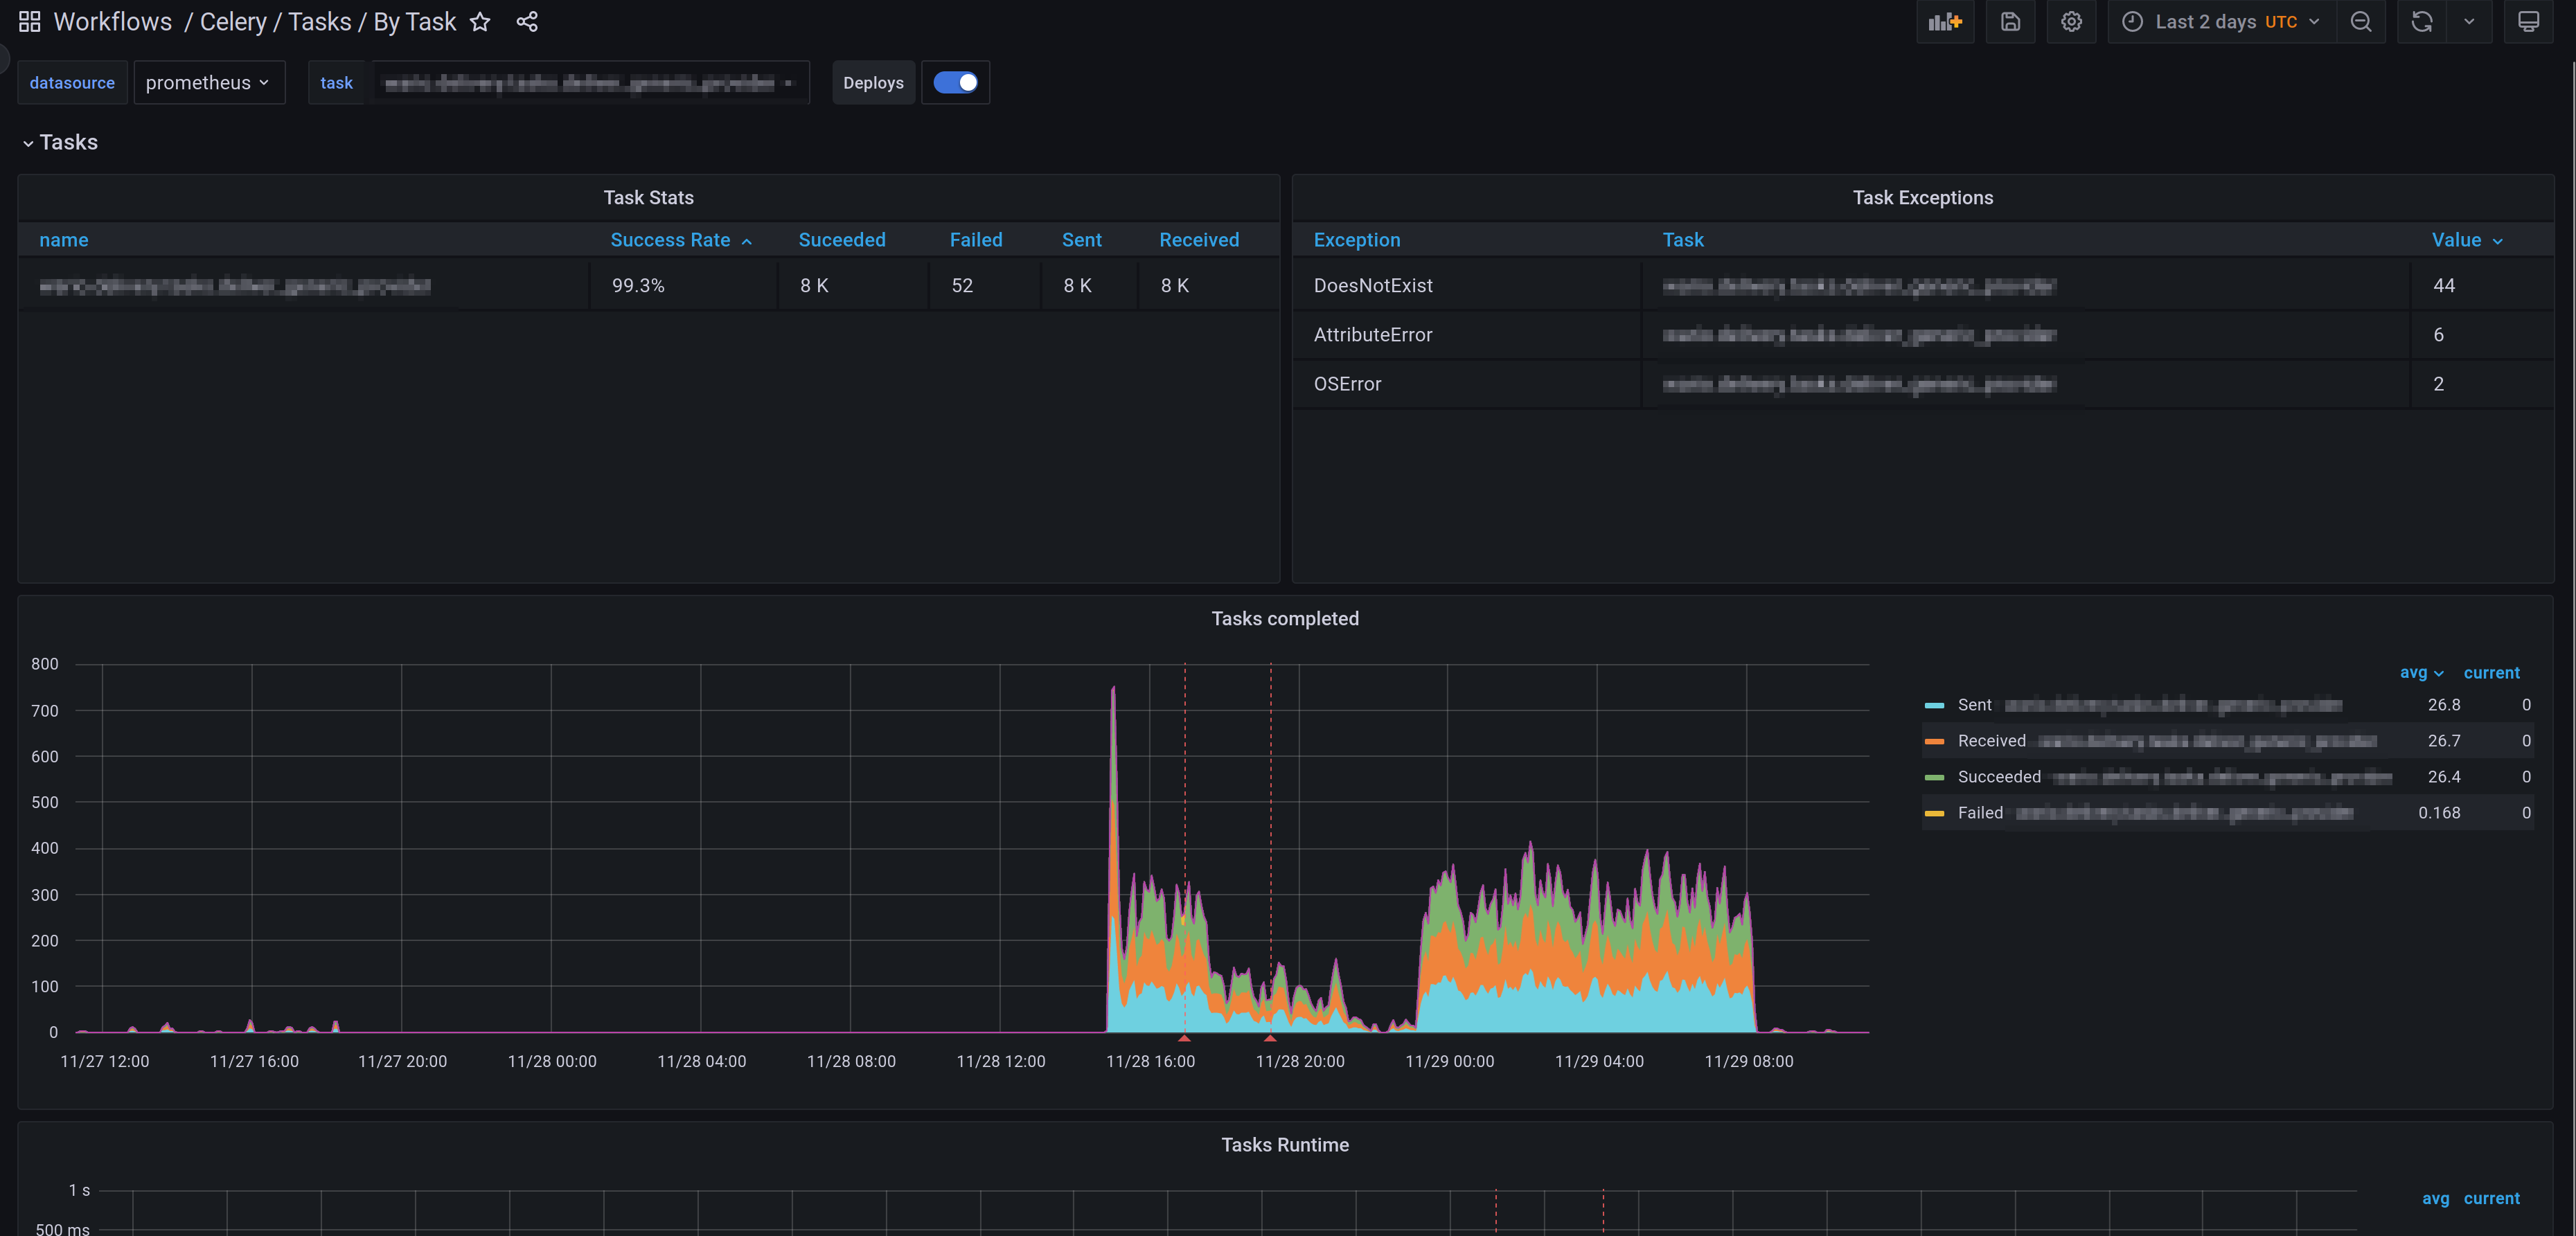
While I was adding Celery monitoring to a client site I realized that the existing brokers either didn't work, exposed incorrect metric values or didn't expose the metrics I needed. So I wrote this exporter which essentially wraps the built-in Celery monitoring API and exposes all of the event metrics to Prometheus in real-time.
- Tested for both Redis and RabbitMQ
- Uses the built in real-time monitoring component in Celery to expose Prometheus metrics
- Tracks task status (task-started, task-succeeded, task-failed etc)
- Tracks which workers are running and the number of active tasks
- Follows the Prometheus exporter best practises
- Deployed as a Docker image or Python single-file binary (via PyInstaller)
- Exposes a health check endpoint at /health
- Grafana dashboards provided by the Celery-mixin
- Prometheus alerts provided by the Celery-mixin
Alerting rules can be found here. By default we alert if:
- A task failed in the last 10 minutes.
- No Celery workers are online.
Tweak these to suit your use-case.
The Grafana dashboard (seen in the image above) is here. You can import it directly into your Grafana instance.
There's another Grafana dashboards that shows an overview of Celery tasks. An image can be found in ./images/celery-tasks-overview.png. It can also be found
here.
Celery needs to be configured to send events to the broker which the exporter will collect. You can either enable this via Celery configuration or via the Celery CLI.
To enable events in the CLI run the below command. Note that by default it
doesn't send the task-sent event which needs to be configured in the
configuration. The other events work out of the box.
$ celery -A <myproject> control enable_eventsEnable events using the configuration:
# In celeryconfig.py
worker_send_task_events = True
task_send_sent_event = True
Configuration in Django:
# In settings.py
CELERY_WORKER_SEND_TASK_EVENTS = True
CELERY_TASK_SEND_SENT_EVENT = TrueUsing Docker:
docker run -p 9808:9808 danihodovic/celery-exporter --broker-url=redis://redis.service.consul/1Using the Python binary (for-non Docker environments):
curl -L https://github.com/danihodovic/celery-exporter/releases/download/latest/celery-exporter -o ./celery-exporter
chmod+x ./celery-exporter
./celery-exporter --broker-url=redis://redis.service.consul/1There's a Helm in the directory charts/celery-exporter for deploying the Celery-exporter to Kubernetes using Helm.
All arguments can be specified using environment variables with a CE_ prefix:
docker run -p 9808:9808 -e CE_BROKER_URL=redis://redis danihodovic/celery-exporterWhile the default options may be fine for most cases, there may be a need to specify optional broker transport options. This can be done by specifying one or more --broker-transport-option parameters as follows:
docker run -p 9808:9808 danihodovic/celery-exporter --broker-url=redis://redis.service.consul/1 \
  --broker-transport-option global_keyprefix=danihodovic \
  --broker-transport-option visibility_timeout=7200
In case of extended transport options, such as sentinel_kwargs you can pass JSON string:,
for example:
docker run -p 9808:9808 danihodovic/celery-exporter --broker-url=sentinel://sentinel.service.consul/1 \
  --broker-transport-option master_name=my_master \
  --broker-transport-option sentinel_kwargs="{\"password\": \"sentinelpass\"}"
The list of available broker transport options can be found here: https://docs.celeryq.dev/projects/kombu/en/stable/reference/kombu.transport.redis.html
By default, celery-exporter will raise an exception and exit if there
are any errors communicating with the broker. If preferred, one can
have the celery-exporter retry connecting to the broker after a certain
period of time in seconds via the --retry-interval parameter as follows:
docker run -p 9808:9808 danihodovic/celery-exporter --broker-url=redis://redis.service.consul/1 \
--retry-interval=5Head over to the Celery-mixin in this subdirectory to generate rules and dashboards suited to your Prometheus setup.
| Name | Description | Type |
|---|---|---|
| celery_task_sent_total | Sent when a task message is published. | Counter |
| celery_task_received_total | Sent when the worker receives a task. | Counter |
| celery_task_started_total | Sent just before the worker executes the task. | Counter |
| celery_task_succeeded_total | Sent if the task executed successfully. | Counter |
| celery_task_failed_total | Sent if the execution of the task failed. | Counter |
| celery_task_rejected_total | The task was rejected by the worker, possibly to be re-queued or moved to a dead letter queue. | Counter |
| celery_task_revoked_total | Sent if the task has been revoked. | Counter |
| celery_task_retried_total | Sent if the task failed, but will be retried in the future. | Counter |
| celery_worker_up | Indicates if a worker has recently sent a heartbeat. | Gauge |
| celery_worker_tasks_active | The number of tasks the worker is currently processing | Gauge |
| celery_task_runtime_bucket | Histogram of runtime measurements for each task | Histogram |
| celery_queue_length | The number of message in broker queue | Gauge |
| celery_active_consumer_count | The number of active consumer in broker queue (Only work for RabbitMQ and Qpid broker, more details at here) | Gauge |
| celery_active_worker_count | The number of active workers in broker queue | Gauge |
| celery_active_process_count | The number of active process in broker queue. Each worker may have more than one process. | Gauge |
Used in production at https://findwork.dev and https://django.wtf.
Pull requests are welcome here!
To start developing run commands below to prepare your environment after the git clone command:
# Install dependencies and pre-commit hooks
poetry install
pre-commit install

# Test everything works fine
pre-commit run --all-files
docker-compose up -d
pytest --broker=memory      --log-level=DEBUG
pytest --broker=redis       --log-level=DEBUG
pytest --broker=rabbitmq --log-level=DEBUGMade with contrib.rocks.

