AppDynamics provides a rich source of information about your monitored applications, including the performance of individual business activities, dependency flow between application components, and details on every business transaction in an instrumented environment.
AppDynamics APM provides a rich toolkit for turning the vast corpus of data captured by AppDynamics into valuable insights.
AppDynamics DEXTER (Data Extraction and Enhanced Reporting) can make this process even faster and simpler. DEXTER provides new ways to unlock the data stored in the AppDynamics platform. You can analyze this information in a number of data warehousing and visualization applications, and combine it with your own data to generate customized reports.
You can see the reports from our demo environments for yourself from here.
If you’re familiar with data warehousing terminology, think of DEXTER as an extract/transform/load (ETL) utility for AppDynamics data. It extracts information from the AppDynamics platform, transforms it into an enriched, query-able form for faster access, and loads it into variety of reports for:
- Application logical model (applications, tiers, nodes, backends, business transactions)
- Performance metrics (average response time, calls, errors per minute, CPU, memory, JVM, JMX, GC metrics)
- Dependency data (flow maps, relationships between components)
- Events (errors, resource pool exhaustion, application crashes and restarts, health rule violations)
- Configuration rules (business transaction, backend detection, data collectors, error detection, agent properties)
- Snapshots (SQL queries, HTTP destinations, data collectors, call graph data, errors)
By extracting the data from AppDynamics, converting it into queryable format and storing it locally, the data can be preserved with full fidelity indefinitely and interrogated in new and novel ways.
Here are some scenarios that are possible with data provided by AppDynamics DEXTER:
- Investigation of what is detected and reporting across multiple Controllers and multiple Applications
- Evaluating what components (Tiers, Nodes, Backends, Business Transactions) are reporting and what load they have
- Inventory of configuration in multiple environments
- Comparison of configuration between multiple environments
- Health Checks for On-Premises Controller – grabbing of data from for later investigation, when Controller is no longer accessible
- Extraction and preservation of fine-grained Metric, Flow map and Snapshot data for interesting time ranges (such as load test, application outage, interesting customer load) with goal of investigation and comparison in the future
- Visualization and correlation of Events, Health Rules Snapshots to the Metric data
- Discovery and data mining of of Snapshots by the types and contents of the Exits (HTTP call and SQL query parameters), Data Collectors, entities involved (Tier, Backend, Error, Service Endpoint and Applications) and Call Graph data
The 3 part Walkthrough gives an overview and screenshots of the tool in action.
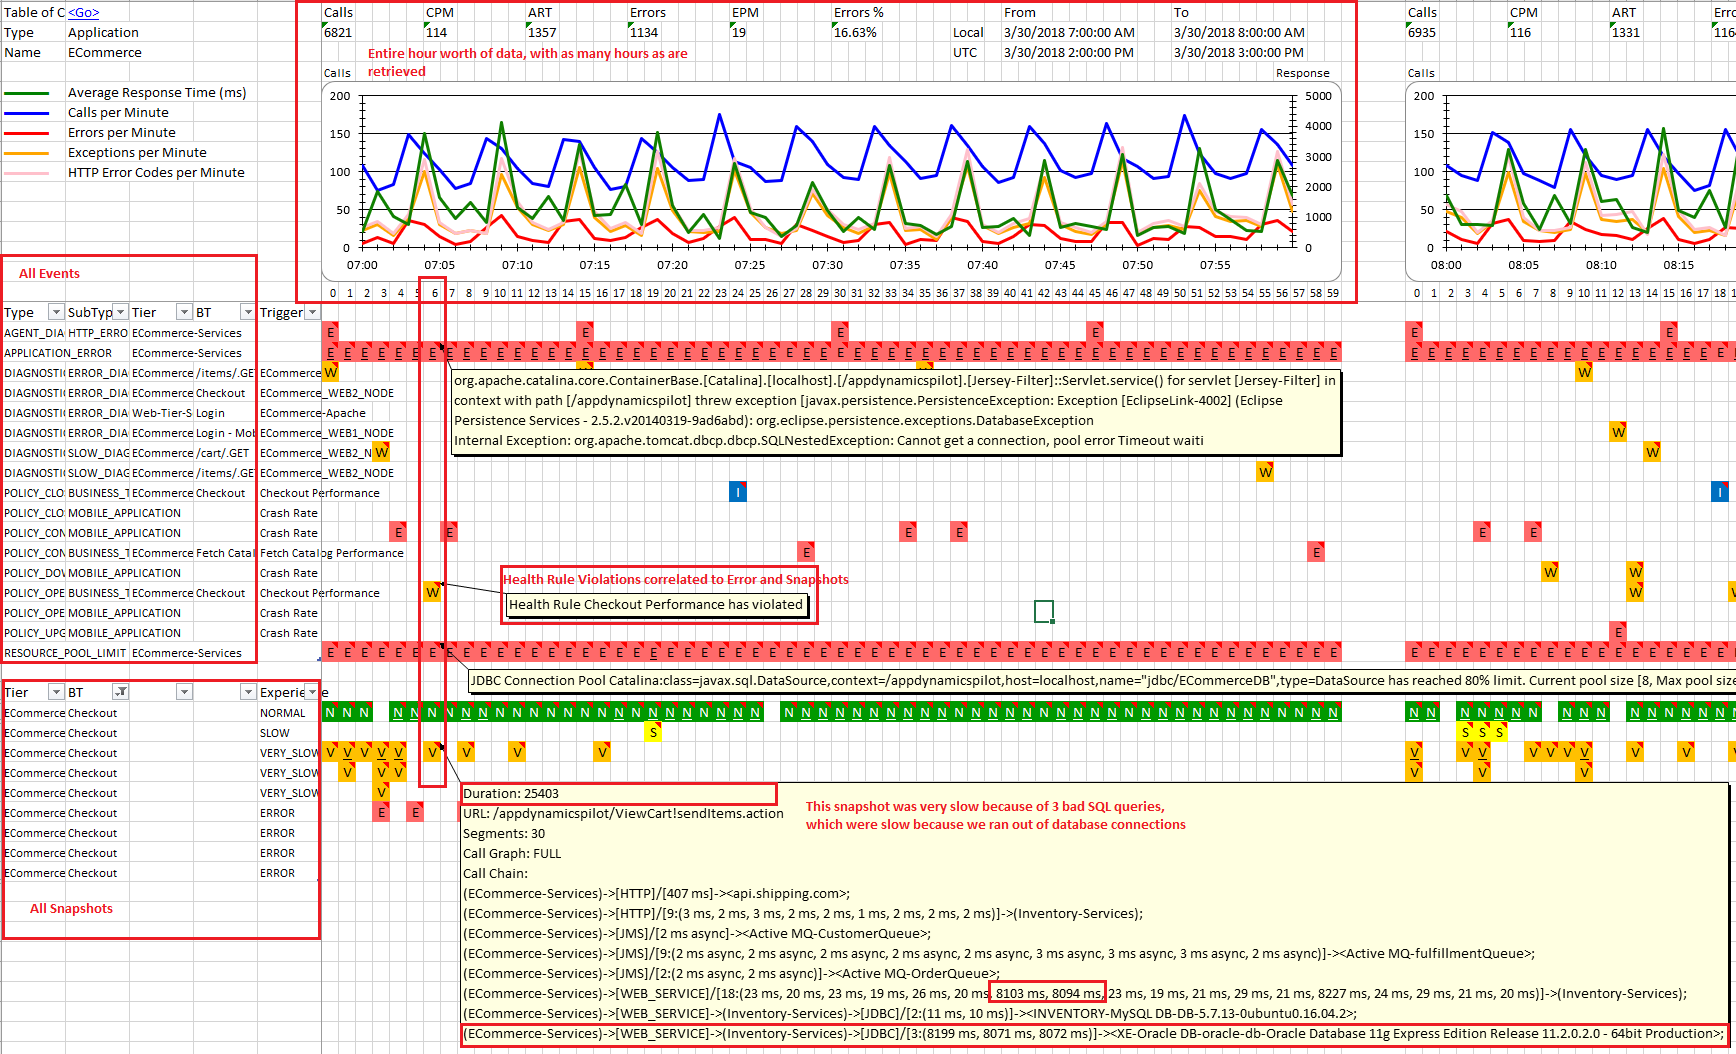
"Entity Timeline View" is part of Entity Details report that is generated for Application and all of its Tiers, Nodes, Business Transactions, Backends, Service Endpoints and Errors. It provides a single-pane view into many things, including:
- 1-minute granularity Metrics in the 1 hour time frame for each hour in the exported range
- Filterable list of Events and Health Rule Violations, arranged in the timeline of that hour, with details of the Event
- Filterable list of Snapshots, broken by Business Transaction and User Experience, arranged in the timeline of that hour, and hotlinked to the specific Snapshot
If you ever were presented with a large Controller (or several) full of unknown number of Applications, Tiers and Nodes, you will like the detail provided by Detected APM Entities report.
As alternative to Excel, PowerBI visual analytics tool offers advanced exploration possibilities of the same data in Detected APM Entities in PowerBI report.
Entity Metrics report shows summary and graphs for all Metrics for each and every detected Application, Tier, Node, Business Transaction, Backend, Service Endpoint, Errors and Information Point. This makes it very valuable in times when you want to rapidly assess hundreds of Applications, Tiers and Business Transactions and see which ones need your attention.
A scatterplot of Calls per Minute vs Average Response time is provided for all types of Entities, allowing you to see what items are both slow and frequently called:

Per minute breakdown with ART vs CPM scatter:

All Nodes JVM GC metrics are stored in high granularity forever:

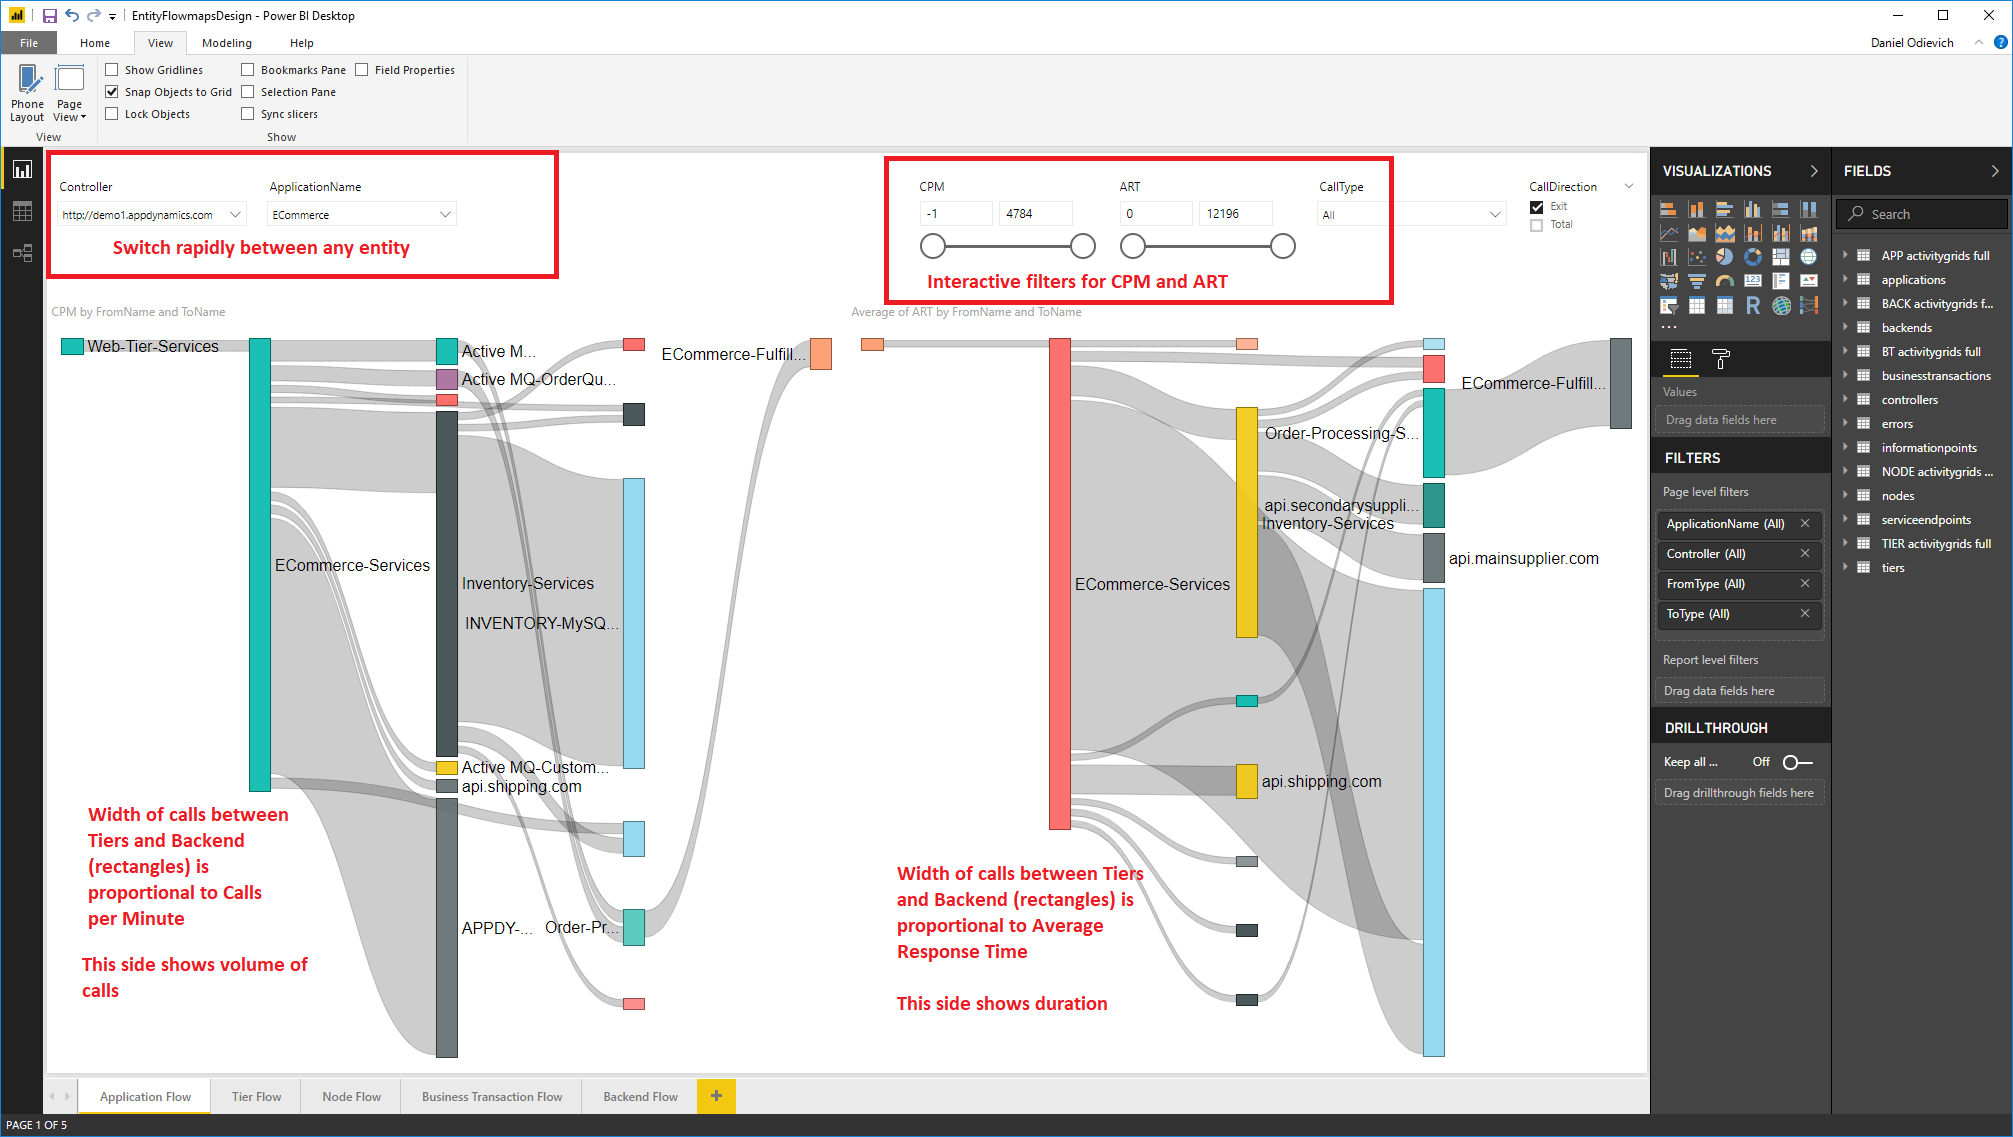
To take this a step further, PowerBI visual analytics tool offers advanced, interactive displays of the same data in Entity Metrics in PowerBI and Entity Flowmaps in PowerBI reports.
Render Flowmap of activity with Sankey style flow diagram for both Average Response Time and Calls per Minute metrics:

Have you ever wanted to find a snapshot that calls a specific Tier, Backend or Application?
How about the one that uses specific SQL query?
And how about the one that has a real Call Graph?
Or maybe also pone with special Data Collector value?
Or how about finding out how many times that special Query was slow in a given time range?
Or discover which classes and methods are called in which Snapshots?
How about all of the above, combined?
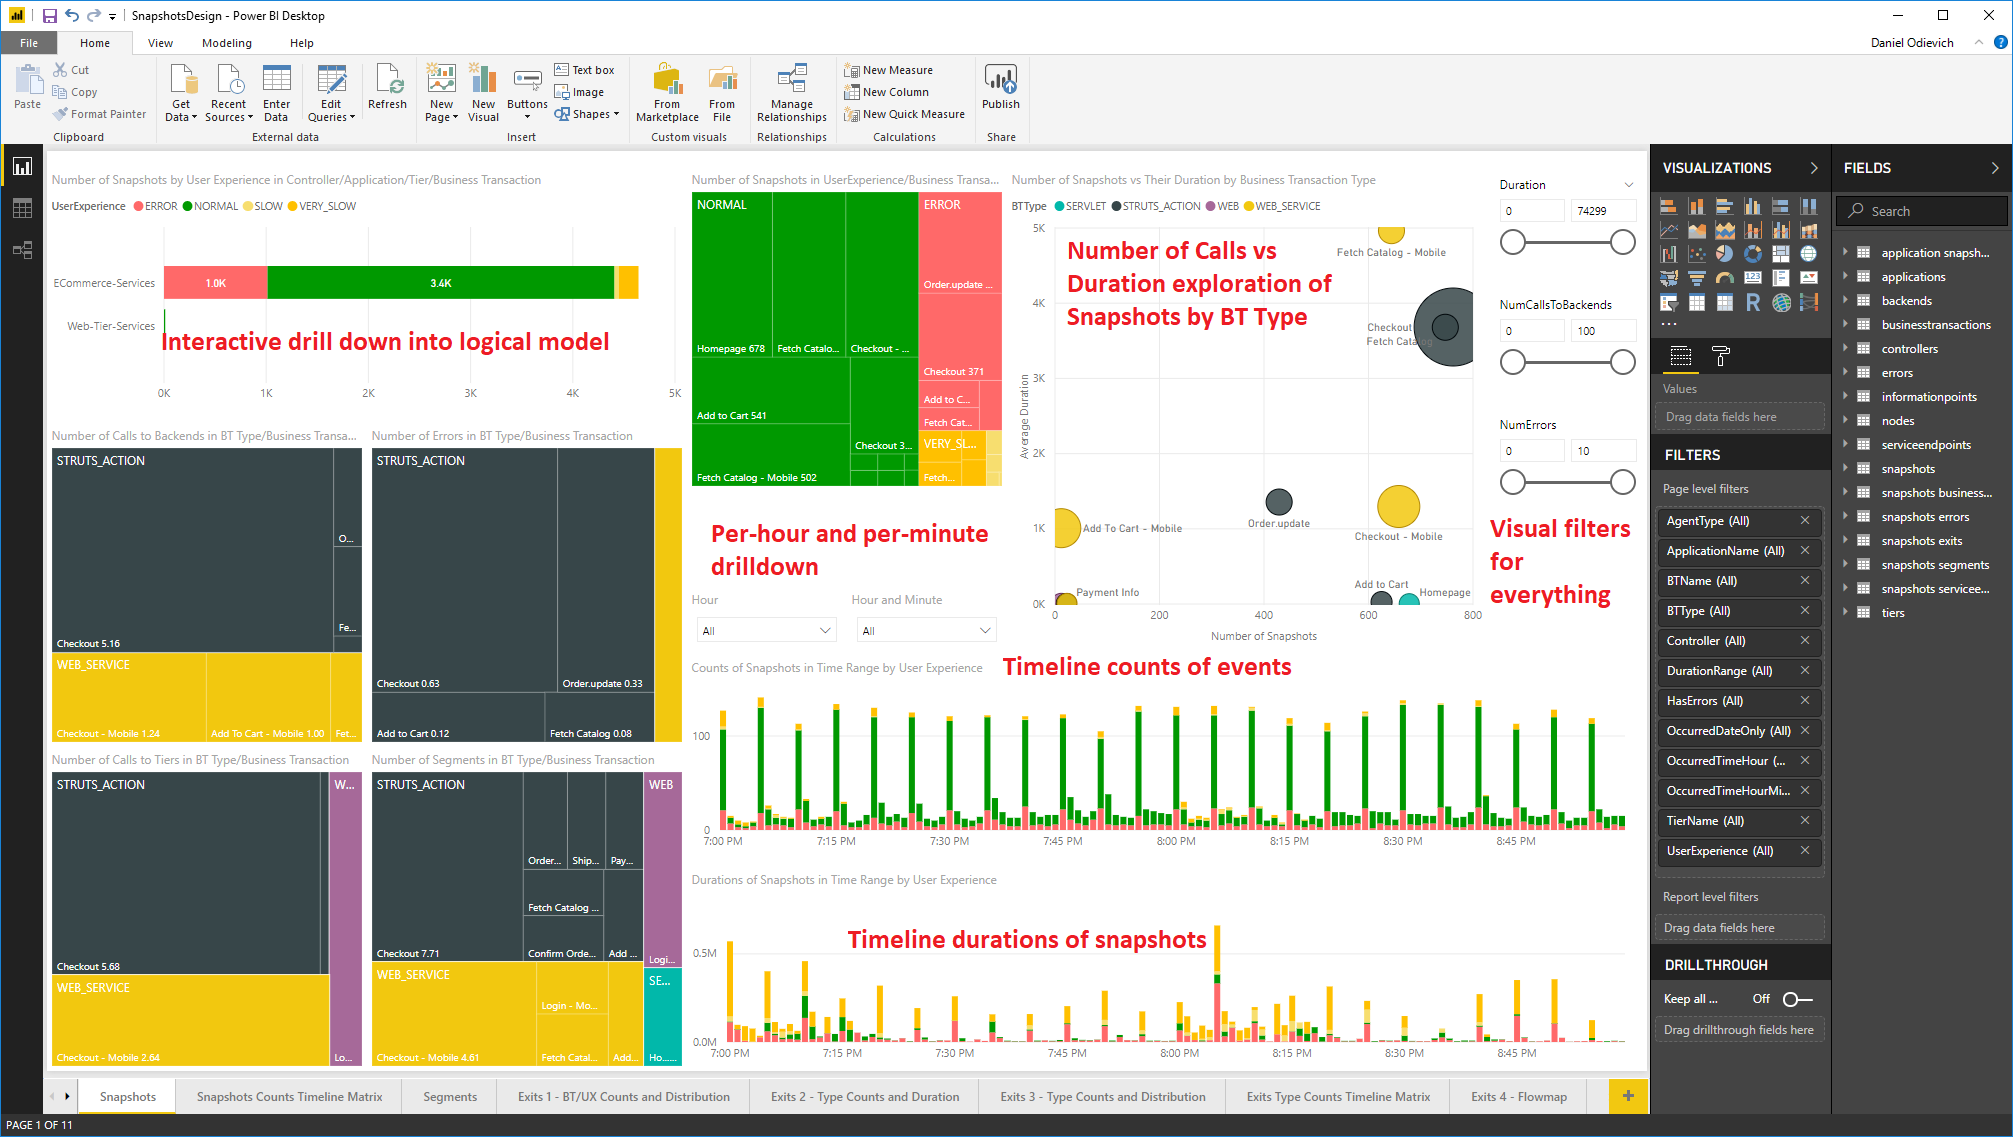
In Snapshots report you can do all of that, and more.
Snapshot Exit Calls broken by time and duration:

Snapshots with multiple Segments have an enhanced Waterfall view, with “^” caret character indicating exactly when in the Segment execution the Exit Calls occurred

An even better way to explore this data is by using Tableau or PowerBI visual analytics tools with very interactive and rapid exploration views provided by Snapshots in PowerBI, Snapshots Method Calls in PowerBI reports:

... and Snapshots in Tableau:

You can even explore your Call Graph data 
Flame Graphs and Flame Chart reports are an ingenious and useful way to visualize many call graphs in single screen.
Sum of all calls in Application for entire time range

Sum of all calls in Application with Time grouping
/
Configuration report provides information about Controller Settings and Application configuration as well as comparison of configuration between multiple environments.
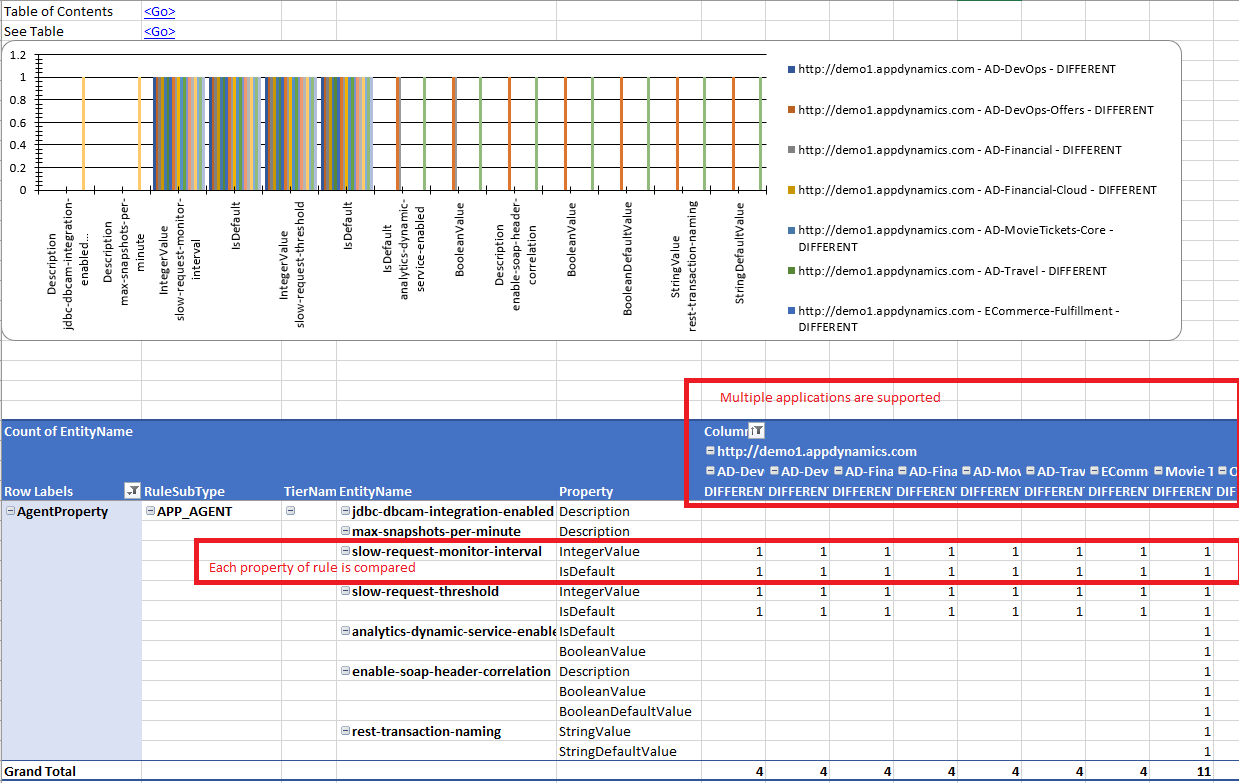
Here is an example showing non-default Agent Properties set on multiple Applications in multiple Controllers

Here is an example showing differences

Server Infrastructure Monitoring inventory of Machines, CPUs, Disks and Processes is available in Detected SIM Entities report.
Database Monitoring Queries, Sessions, Blocked Sessions and other interesting database-related artifacts can be seen in Detected DB Entities report.
Web End User Monitoring inventory of Pages and AJAX Requests, Page Resources, related Business Transactions and Geo Locations is available in Detected WEB Entities report.
Mobile End User Monitoring inventory of Network Requests is available in Detected MOBILE Entities report.
BusinessIQ inventory of Searches, Widgets, Saved Metrics, Business Journeys, Experience Levels, Schemas and Fields is available in Detected BIQ Entities report.
Users, Groups, Roles and Permissions report shows information about each and every security entity (User, Group, Role and Permission) and their relationship in Controller is available in Users and Permissions report.
Dashboards report shows information about all Dashboards, Widgets and Time Series and their relationship to other Entities in Controller is available in Dashboards report.
See Flowmap dashboard screenshot about each and every detected Entity in APM applications in Entity Dashboards report.
If you are new to AppDynamics DEXTER and want an introduction, read through 3 part Walkthrough.
Learn how the tool works by reading Documentation in the project wiki.
Install Application, create Job File to specify what to do, and Run Application.
You will see the results in the Output folder.
To understand what you are looking at, read Description of Excel Reports.
If you need help with issues and/or intepretation of results, read Getting Support.
AppDynamics DEXTER is also hosted on AppDynamics Exchange in Extensions area.
- Microsoft - Thanks for Visual Studio and .NET Core team for letting us all write code in C# on any platform https://github.com/dotnet/core
- Command Line Parser - Simple and fast https://github.com/gsscoder/commandline
- CSV File Creation and Parsing - An excellent utility https://github.com/JoshClose/CsvHelper
- JSON Parsing - NewtonSoft JSON is awesome https://www.newtonsoft.com/json
- Logging - NLog is also awesome http://nlog-project.org/
- Excel Report Creation - Jan Kallman's excellent helper class is a lifesaver https://github.com/JanKallman/EPPlus
- Flame Graphs - Brendan Gregg’s Flame Graph generator was used to both inspiration and as reference to build code to generate Flame Graph reports https://github.com/brendangregg/FlameGraph


