This repo contains containers that can be used for monitoring Windows Edge Metrics using Grafana and InfluxDB on the edge.
Note: Edge Metrics are being enanced in version 1.0.9 and are expected to support sending metric information to Azure Log Analytics via telegraf
Windows amd64
Metrics are enabled using the following methods found in edge docs
Edge Hub has the ability to automatically send metrics information to an Influx TimeSeries Database that is on the same network as the edgeHub module by setting the CollectMetrics environment variable in the EdgeHub module to true
"edgeHub": {
    "type": "docker",
    "status": "running",
    "restartPolicy": "always",
    "settings": {
        "image": "mcr.microsoft.com/azureiotedge-hub:1.0.8",
        "createOptions": "{\"HostConfig\":{\"PortBindings\":{\"443/tcp\":[{\"HostPort\":\"443\"}],\"5671/tcp\":[{\"HostPort\":\"5671\"}],\"8883/tcp\":[{\"HostPort\":\"8883\"}]}}}"
    },
    "env": {
        "CollectMetrics": {
            "value": "true"
        }
    }
}
An InfluxDB can easily be brought online by deploying one as Edge Module.
 "influxdb": {
    "settings": {
        "image": "danielscholl/influxdb:windows-1.0.0",
        "createOptions": ""
    },
    "type": "docker",
    "version": "1.0",
    "status": "running",
    "restartPolicy": "always"
}
These metrics can now be easily graphed and viewed by Grafana also deployed as an Edge Module.
"grafana": {
    "settings": {
        "image": "danielscholl/grafana:windows-1.0.0",
        "createOptions": "{\"ExposedPorts\":{\"8080/tcp\":{}},\"HostConfig\":{\"PortBindings\":{\"8080/tcp\":[{\"HostPort\":\"8080\"}]}}}"
    },
    "type": "docker",
    "status": "running",
    "restartPolicy": "always",
    "version": "1.0"
}Metrics are available directly on the Edge Device itself. http://<edge_ip_address>:8080
The default dashboard contains the following panels
-
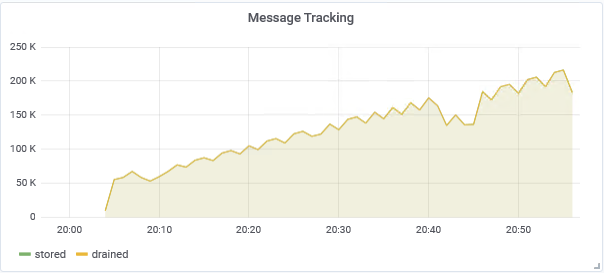
Message Tracking
Displays the total number of messages stored and drained from the internal queue.
 SELECT sum("value") FROM "autogen"."application__endpointmessagestoredcount" WHERE $timeFilter GROUP BY time(1m) fill(null)

 SELECT sum("value") FROM "autogen"."application__endpointmessagedrainedcount" WHERE $timeFilter GROUP BY time(1m) fill(null)
-
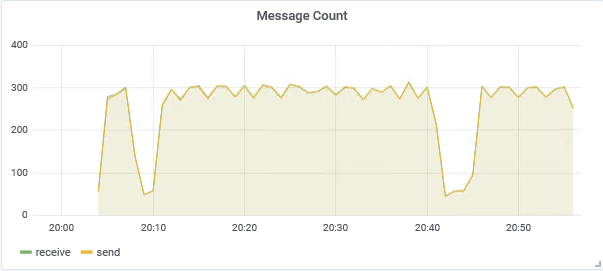
Message Count
Displays the total number of messages received and sent to the cloud.
 SELECT sum("value") FROM "autogen"."application__edgehubmessagereceivedcount" WHERE $timeFilter GROUP BY time(1m) fill(null)

 SELECT sum("value") FROM "autogen"."application__edgehubtocloudmessagesentcount" WHERE $timeFilter GROUP BY time(1m) fill(null)
-
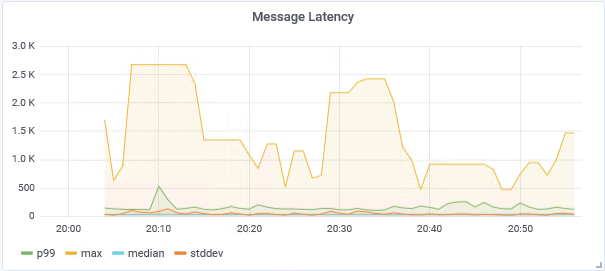
Message Latency
Displays the latency incurred sending messages to the cloud.
SELECT mean("p99") FROM "autogen"."application__edgehubtocloudmessagelatencyms" WHERE ("unit_dur" = 'ms') AND $timeFilter GROUP BY time(1m) fill(null)

SELECT mean("max") FROM "autogen"."application__edgehubtocloudmessagelatencyms" WHERE ("unit_dur" = 'ms') AND $timeFilter GROUP BY time(1m) fill(null)

SELECT mean("median") FROM "autogen"."application__edgehubtocloudmessagelatencyms" WHERE ("unit_dur" = 'ms') AND $timeFilter GROUP BY time(1m) fill(null)

SELECT mean("stddev") FROM "autogen"."application__edgehubtocloudmessagelatencyms" WHERE ("unit_dur" = 'ms') AND $timeFilter GROUP BY time(1m) fill(null)
-
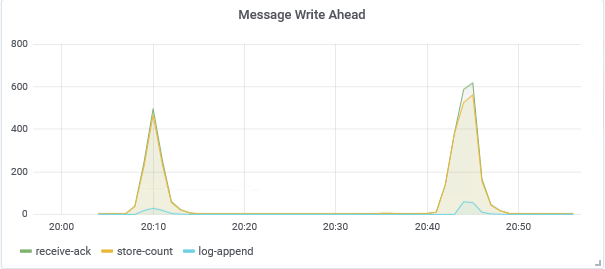
Message Write Ahead Latency
Displays the latency incurred from message received to updating the count and appending to the log.
 SELECT mean("mean") FROM "autogen"."application__endpointmessagestoredlatencyms" WHERE ("unit_dur" = 'ms') AND $timeFilter GROUP BY time(1m) fill(null)

 SELECT mean("mean") FROM "autogen"."application__messageentitystoreputorupdatelatencyms" WHERE ("unit_dur" = 'ms') AND $timeFilter GROUP BY time(1m) fill(null)

 SELECT mean("mean") FROM "autogen"."application__sequentialstoreappendlatencyms" WHERE ("unit_dur" = 'ms') AND $timeFilter GROUP BY time(1m) fill(null)
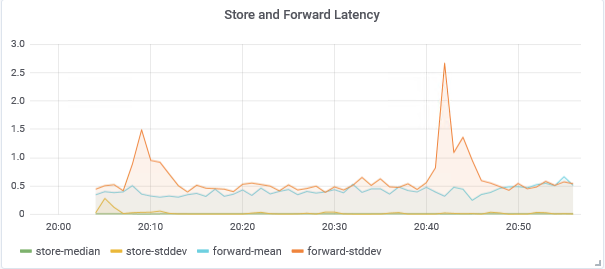
-
Store and Forward Latency
Displays the time to write and read messages from the store and forward database.
 SELECT mean("median") FROM "autogen"."application__dbputlatencyms" WHERE ("unit_dur" = 'ms') AND $timeFilter GROUP BY time(1m) fill(null)

 SELECT mean("stddev") FROM "autogen"."application__dbputlatencyms" WHERE ("unit_dur" = 'ms') AND $timeFilter GROUP BY time(1m) fill(null)

 SELECT mean("median") FROM "autogen"."application__dbgetlatencyms" WHERE ("unit_dur" = 'ms') AND $timeFilter GROUP BY time(1m) fill(null)

 SELECT mean("stddev") FROM "autogen"."application__dbgetlatencyms" WHERE ("unit_dur" = 'ms') AND $timeFilter GROUP BY time(1m) fill(null)
