A simplified way of working with Helm.
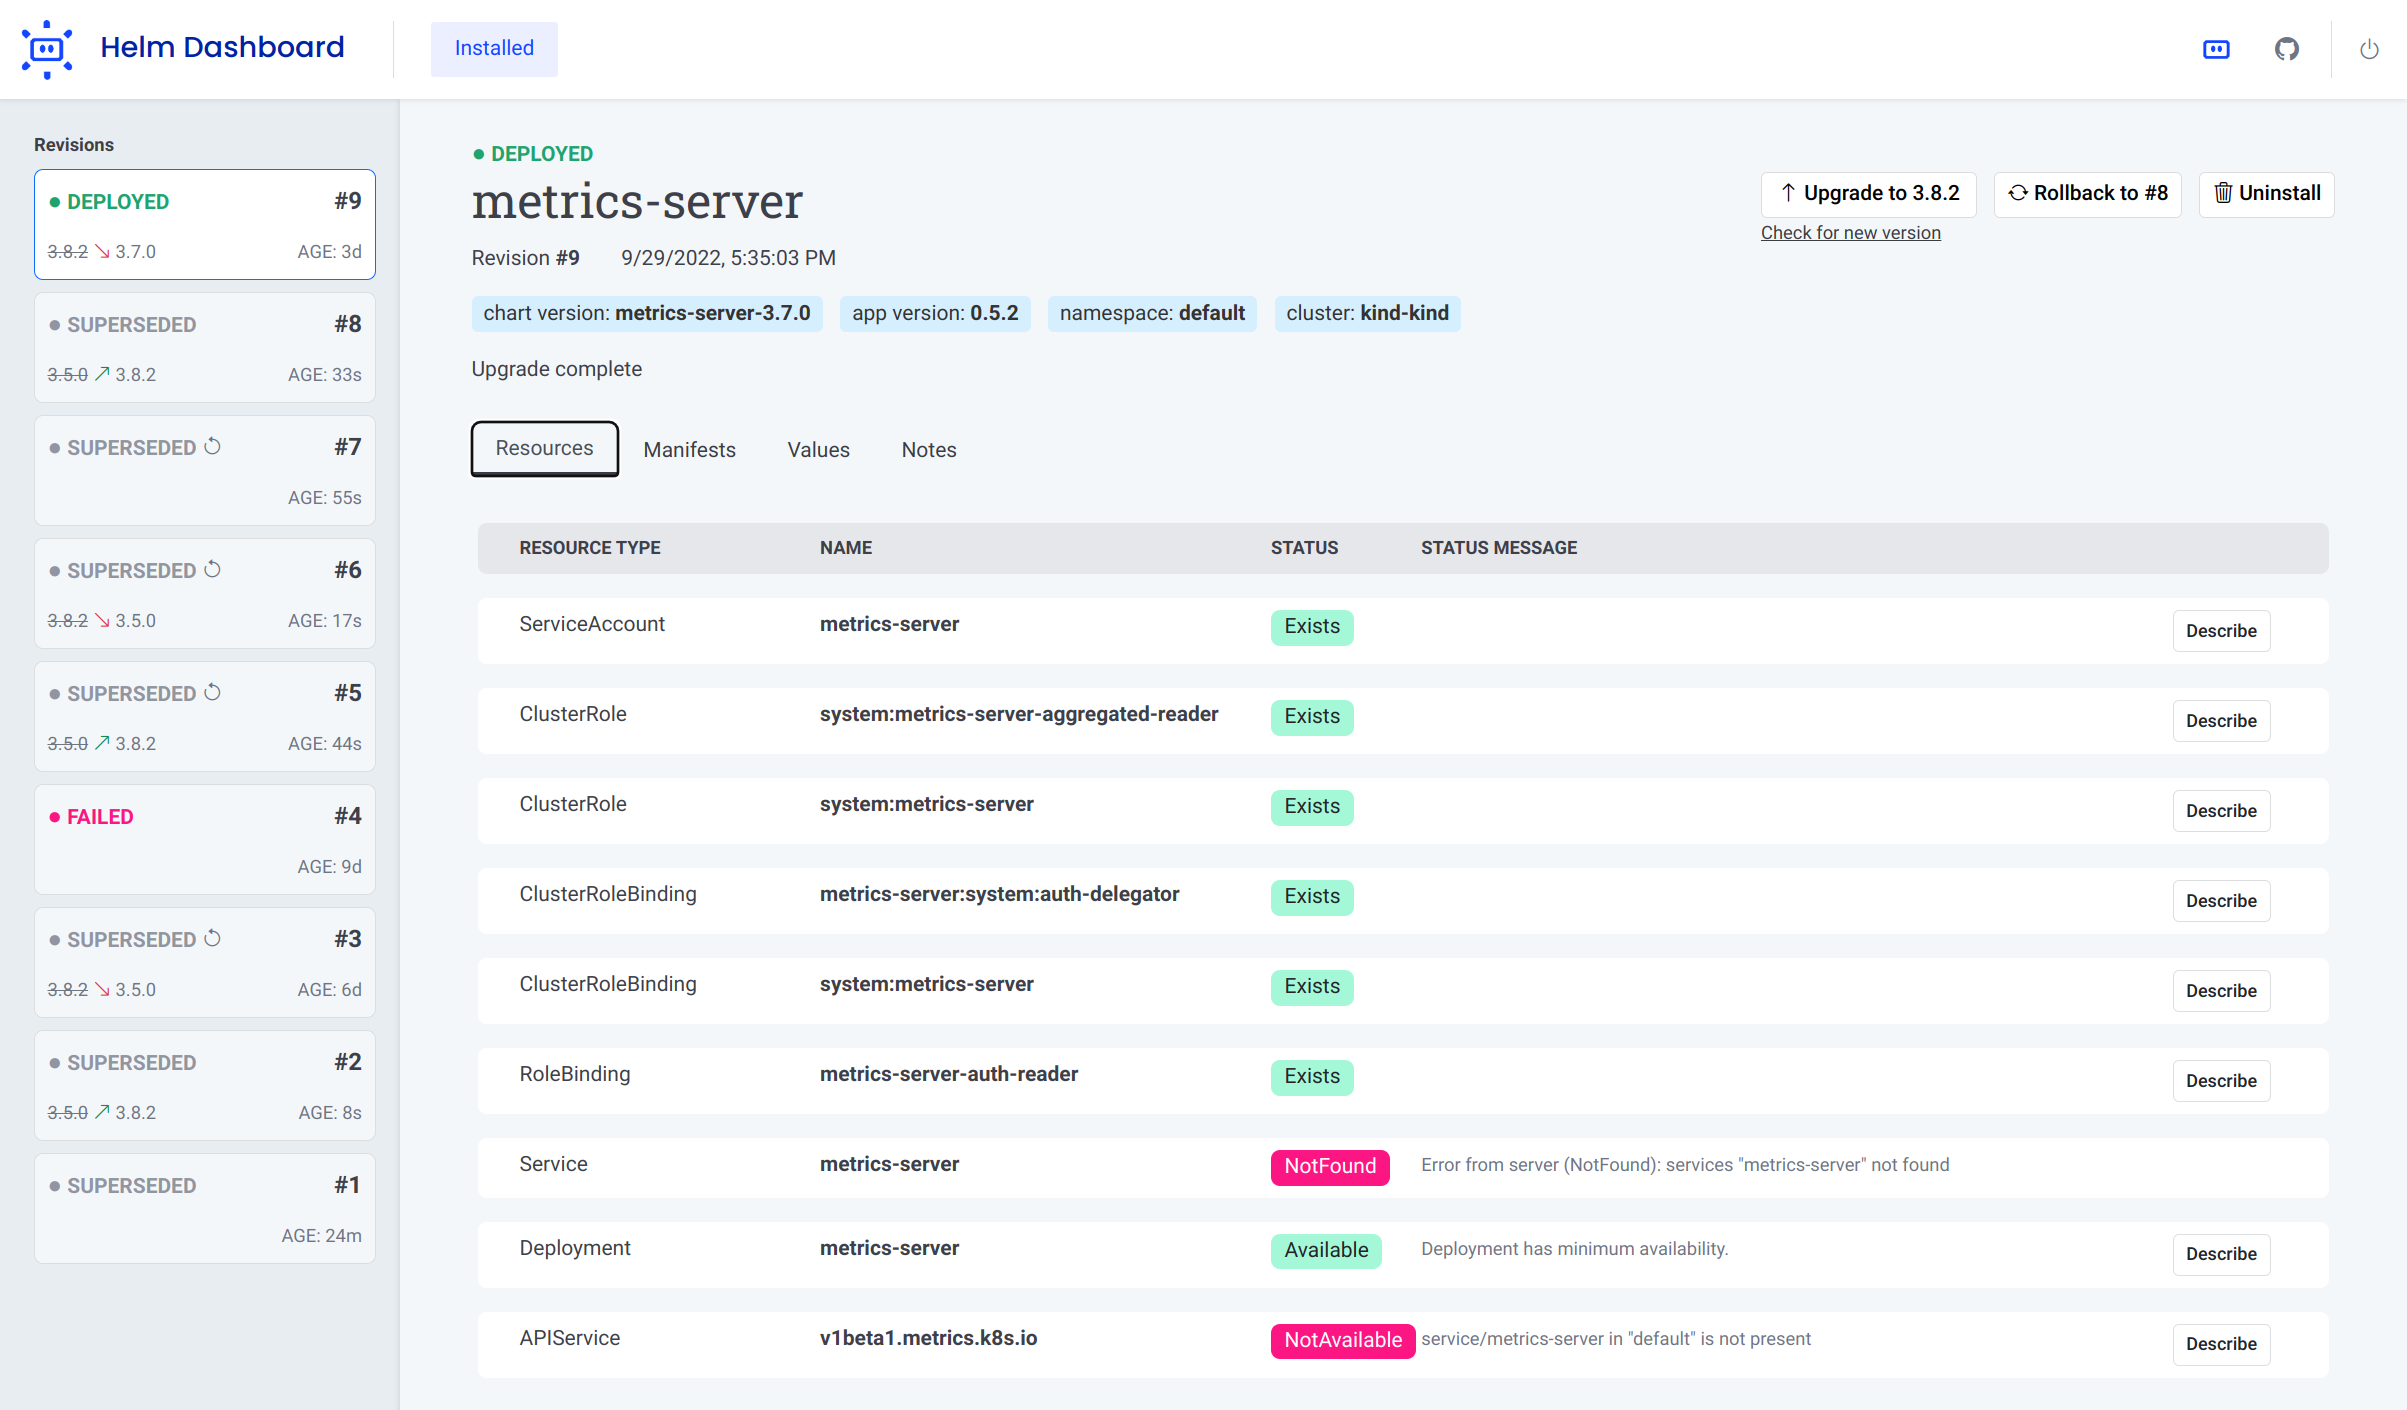
Helm Dashboard offers a UI-driven way to view the installed Helm charts, see their revision history and corresponding k8s resources. Also, you can perform simple actions like roll back to a revision or upgrade to newer version.
This project is part of Komodor's vision of helping Kubernetes users to navigate and troubleshoot their clusters, the project is NOT an offical project by the helm team.
Some of the key capabilities of the tool:
- See all installed charts and their revision history
- See manifest diff of the past revisions
- Browse k8s resources resulting from the chart
- Easy rollback or upgrade version with a clear and easy manifest diff
- Integration with popular problem scanners
- Easy switch between multiple clusters
To install the plugin, simply run Helm command:
helm plugin install https://github.com/komodorio/helm-dashboard.gitTo update the plugin to the latest version, run:
helm plugin update dashboardTo uninstall, run:
helm plugin uninstall dashboardTo use the plugin, your machine needs to have working helm and also kubectl commands. Helm version 3.4.0+ is required.
After installing, start the UI by running:
helm dashboardThe command above will launch the local Web server and will open the UI in new browser tab. The command will hang waiting for you to terminate it in command-line or web UI.
You can see the list of available command-line flags by running helm dashboard --help.
By default, the web server is only available locally. You can change that by specifying HD_BIND environment variable
to the desired value. For example, 0.0.0.0 would bind to all IPv4 addresses or [::0] would be all IPv6 addresses.
This can also be specified using flag --bind <host>, for example --bind=0.0.0.0 or --bind 0.0.0.0.
Precedence order: flag
--bind=<host>> envHD_BIND=<host>> default valuelocalhost
If your port 8080 is busy, you can specify a different port to use via --port <number> command-line flag.
If you need to limit the operations to a specific namespace, please use --namespace=... in your command-line.
If you don't want browser tab to automatically open, add --no-browser flag in your command line.
If you want to increase the logging verbosity and see all the debug info, use the --verbose flag.
Disclaimer: For the sake of improving the project quality, there is user analytics collected by the tool. You can disable this collecting with
--no-analyticsoption. The collection is done via DataDog RUM and Heap Analytics. Only the anonymous data is collected, no sensitive information is used.
The official helm chart is available here
Download the appropriate release package for your platform, unpack it and just run dashboard binary from it.
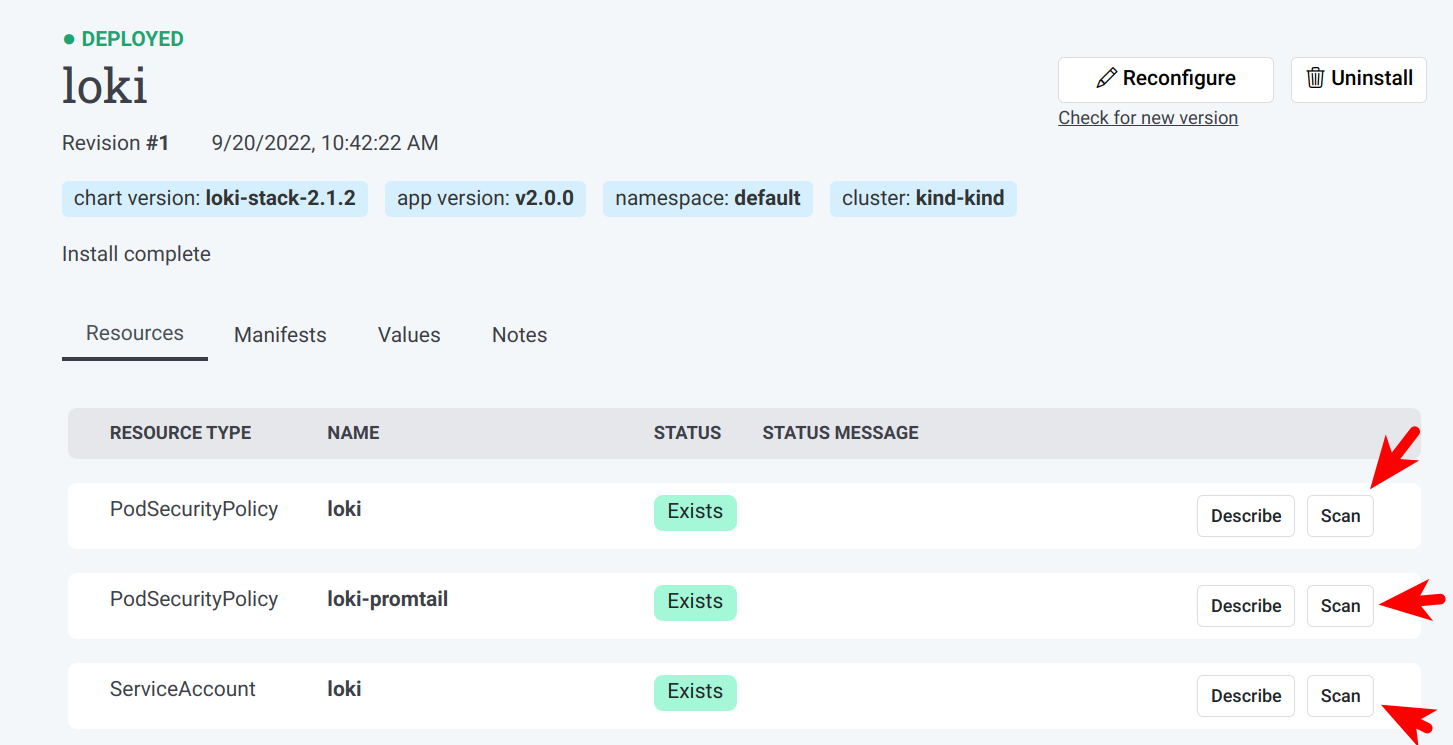
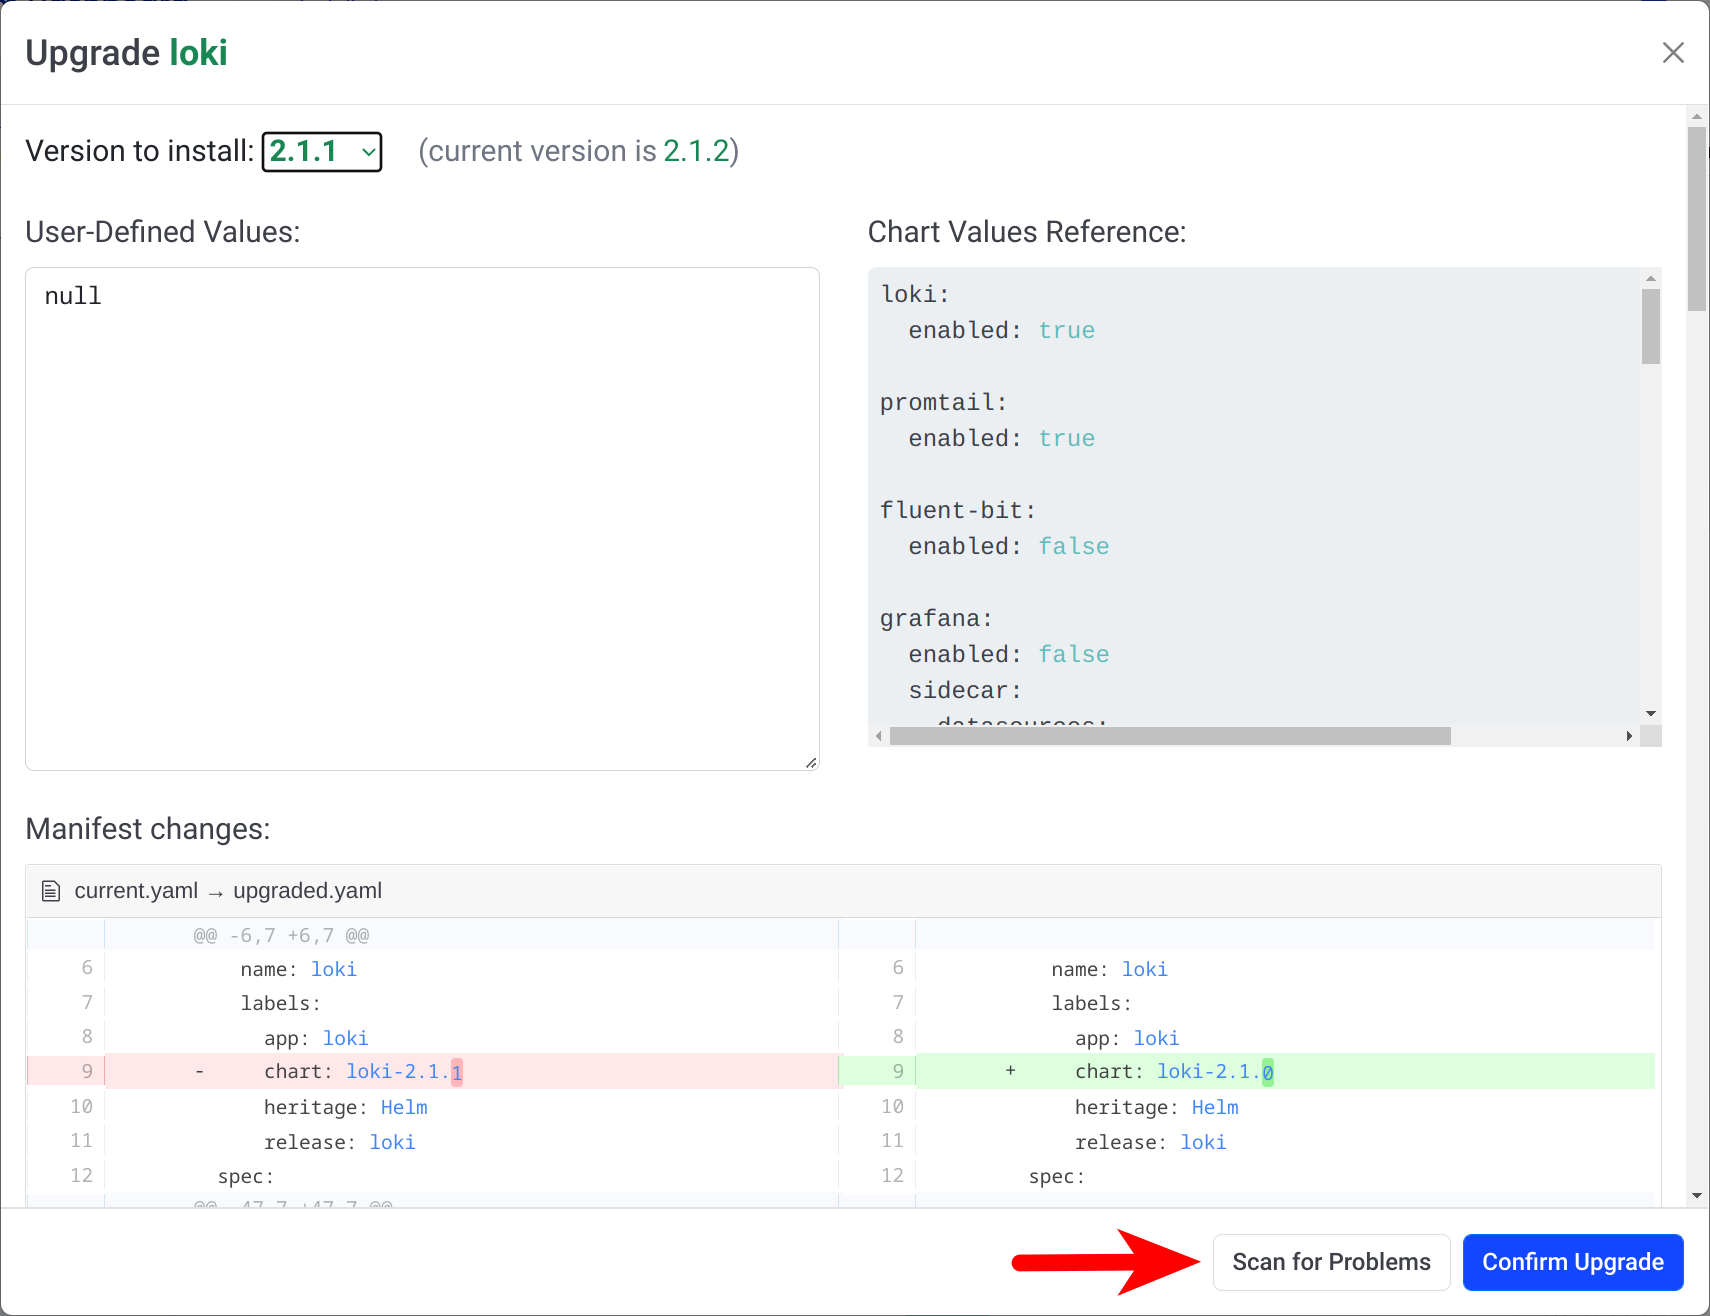
Upon startup, Helm Dashboard detects the presence of Trivy and Checkov scanners. When available, these scanners are offered on k8s resources page, as well as install/upgrade preview page.
You can request scanning of the specific k8s resource in your cluster:

If you want to validate the k8s manifest prior to installing/reconfiguring a Helm chart, look for "Scan for Problems"
button at the bottom of the dialog:

We have two main channels for supporting the Helm Dashboard users: Slack community for general conversations and GitHub issues for real bugs.
Prerequisites: helm and kubectl binaries installed and operational.
There is a need to build binary for plugin to function, run:
go build -o bin/dashboard .You can just run the bin/dashboard binary directly, it will just work.
To install, checkout the source code and run from source dir:
helm plugin install .Local installation of plugin just creates a symlink, so making the changes and rebuilding the binary would not require to reinstall a plugin.
To use the plugin, run in your terminal:
helm dashboardThen, use the web UI.
