Case study 1 for Google Data Analytics class.
In this case study, I am working as a junior data analyst for a fictional company, Cyclistic Divvy, which is a bike-share company in Chicago. In 2016, Cyclistic launched a successful bike-share offering. Since then, the program has grown to a fleet of 5,824 bicycles that are geotracked and locked into a network of 692 stations across Chicago. The bikes can be unlocked from one station and returned to any other station in the system anytime.
The director of marketing, Lily Moreno, set a clear goal: Design marketing strategies aimed at converting casual riders into annual members. In order to do that, however, the marketing analyst team needs to better understand how annual members and casual riders differ, why casual riders would buy a membership, and how digital media could affect their marketing tactics. Moreno and her team are interested in analyzing the Cyclistic historical bike trip data to identify trends.
- Data: trip data from this link.
- Analytics tool: R programming for 2 main reasons:
- The data is big (more than 1 million rows per file) so working with a spreadsheet is slowly and lagging
- Easy to reproduce the code and findings
-
Code: in the
codefolder, we have an Rmd code file. -
Some key findings are:
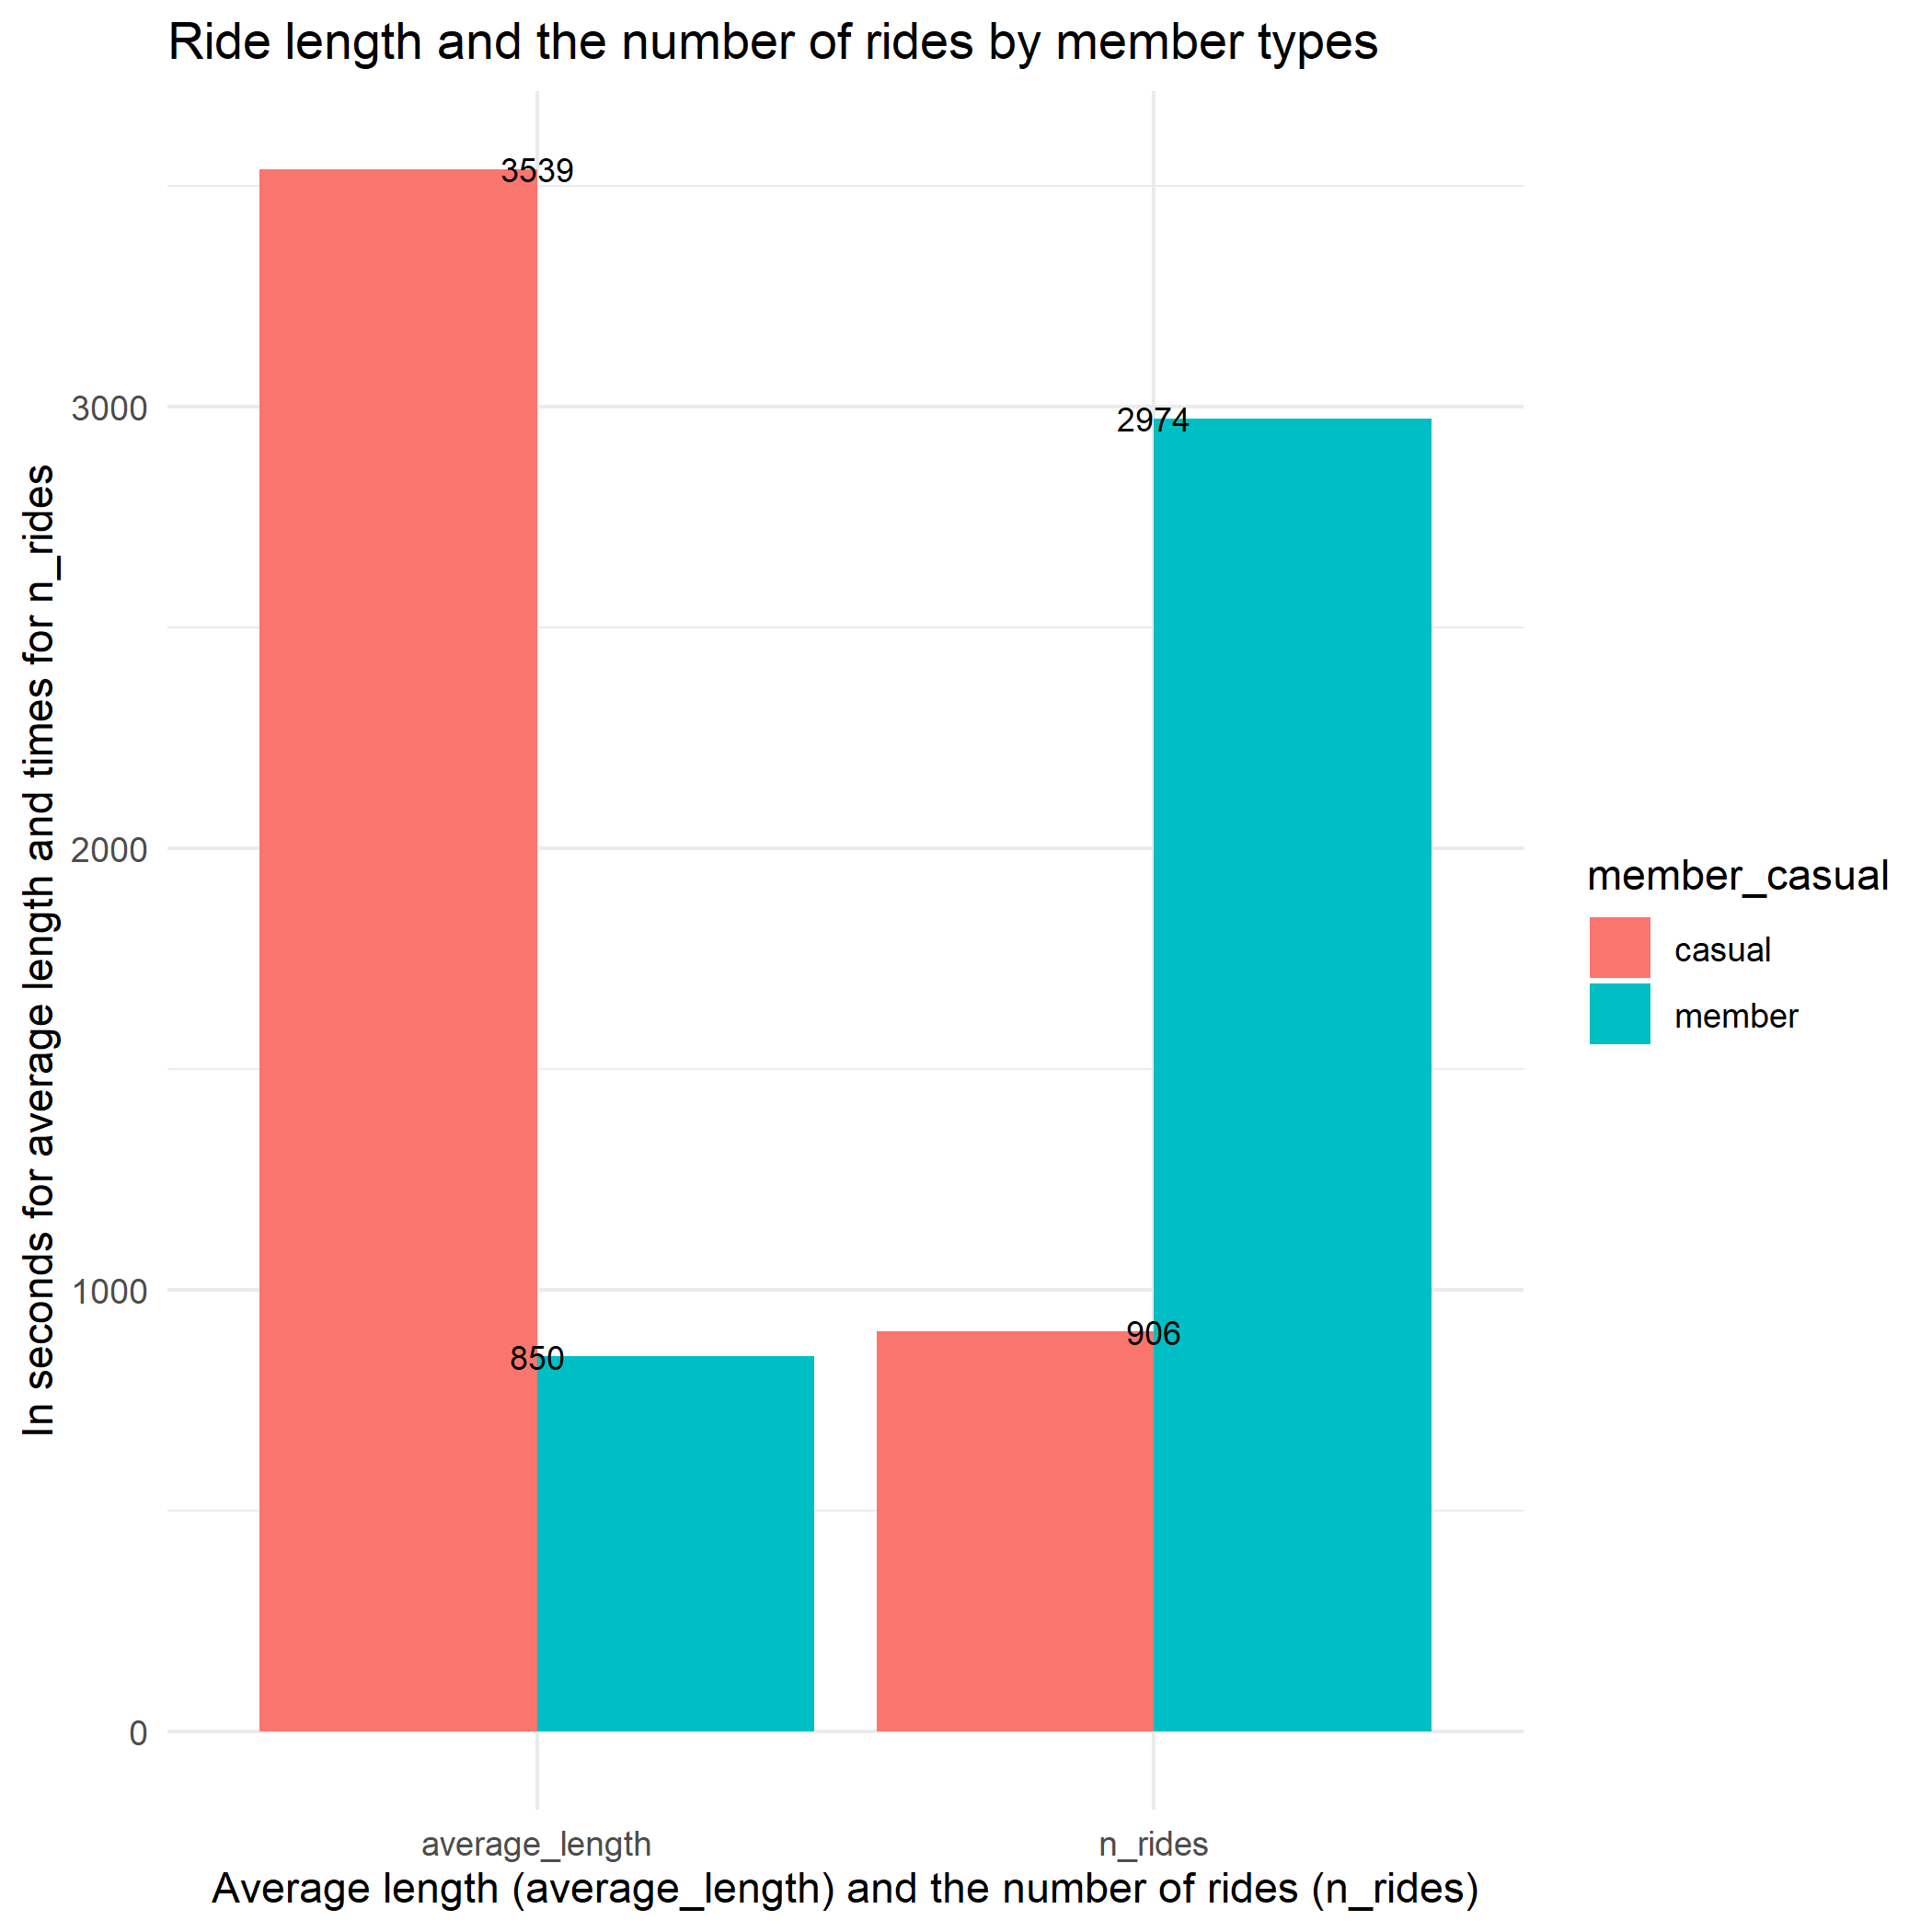
- Member and casual rides very differently in both the number of rides and ride length
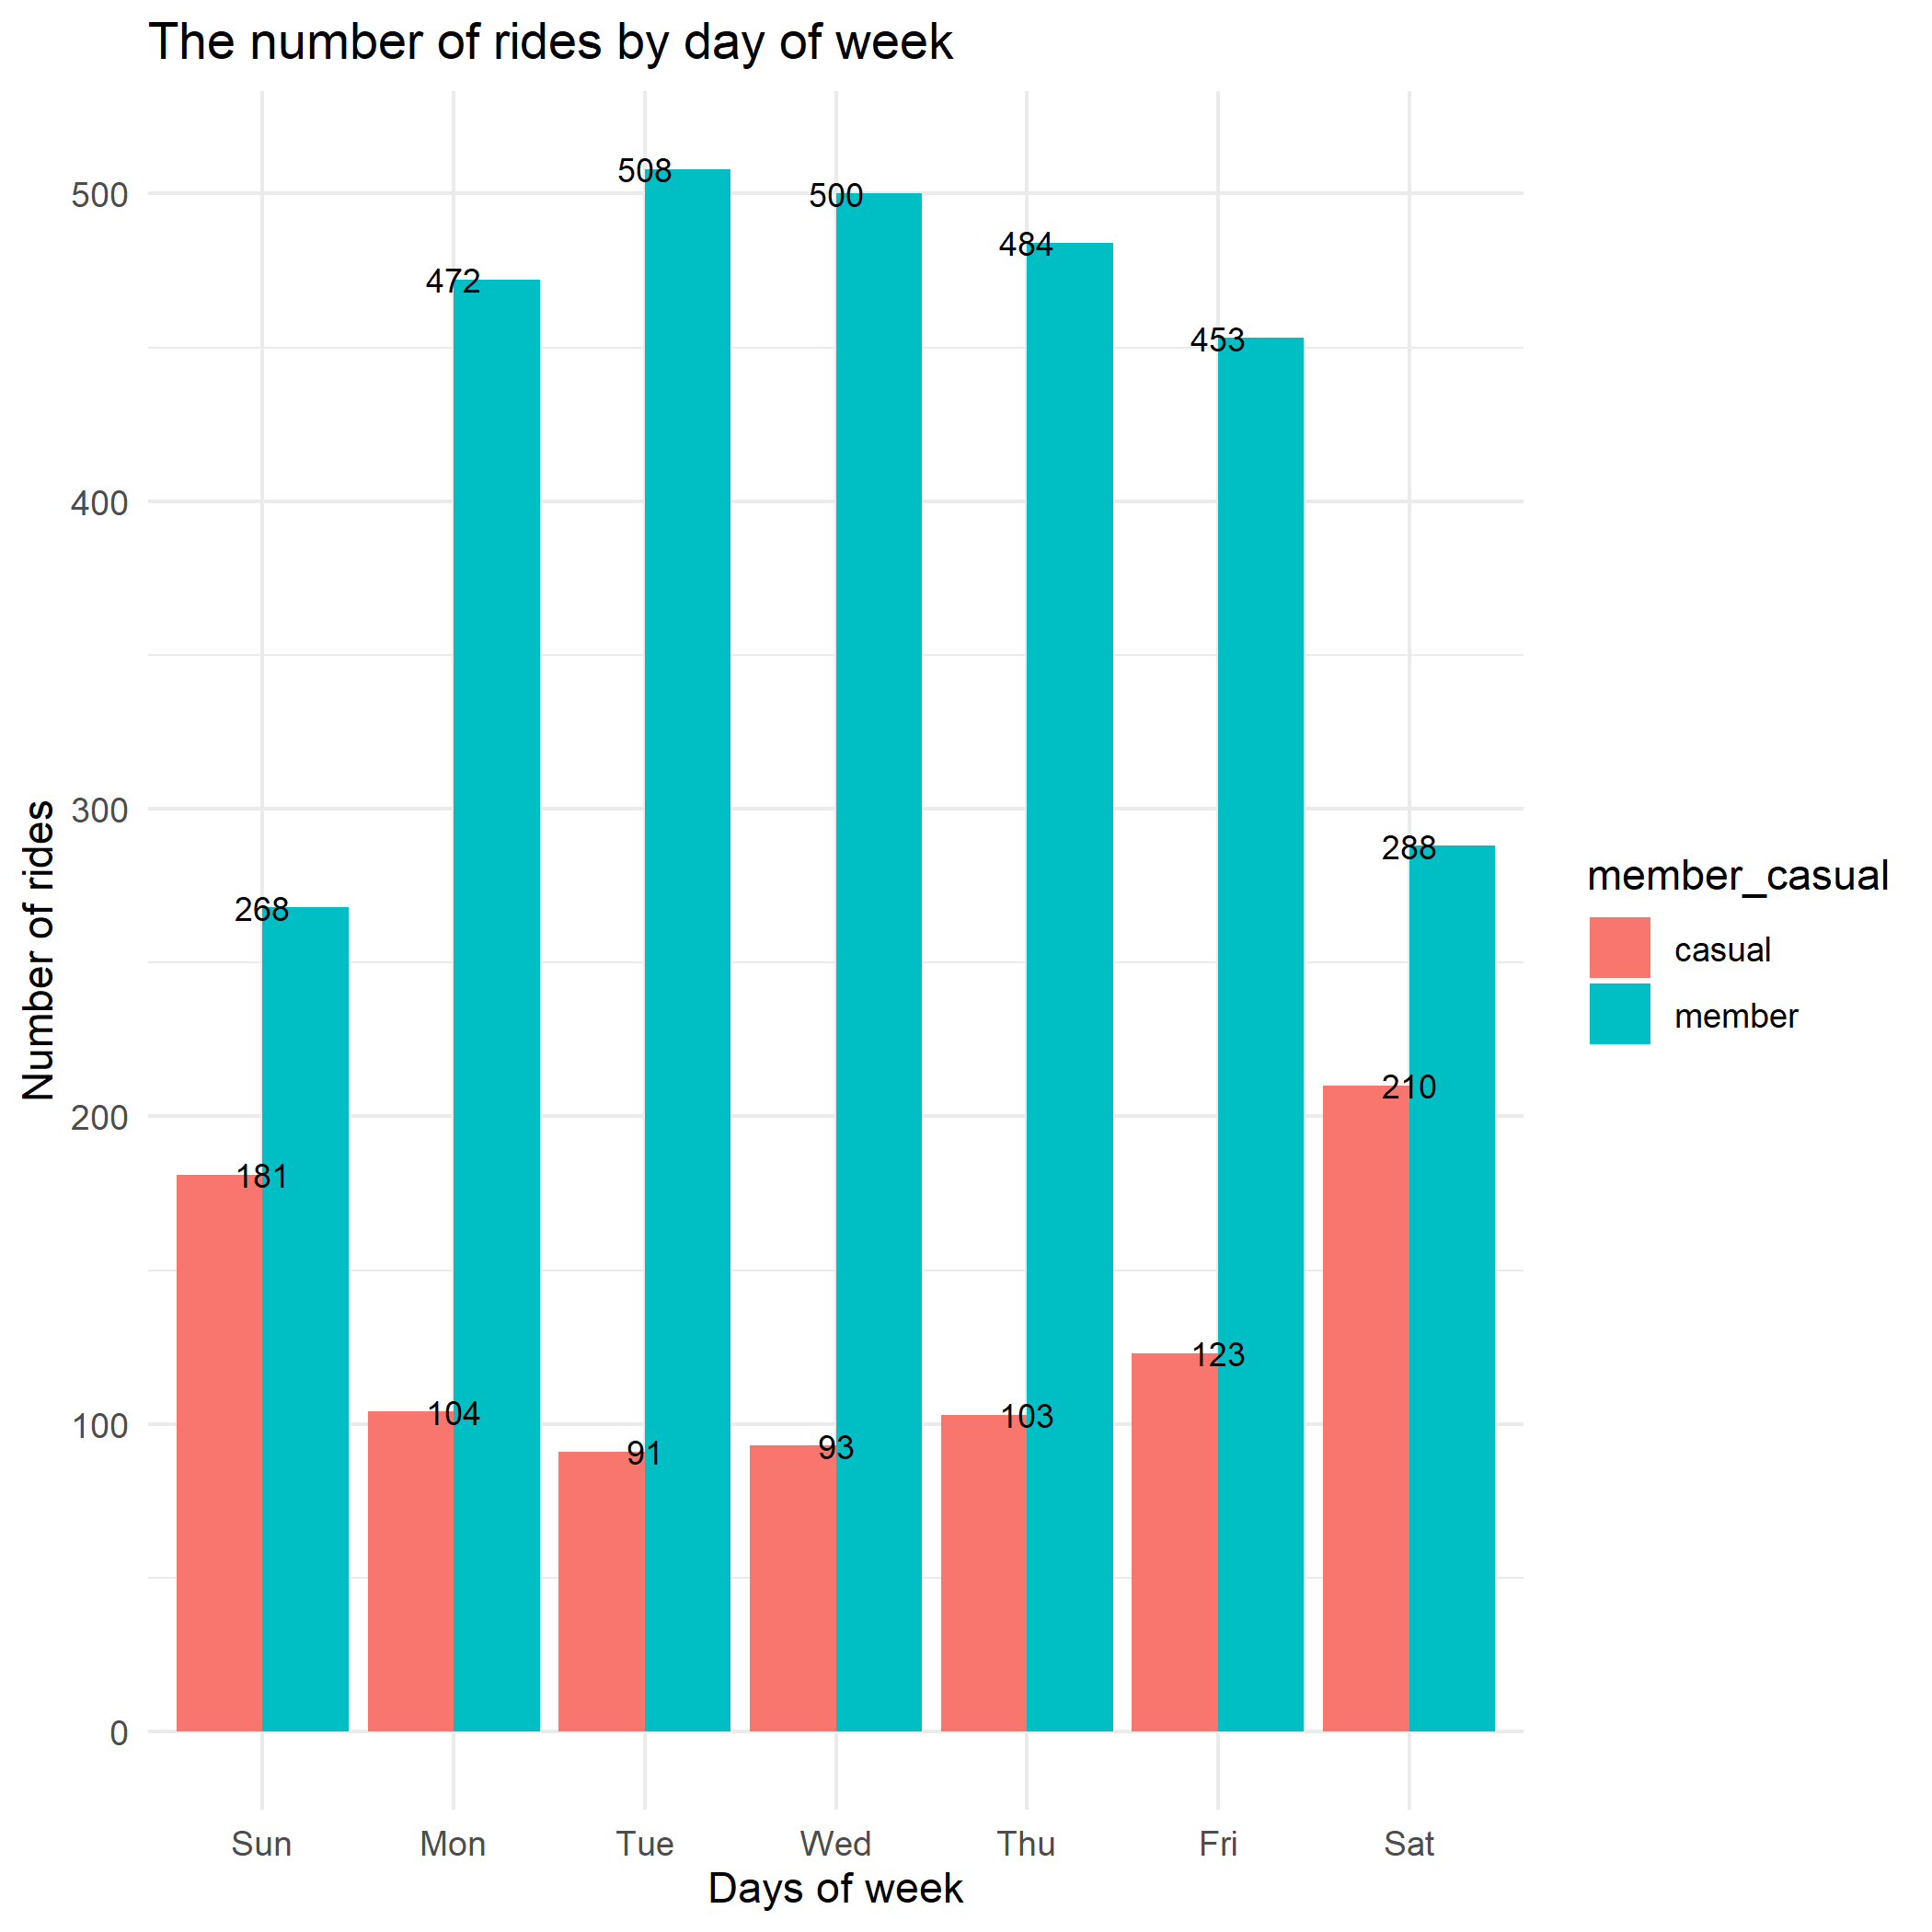
- Casual rides more often on weekend
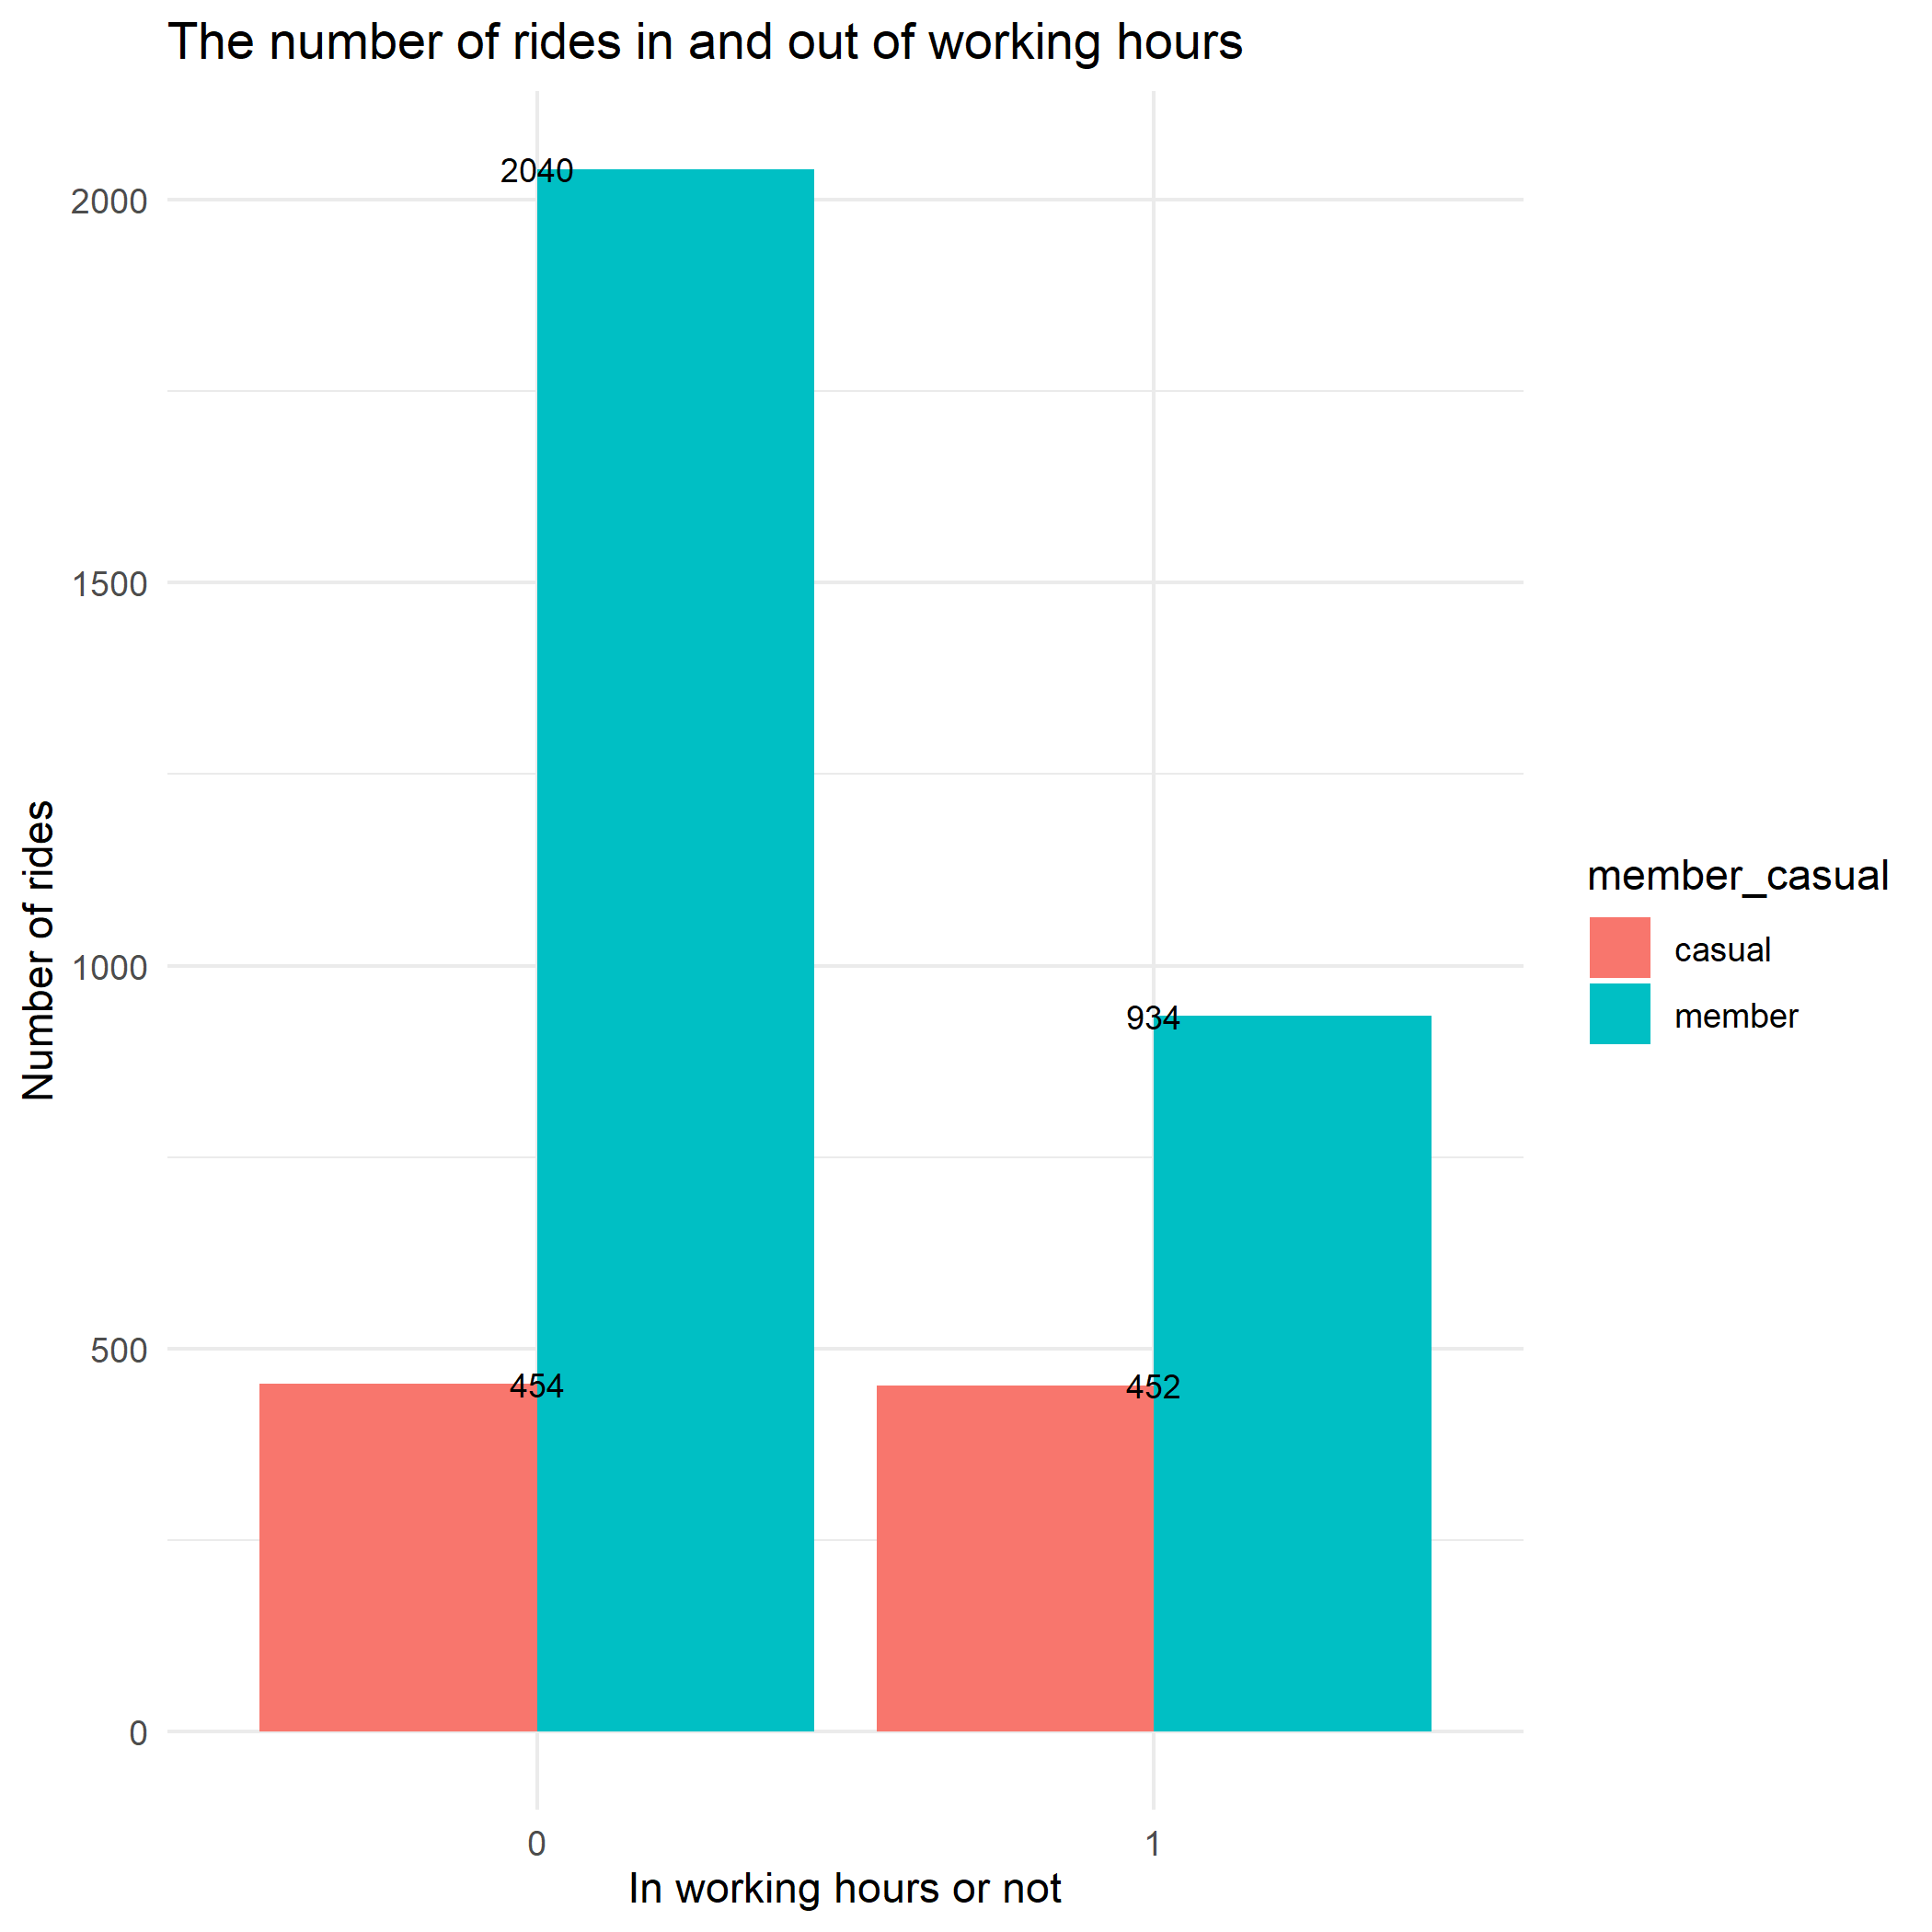
- Member rides more frequently out of working hours
- Presentation of the results: Google slide
I make a slide with three recommendations in the slide:
- Price policy regardings to balance the number of trips and ride length
- E.g., cheaper unit price for long ride length for member
- Should have price-difference policy for weekend
- E.g., cheaper unit price for member on weekend to encourage membership from casual
- Should have price-difference policy for working hours
- E.g., higher unit price for working hours when high demand
- Dien Giau Bui (Richard)
- Email: buidiengiau@gmail.com


