[HELP] duckplyr Benchmarking Comparison
Opened this issue · 6 comments
I was at Posit Conf when I learned about duckplyr and this package is awesome! I'm looking forward to developing with it and thanks to the DuckDB Labs team for spearheading this initiative.
I ran some benchmarks to compare speed across a few ETL approaches using dplyr, arrow, duckdb, arrow::to_duckdb(), and duckplyr. I assume the reason for the slower ETL speeds using duckplyr boils down to user error 🙋♂️ but having said that, I'd appreciate any insight if my duckplyr setup and/or application is flawed in some way.
Any pointers would help, thank you! Below is the code that I used to benchmark performance including the plots generated by autoplot(bnch):
# Load Libraries ----------------------------------------------------------

require(here)
library(arrow)
library(dplyr)
library(stringr)
library(tictoc)
library(duckplyr)
library(ggplot2)


# Download Data -----------------------------------------------------------

# Download 40GB (1.1 billion rows) of NYC Taxi rides
# NOTE: This may take several hours
data_path <- here::here("data/nyc-taxi")

open_dataset("s3://voltrondata-labs-datasets/nyc-taxi") |>
  filter(year %in% 2012:2021) |>
  write_dataset(data_path, partitioning = c("year", "month"))


# Subset & Benchmark ------------------------------------------------------

# Manually iterated over the code below to benchmark
# and compare performance on 1 million, 10 million, 100
# million, and 500 million rows
nyc_taxi_tibble <- open_dataset("data/nyc-taxi") |>
  dplyr::select(year, passenger_count) |>
  dplyr::collect() |>
  dplyr::slice_sample(n = 500000000)

nyc_taxi <- nyc_taxi_tibble |>
  arrow::as_arrow_table()

nyc_taxi_duckplyr_df <- nyc_taxi_tibble |>
  duckplyr::as_duckplyr_df()

tic()
bnch <- bench::mark(
  min_iterations = 50,
  tibble_to_arrow = nyc_taxi_tibble |>
    arrow::as_arrow_table() |>
    dplyr::filter(passenger_count > 1) |>
    dplyr::group_by(year) |>
    dplyr::summarise(
      all_trips = n(),
      shared_trips = sum(passenger_count, na.rm = T)
    ) |>
    dplyr::mutate(pct_shared = shared_trips / all_trips * 100) |>
    dplyr::collect(),
  tibble_to_duckplyr = nyc_taxi_tibble |>
    duckplyr::as_duckplyr_df() |>
    duckplyr::filter(passenger_count > 1) |>
    duckplyr::summarise(
      all_trips = n(),
      shared_trips = sum(passenger_count, na.rm = T),
      .by = year
      ) |>
    duckplyr::mutate(pct_shared = shared_trips / all_trips * 100),
  tibble_to_dplyr = nyc_taxi_tibble |>
    dplyr::filter(passenger_count > 1) |>
    dplyr::group_by(year) |>
    dplyr::summarise(all_trips = n(),
                     shared_trips = sum(passenger_count, na.rm = T)) |>
    dplyr::mutate(pct_shared = shared_trips / all_trips * 100),
  arrow_table = nyc_taxi |>
    dplyr::filter(passenger_count > 1) |>
    dplyr::group_by(year) |>
    dplyr::summarise(
      all_trips = n(),
      shared_trips = sum(passenger_count, na.rm = T)
    ) |>
    dplyr::mutate(pct_shared = shared_trips / all_trips * 100) |>
    dplyr::collect(),
  arrow_to_duckdb = nyc_taxi |>
    arrow::to_duckdb() |>
    dplyr::filter(passenger_count > 1) |>
    dplyr::group_by(year) |>
    dplyr::summarise(
      all_trips = n(),
      shared_trips = sum(passenger_count, na.rm = T)
    ) |>
    dplyr::mutate(pct_shared = shared_trips / all_trips * 100) |>
    dplyr::collect(),
  duckplyr_df = nyc_taxi_duckplyr_df |>
    duckplyr::filter(passenger_count > 1) |>
    duckplyr::summarise(
      all_trips = n(),
      shared_trips = sum(passenger_count, na.rm = T),
      .by = year
    ) |>
    duckplyr::mutate(pct_shared = shared_trips / all_trips * 100),
  check = FALSE
)
toc()

autoplot(bnch)

# Session Info ------------------------------------------------------------

sessionInfo()

R version 4.3.1 Patched (2023-08-09 r84925)
Platform: aarch64-apple-darwin20 (64-bit)
Running under: macOS Sonoma 14.0

Matrix products: default
BLAS:   /System/Library/Frameworks/Accelerate.framework/Versions/A/Frameworks/vecLib.framework/Versions/A/libBLAS.dylib
LAPACK: /Library/Frameworks/R.framework/Versions/4.3-arm64/Resources/lib/libRlapack.dylib;  LAPACK version 3.11.0

locale:
[1] en_US.UTF-8/en_US.UTF-8/en_US.UTF-8/C/en_US.UTF-8/en_US.UTF-8

time zone: America/Los_Angeles
tzcode source: internal

attached base packages:
[1] stats     graphics  grDevices utils     datasets  methods   base

other attached packages:
[1] ggplot2_3.4.3  duckplyr_0.2.1 tictoc_1.2     stringr_1.5.0  dplyr_1.1.3    arrow_13.0.0

loaded via a namespace (and not attached):
 [1] bit_4.0.5         gtable_0.3.4      compiler_4.3.1    tidyselect_1.2.0  assertthat_0.2.1
 [6] scales_1.2.1      here_1.0.1        R6_2.5.1          generics_0.1.3    tibble_3.2.1
[11] munsell_0.5.0     rprojroot_2.0.3   DBI_1.1.3         pillar_1.9.0      rlang_1.1.1
[16] utf8_1.2.3        stringi_1.7.12    bit64_4.0.5       cli_3.6.1         withr_2.5.0
[21] magrittr_2.0.3    grid_4.3.1        rstudioapi_0.15.0 lifecycle_1.0.3   vctrs_0.6.3
[26] bench_1.1.3       glue_1.6.2        duckdb_0.8.1-3    collections_0.3.7 fansi_1.0.4
[31] colorspace_2.1-0  purrr_1.0.2       tools_4.3.1       pkgconfig_2.0.3
1 million rows
10 million rows
100 million rows
500 million rows
Thanks for the benchmark!
This looks like a case where we don't support particular semantics but fall back to R instead. What happens if you change the code to sum() without na.rm = TRUE ?
options(conflicts.policy = list(warn = FALSE))

library(duckplyr)

options(duckdb.materialize_message = TRUE)
Sys.setenv(DUCKPLYR_FALLBACK_INFO = TRUE)

data.frame(a = 1:3, b = as.integer(c(1, 1, 2))) |>
  as_duckplyr_df() |>
  summarize(sum(a, na.rm = TRUE), .by = b)
#> Error processing with relational.
#> Caused by error:
#> ! Binder Error: No function matches the given name and argument types 'sum(INTEGER, BOOLEAN)'. You might need to add explicit type casts.
#>  Candidate functions:
#>  sum(DECIMAL) -> DECIMAL
#>  sum(SMALLINT) -> HUGEINT
#>  sum(INTEGER) -> HUGEINT
#>  sum(BIGINT) -> HUGEINT
#>  sum(HUGEINT) -> HUGEINT
#>  sum(DOUBLE) -> DOUBLE
#>   b sum(a, na.rm = TRUE)
#> 1 1                    3
#> 2 2                    3

data.frame(a = 1:3, b = as.integer(c(1, 1, 2))) |>
  as_duckplyr_df() |>
  summarize(sum(a), .by = b)
#> materializing:
#> ---------------------
#> --- Relation Tree ---
#> ---------------------
#> Aggregate [b, sum(a)]
#>   r_dataframe_scan(0x10daa72c8)
#>
#> ---------------------
#> -- Result Columns  --
#> ---------------------
#> - b (INTEGER)
#> - sum(a) (HUGEINT)
#>
#>   b sum(a)
#> 1 2      3
#> 2 1      3
Created on 2023-10-15 with reprex v2.0.2
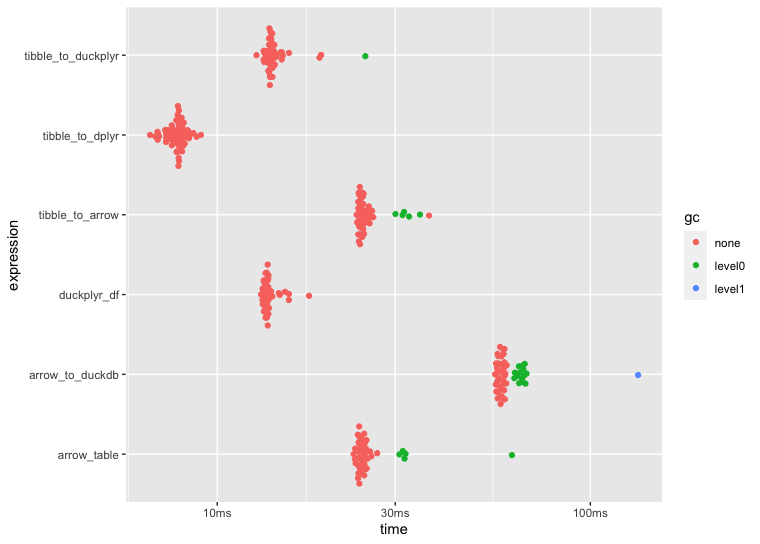
@krlmlr This was definitely the fix and you can see below the significantly improved performance with duckplyr, thank you! 🚀 Below is the revised bench::mark() code including updated benchmark plots that remove na.rm = TRUE from sum() and completing the duckplyr pipelines with duckplyr::collect() for consistency across all approaches (returning the results as tibbles).
There are (often) times where I want to keep NAs in my data without removing them in some upstream operation... In the future, if duckplyr could support na.rm within base R summary statistics functions (e.g., sum, mean, min, max, including their row- and column-wise variants), that'd be a huge win. But either way, this is excellent and thanks for clarifying! 🙏
tic()
bnch <- bench::mark(
  min_iterations = 50,
  tibble_to_arrow = nyc_taxi_tibble |>
    arrow::as_arrow_table() |>
    dplyr::filter(passenger_count > 1) |>
    dplyr::group_by(year) |>
    dplyr::summarise(
      all_trips = n(),
      shared_trips = sum(passenger_count, na.rm = T)
    ) |>
    dplyr::mutate(pct_shared = shared_trips / all_trips * 100) |>
    dplyr::collect(),
  tibble_to_duckplyr = nyc_taxi_tibble |>
    duckplyr::as_duckplyr_df() |>
    duckplyr::filter(passenger_count > 1) |>
    duckplyr::summarise(
      all_trips = n(),
      shared_trips = sum(passenger_count),
      .by = year
      ) |>
    duckplyr::mutate(pct_shared = shared_trips / all_trips * 100) |>
    duckplyr::collect(),
  tibble_to_dplyr = nyc_taxi_tibble |>
    dplyr::filter(passenger_count > 1) |>
    dplyr::group_by(year) |>
    dplyr::summarise(all_trips = n(),
                     shared_trips = sum(passenger_count, na.rm = T)) |>
    dplyr::mutate(pct_shared = shared_trips / all_trips * 100),
  arrow_table = nyc_taxi |>
    dplyr::filter(passenger_count > 1) |>
    dplyr::group_by(year) |>
    dplyr::summarise(
      all_trips = n(),
      shared_trips = sum(passenger_count, na.rm = T)
    ) |>
    dplyr::mutate(pct_shared = shared_trips / all_trips * 100) |>
    dplyr::collect(),
  arrow_to_duckdb = nyc_taxi |>
    arrow::to_duckdb() |>
    dplyr::filter(passenger_count > 1) |>
    dplyr::group_by(year) |>
    dplyr::summarise(
      all_trips = n(),
      shared_trips = sum(passenger_count, na.rm = T)
    ) |>
    dplyr::mutate(pct_shared = shared_trips / all_trips * 100) |>
    dplyr::collect(),
  duckplyr_df = nyc_taxi_duckplyr_df |>
    duckplyr::filter(passenger_count > 1) |>
    duckplyr::summarise(
      all_trips = n(),
      shared_trips = sum(passenger_count),
      .by = year
    ) |>
    duckplyr::mutate(pct_shared = shared_trips / all_trips * 100) |>
    duckplyr::collect(),
  check = FALSE
)
toc()

autoplot(bnch)
1 million rows
![]()
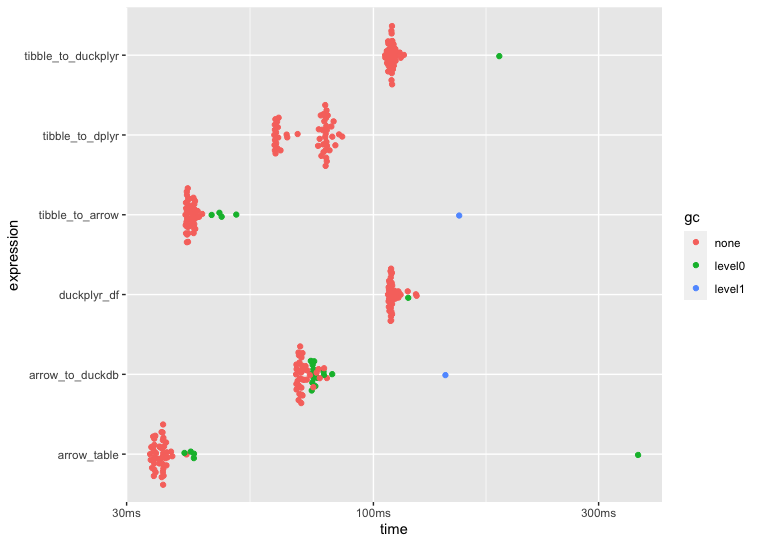
10 million rows
![]()
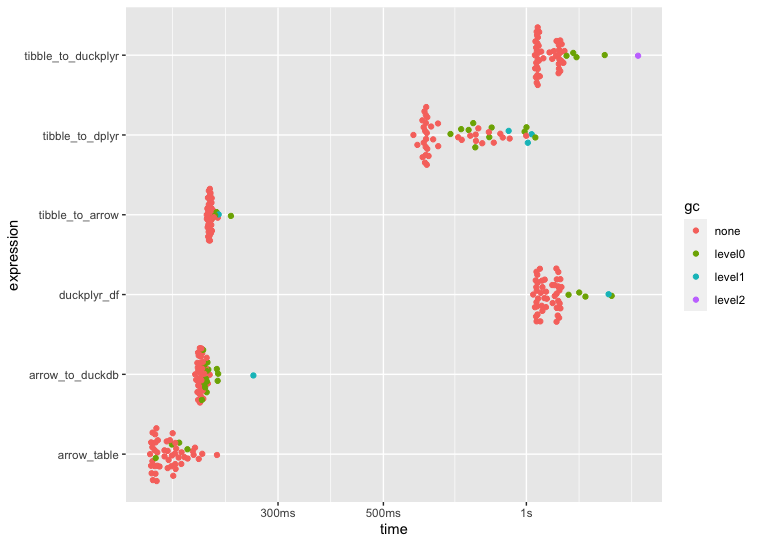
100 million rows
![]()
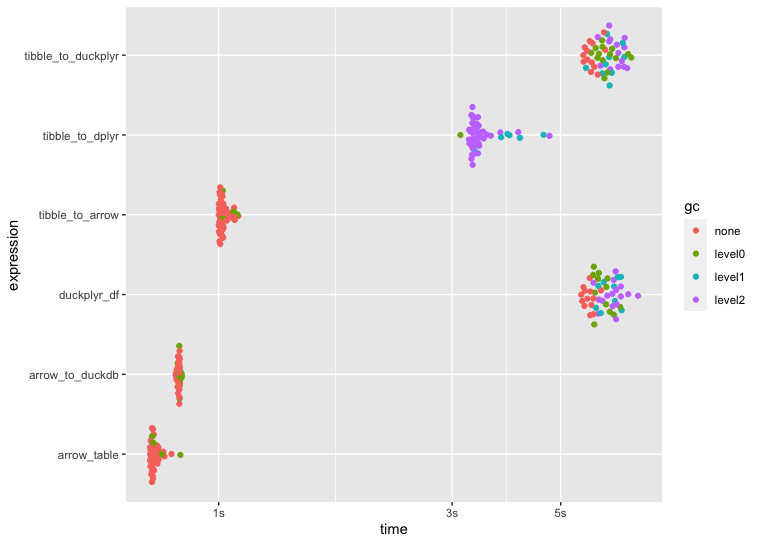
500 million rows
![]()
And a quick follow-up... Typically you wouldn't care about NAs if you're summarise()-ing, however, I often find myself piping grouped data into a calc like summarise(count_na = sum(is.na(x)) that also includes other summary calcs. With the code that I shared above, I had to remove those NAs in the upstream filter(), but it'd be great to not have to do this with duckplyr. Thanks again.
Thanks for the follow-up! Supporting sum(na.rm = TRUE) is definitely on our agenda.