Dr. Memory is a memory monitoring tool capable of identifying memory-related programming errors such as accesses of uninitialized memory, accesses to unaddressable memory (including outside of allocated heap units and heap underflow and overflow), accesses to freed memory, double frees, memory leaks, and (on Windows) handle leaks, GDI API usage errors, and accesses to un-reserved thread local storage slots.
Dr. Memory operates on unmodified application binaries running on Windows, Linux, Mac, or Android on commodity IA-32, AMD64, and ARM hardware.
Dr. Memory is released under an LGPL license and binary packages are available for download.
Dr. Memory is built on the DynamoRIO dynamic instrumentation tool plaform.
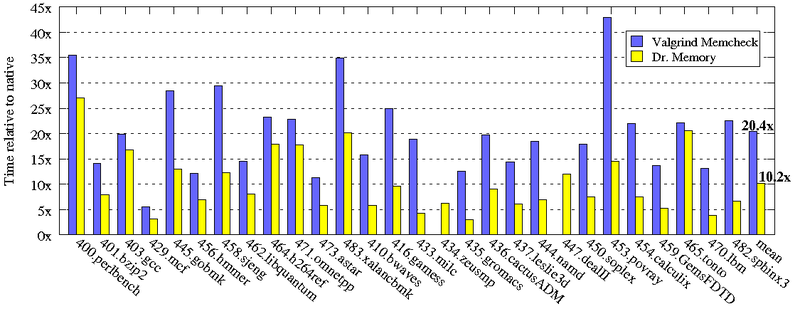
Dr. Memory is faster than comparable tools, including Valgrind, as shown in our CGO 2011 paper Practical Memory Checking with Dr. Memory, where we compare the two tools on Linux on the SPECCPU 2006 benchmark suite:
(Valgrind is unable to run 434.zeusmp and 447.dealII).
Documentation is included in the release package. We also maintain a copy for online browsing.
The Dr. Memory package includes an "strace for Windows" tool called
drstrace.
Dr. Memory has its own discussion list.
To report a bug, use the issue tracker.
See also the Dr. Memory home page: http://drmemory.org/

