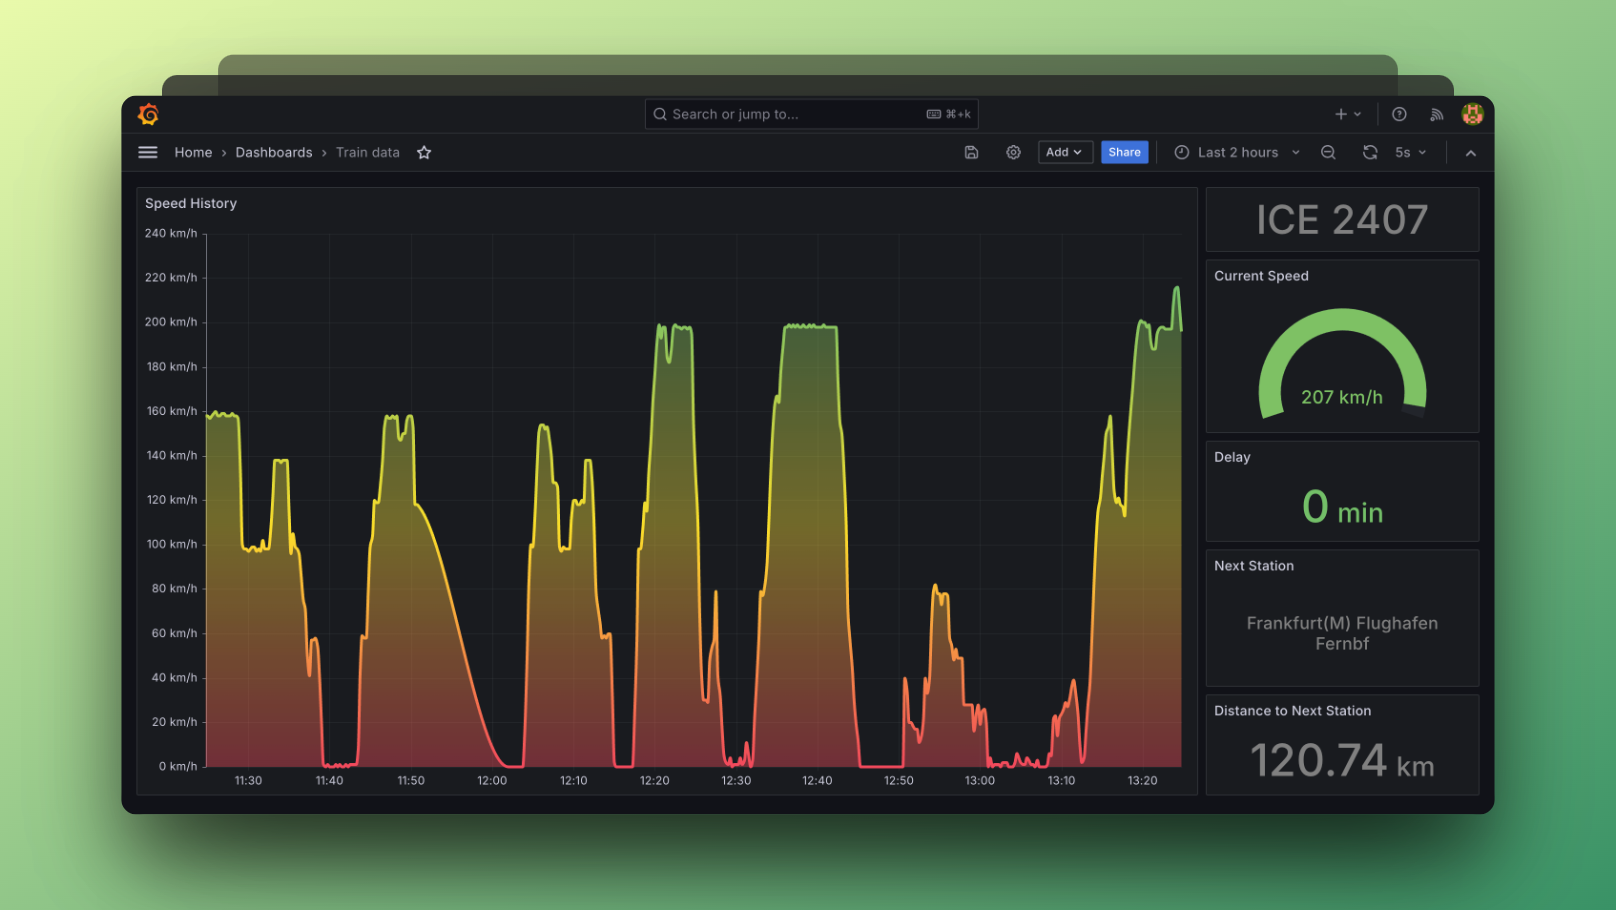
This repository allows to visualize data of the current trip when travelling on board of a DB train. It visualizes speed and delay and displays information about the current train and next station.
Note
You must be connected to a WIFIonICE network in order for this
repository to work since it fetches all relevant information from
DB Onboard APIs.
- Docker
- Connection to
WIFIonICEnetwork
Tip
Since bandwidth on trains is limited, it is recommended to pull all
necessary Docker images prior to boarding the train. Just clone the
repository and run docker compose build && docker compose pull.
- Clone the repository
- Run
docker compose up -d - Open Grafana at http://localhost:9772 in your browser
- Login with default credentials (
admin/admin) - Add a new Prometheus data source
- Prometheus server URL:
http://prometheus:9090
- Prometheus server URL:
- Add a new dashboard
- Select New > Import
- Paste the contents from grafana-dashboard.json
- Select the Prometheus data source
If your dashboard doesn't receive any data make sure that you are really connected to the ICE Wifi and that you can access iceportal.de in your browser.
You can also check for connection problems by running
docker compose logs -f bridge. The logs should show failed requests
to fetch JSON from https://iceportal.de/api1/rs/status
and https://iceportal.de/api1/rs/tripInfo/trip.
Unfortunately, the connection to the DB Onboard API is not very stable and may not always work.
- Prometheus as data source
- Grafana for visualization
- Python script as bridge between DB Onboard API and Prometheus
- Docker for containerization
