This repository houses the coursework divided into four key segments: Property Graphs (utilizing Neo4j), Distributed Graphs (leveraging Pregel), Knowledge Graphs (employing GraphDB), and a culminating project that integrates these graph databases for machine learning applications.
The dataset originates from DBLP. To align with the course's toolset, the data undergoes preprocessing to synthetically generate certain fields like citations, abstracts, and keywords. The preprocessing code is available in the preprocessing.ipynb file within the property graphs directory. The preprocessed data resides in the data folder.
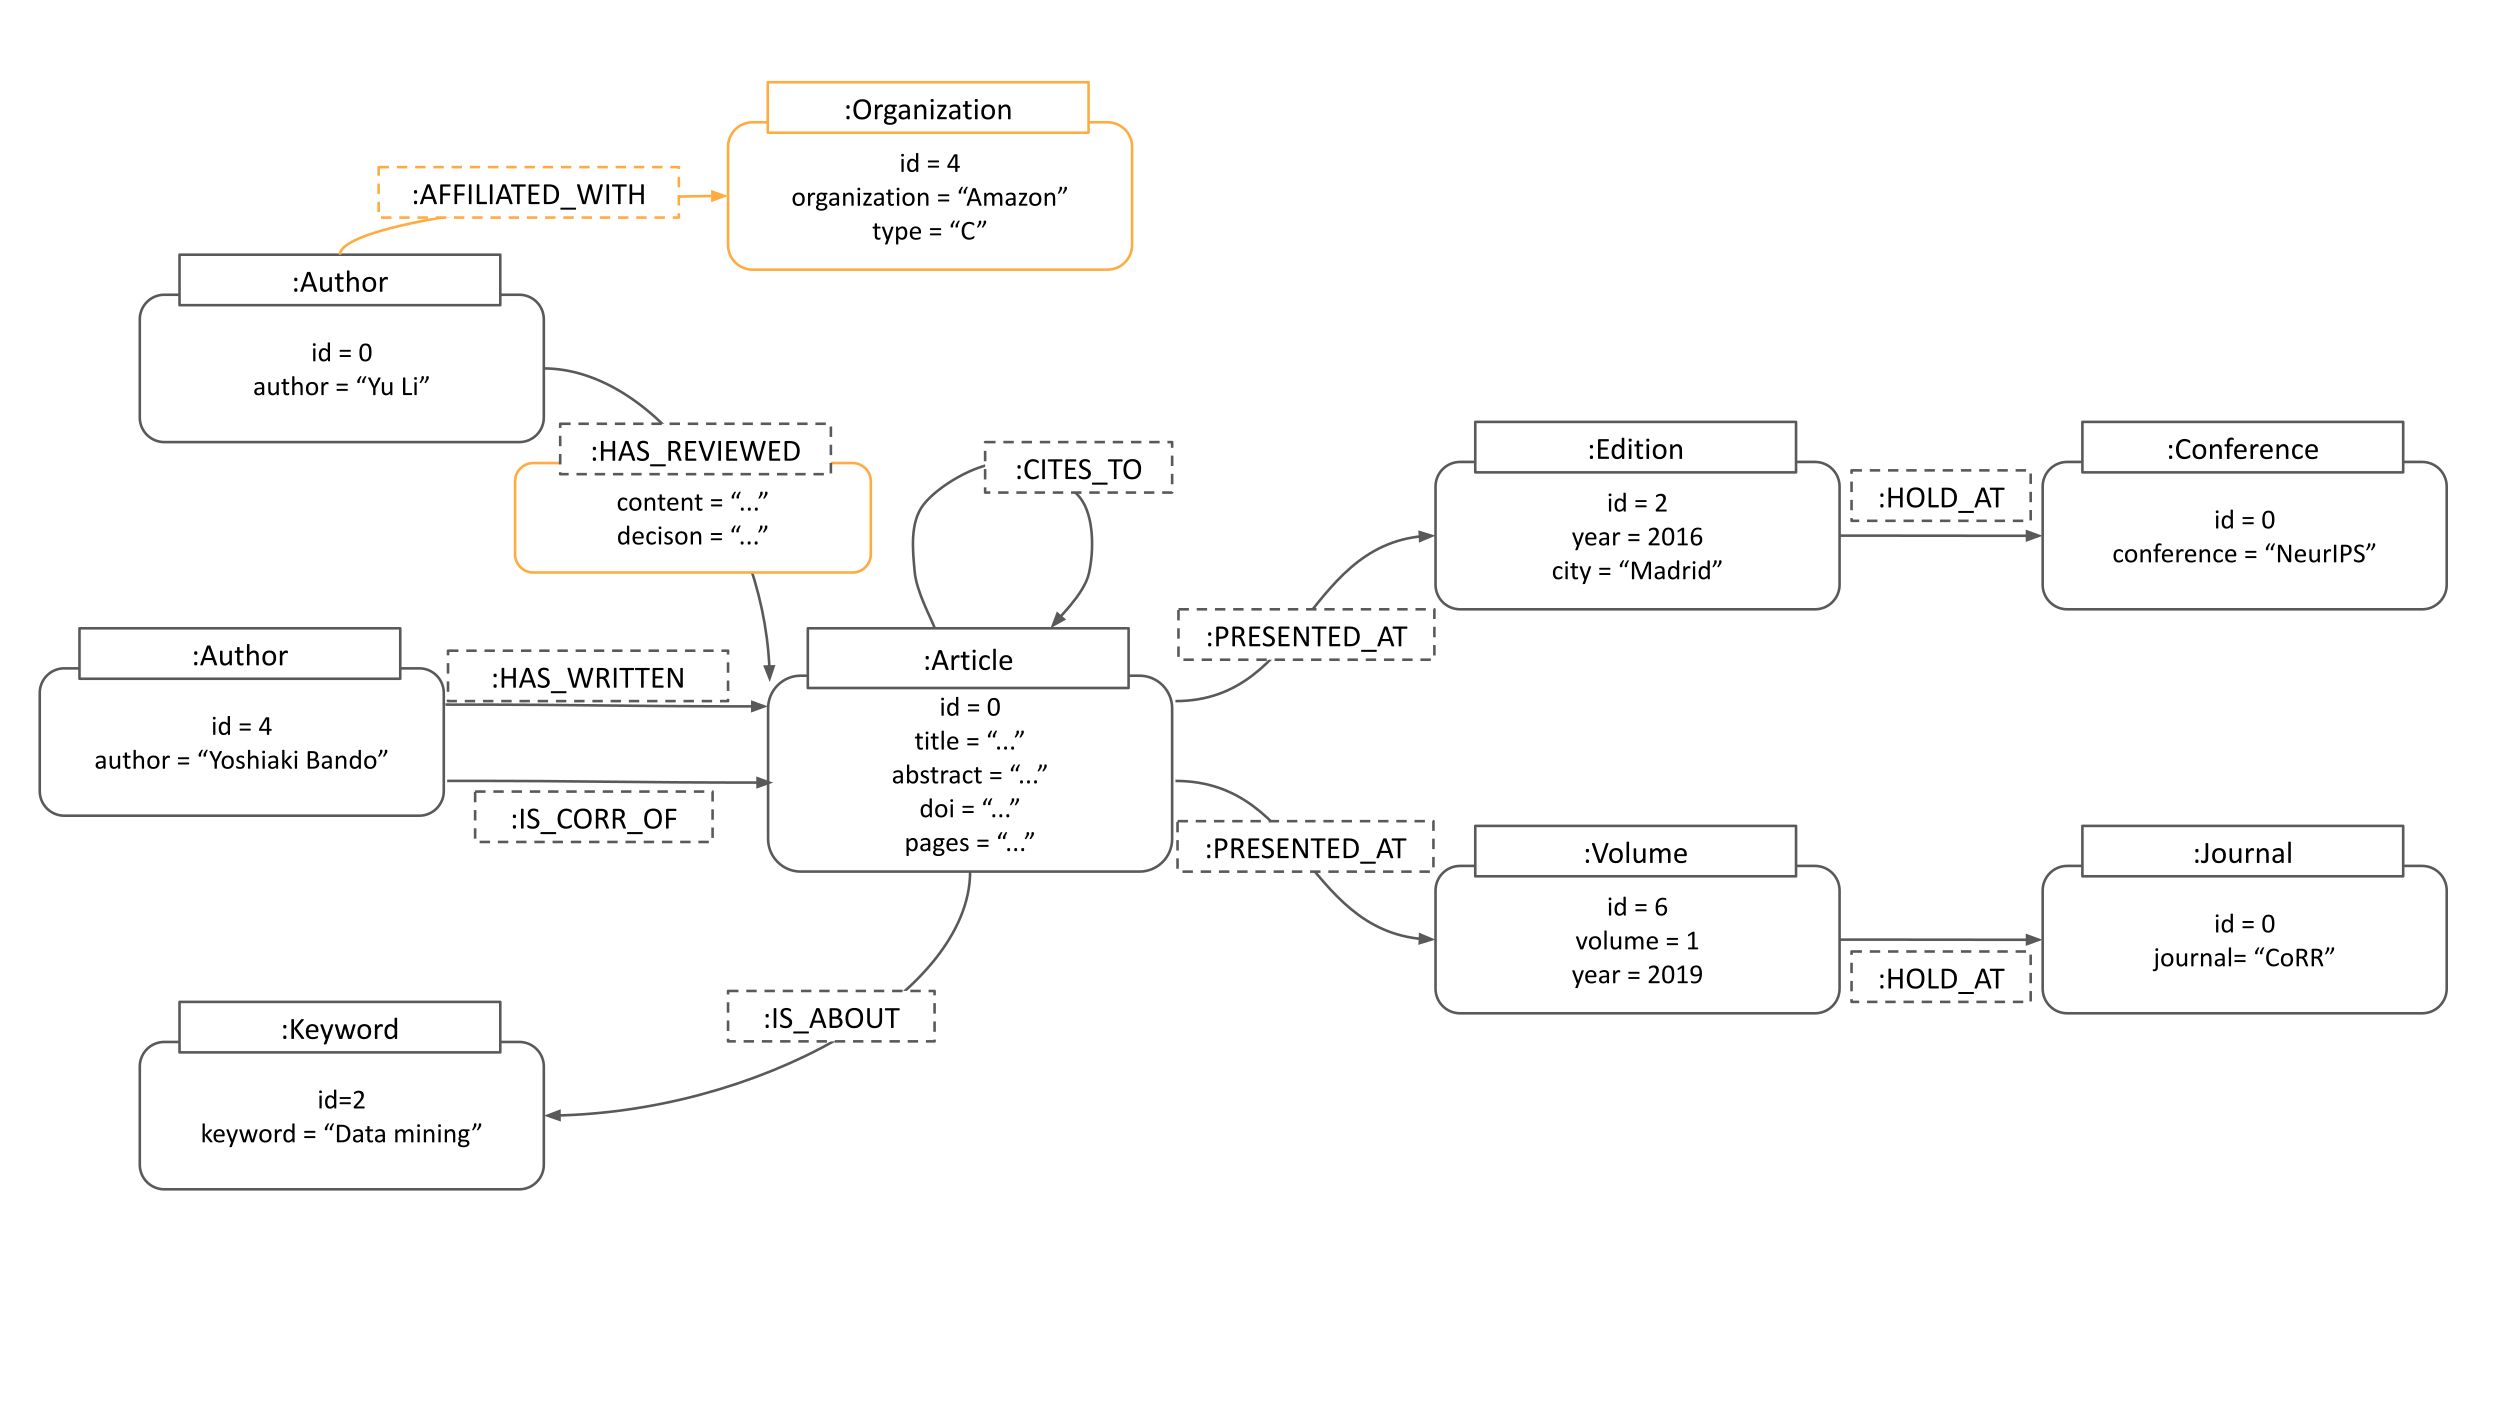
This segment focuses on loading data into a Neo4j database. The loading process is facilitated by the loading.py script. Queries for specific questions are stored in the cypher folder. For an in-depth explanation of the architecture, its extensibility, and the queries, refer to the report.
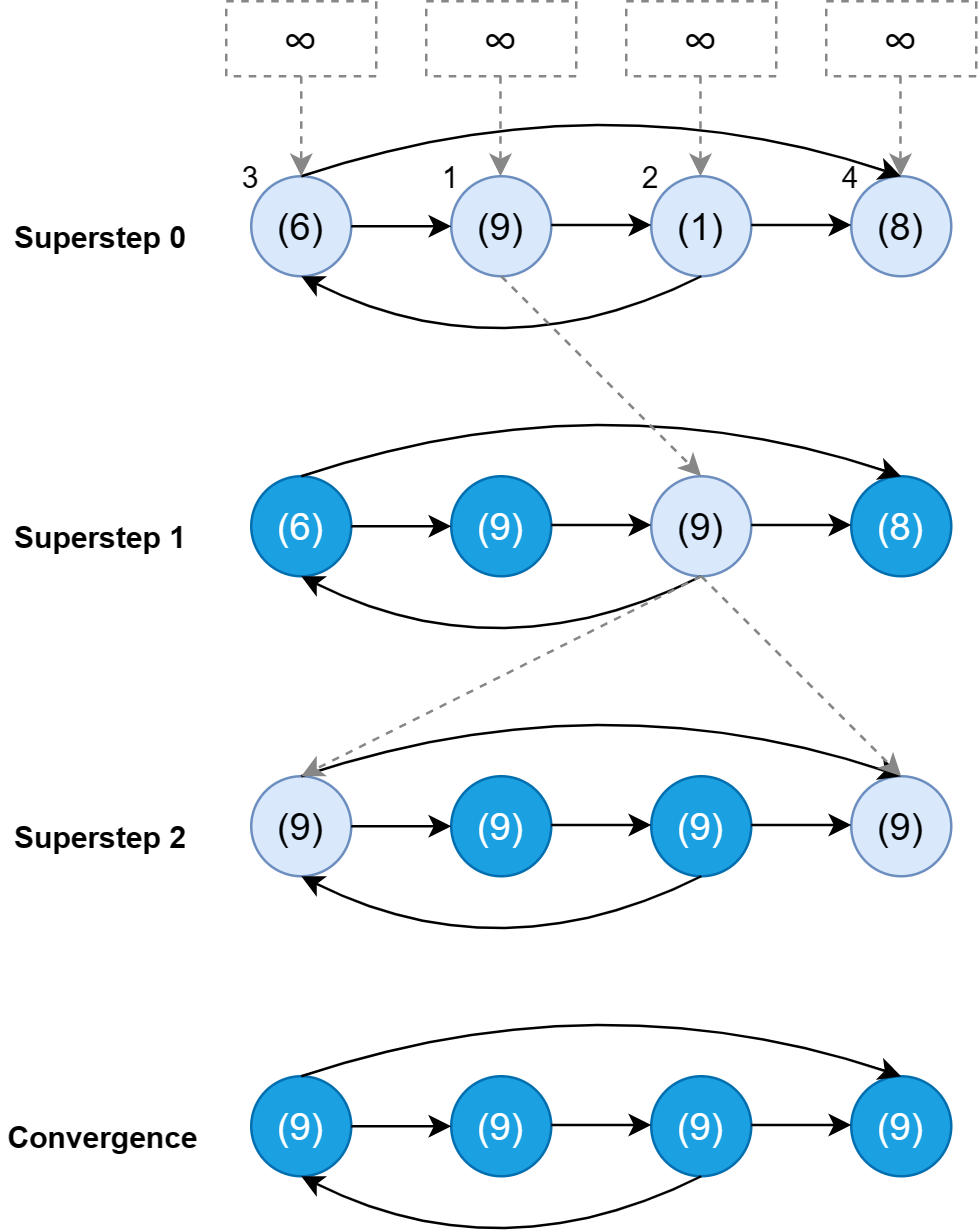
Here, the Think Like a Vertex (TLAV methodology is employed, using the Pregel framework for distributed graph processing. Algorithms for shortest-path (Dijkstra) and PageRank are implemented and can be found in the src folder. A comprehensive report detailing the approach, results, and conclusions is available in the report file.
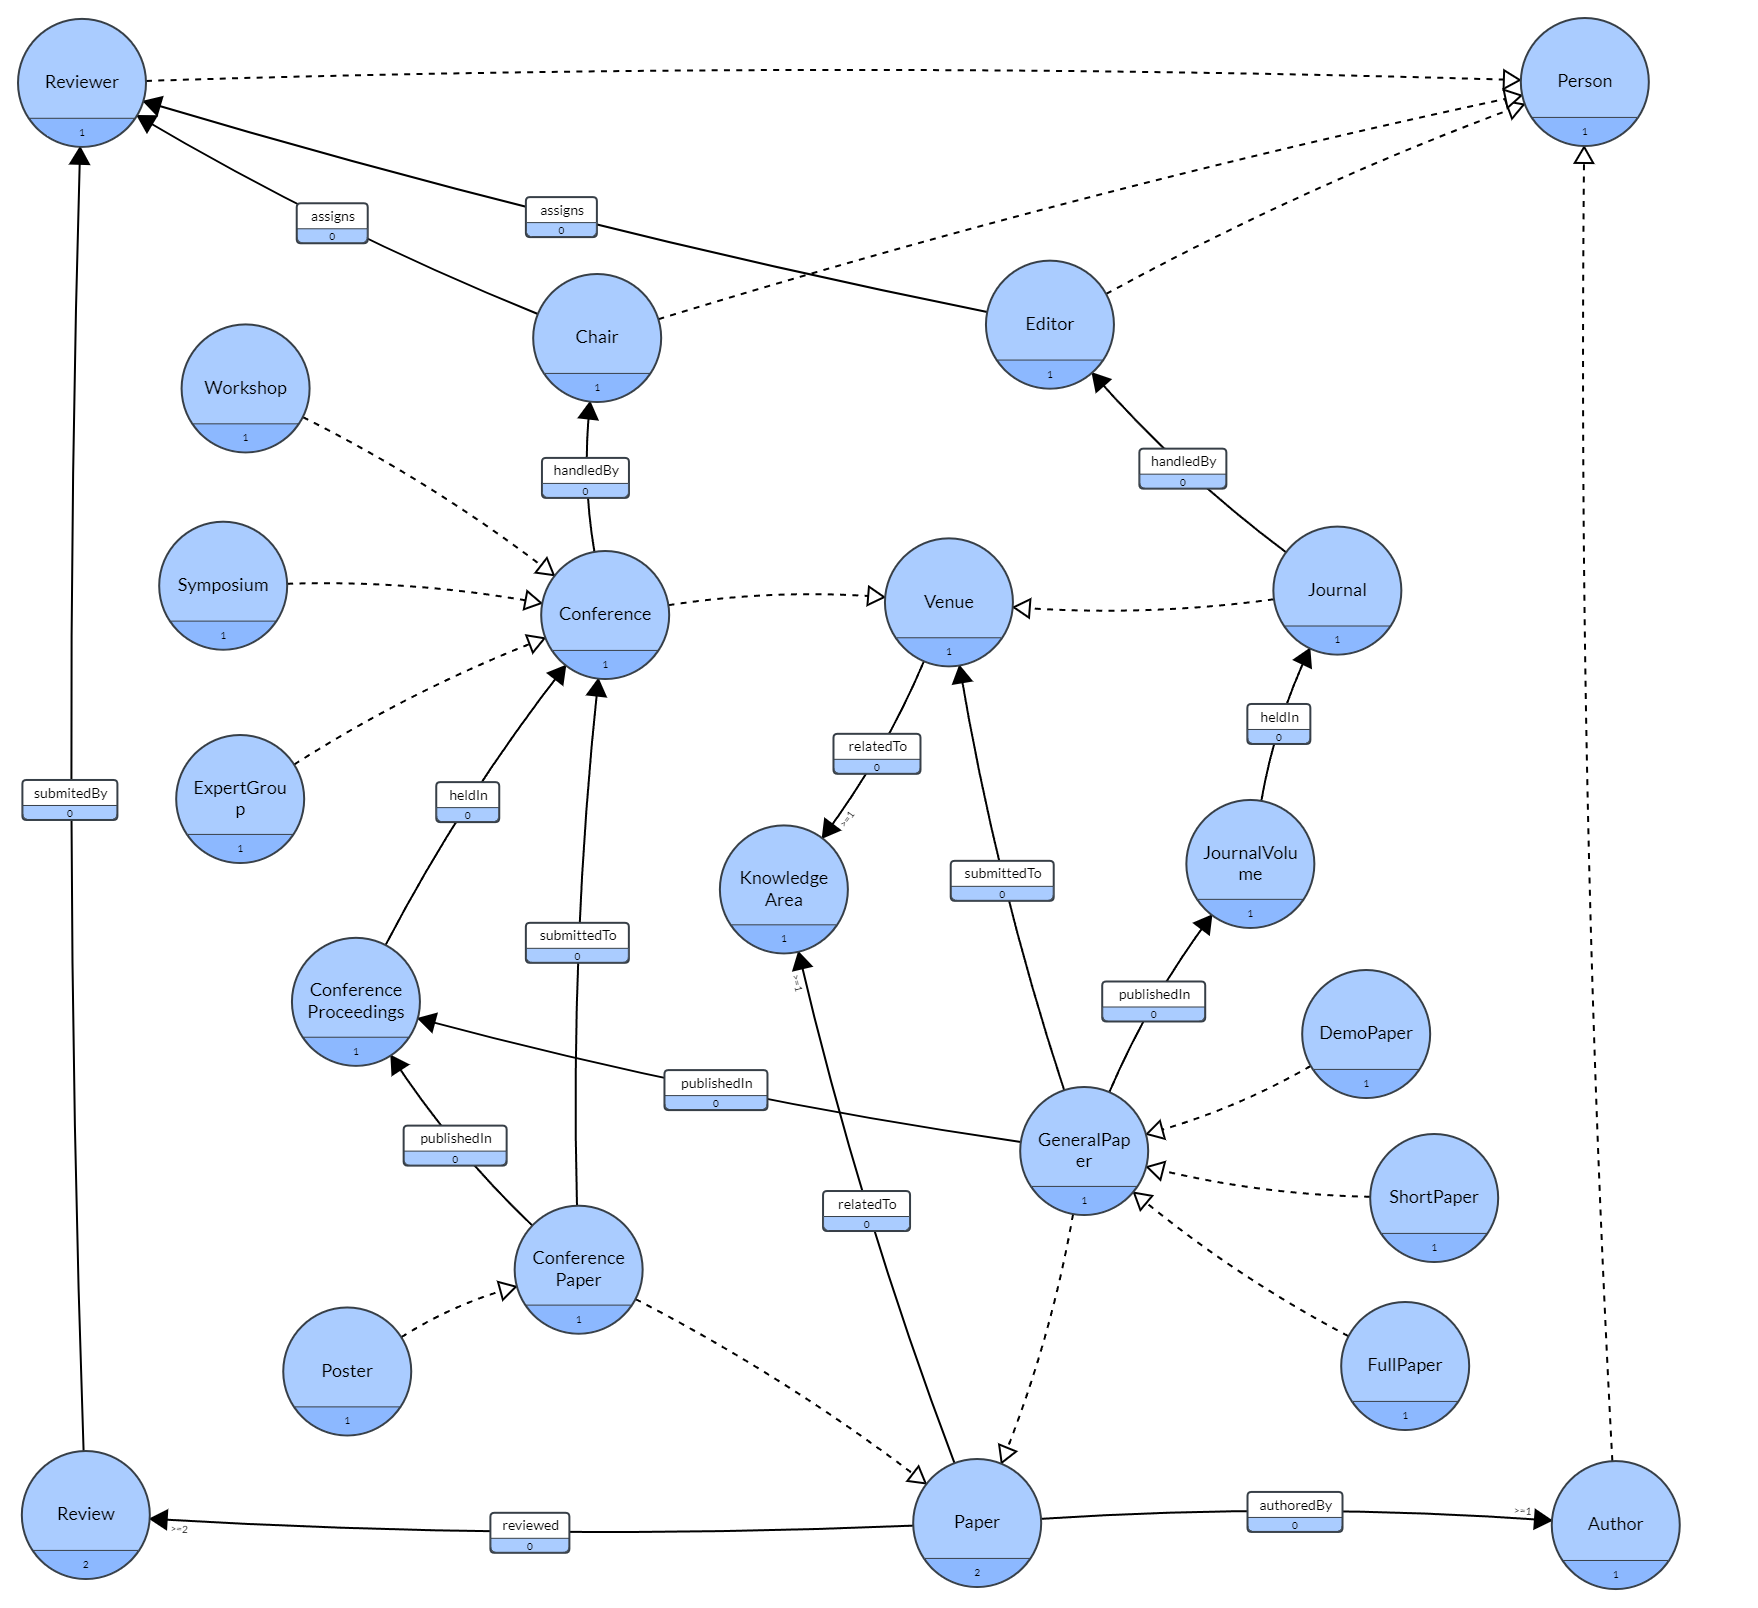
In this part, data is ingested into a GraphDB database. The ABOX and TBOX definitions are housed in the src folder. The ABOX construction code is in the abox_definition.ipynb file. The report, which includes the proposed TBOX and relevant queries, is located in the report file.
The final project delves into graph embeddings for data analytics. sentence-transformers are used to embed article titles (nodes), and an heterogeneous graph neural network is constructed using PyG. The code for building the graph and predicting article groups is in the src folder. A detailed report outlining the methodology, results, and conclusions is in the report file.


