Exporter for strongSwan via vici
This repository is to monitor a running strongSwan via the VICI.
It connects to the socket and queries the "list-sas" command, in response gets a list of streamed "list-sa" events from the strongswan core back. These streamed events are then marshalled to a go slice, which is then analyzed for the metrics itself.
By default, there is no customizing.
The programm needs to read the socket at /var/run/charon.vici. This is the default path for strongswan to place the unix socket, so if you did not change it, that should work. However, due to the containerization you need to mount that file explicitly, or mount /var/run of the strongSwan to the container.
You will need read and write access to this socket, as the program is issuing a command and reading the answer.
The program simply logs any errors. If you are unable to connect to the vici socket, this will produce a log entry at every scrape, not more or less. The scrape itself will just return a lot of empty metrics, but be up, as the prometheus part is fully functional. In normal mode this should never happen.
The official prometheus port is 9814. It is exposed via Dockerfile and is in the serve command of the webserver. The port is also published at the github list of exporters
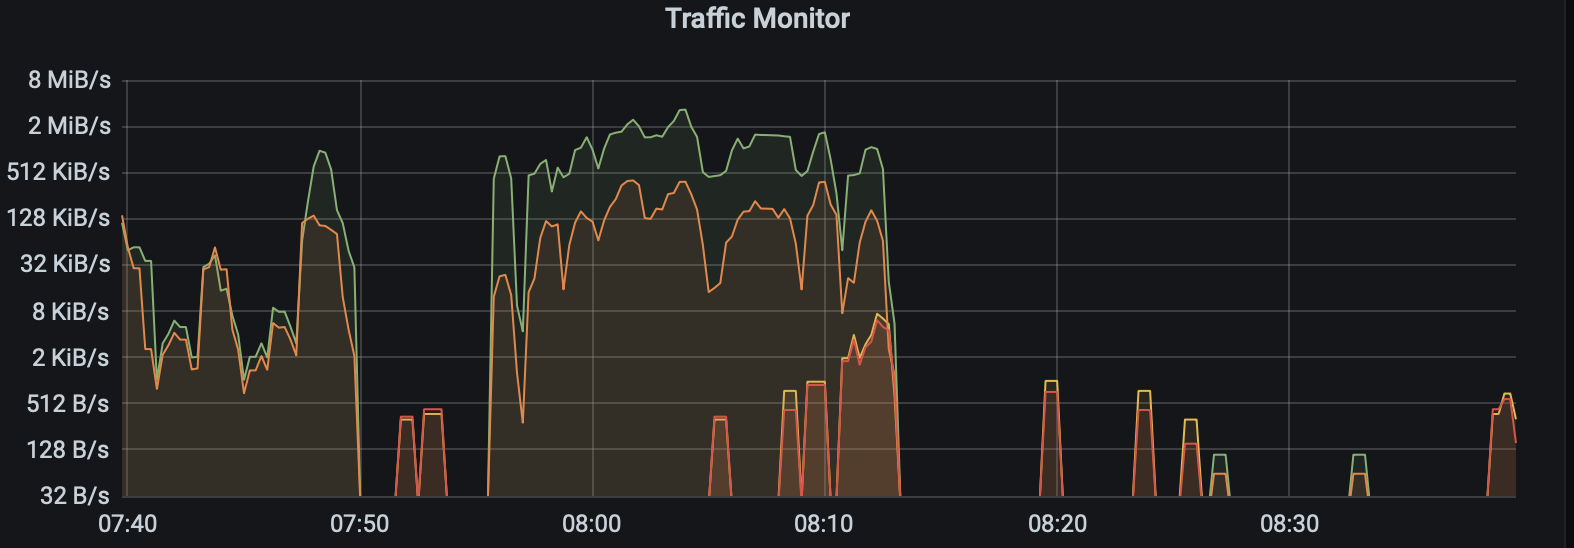
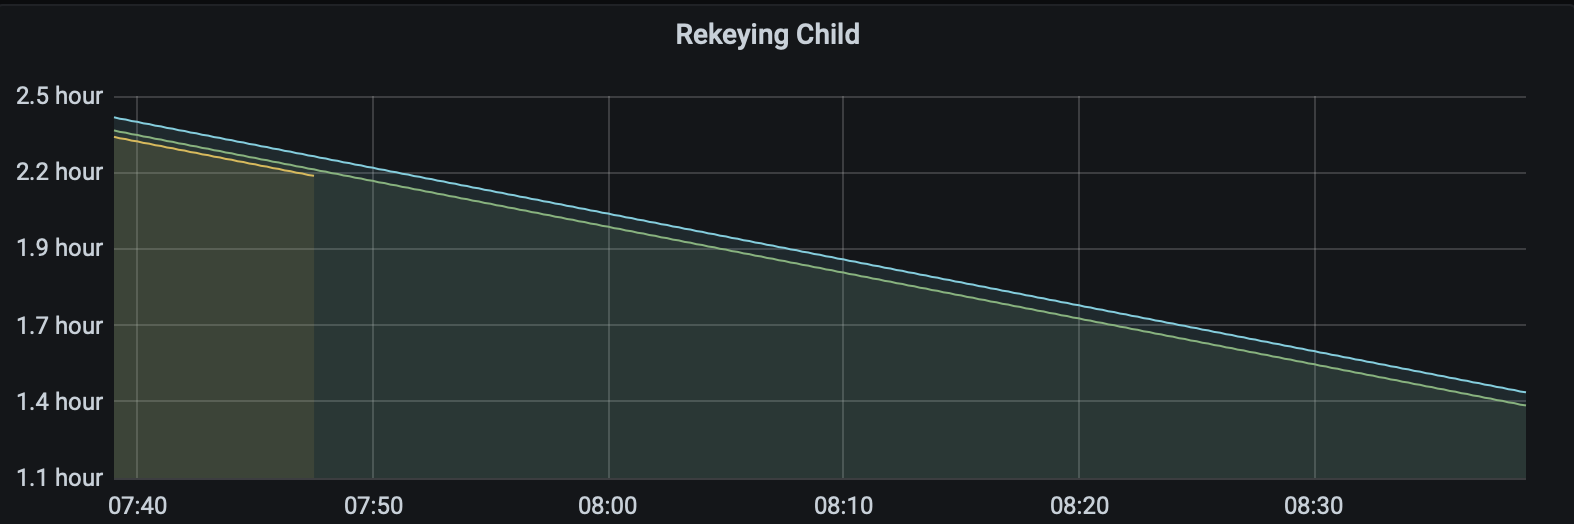
This are some panels i use to monitor my ongoing connections.
Query A (Legend: inbound {{child_name}}):
sum(increase(strongswan_sa_bytes_inbound{ike_name="${ike}"}[1m])) by (child_name)
Query B (Legend: outbound {{child_name}}):
sum(increase(strongswan_sa_bytes_outbound{ike_name="${ike}"}[1m])) by (child_name)
Query A (Legend: Child ID {{child_name}} {{child_id}})
strongswan_sa_rekey_second{ike_name="${ike}"}
A complete grafana dashboard can be found here
{
  "annotations": {
    "list": [
      {
        "builtIn": 1,
        "datasource": "-- Grafana --",
        "enable": true,
        "hide": true,
        "iconColor": "rgba(0, 211, 255, 1)",
        "name": "Annotations & Alerts",
        "type": "dashboard"
      }
    ]
  },
  "editable": true,
  "gnetId": null,
  "graphTooltip": 0,
  "id": 9,
  "iteration": 1622131750766,
  "links": [],
  "panels": [
    {
      "aliasColors": {},
      "bars": false,
      "dashLength": 10,
      "dashes": false,
      "datasource": null,
      "fieldConfig": {
        "defaults": {
          "custom": {}
        },
        "overrides": []
      },
      "fill": 1,
      "fillGradient": 0,
      "gridPos": {
        "h": 8,
        "w": 12,
        "x": 0,
        "y": 0
      },
      "hiddenSeries": false,
      "id": 6,
      "legend": {
        "avg": false,
        "current": false,
        "max": false,
        "min": false,
        "show": true,
        "total": false,
        "values": false
      },
      "lines": true,
      "linewidth": 1,
      "nullPointMode": "null",
      "options": {
        "alertThreshold": true
      },
      "percentage": false,
      "pluginVersion": "7.4.3",
      "pointradius": 2,
      "points": false,
      "renderer": "flot",
      "seriesOverrides": [],
      "spaceLength": 10,
      "stack": false,
      "steppedLine": false,
      "targets": [
        {
          "expr": "strongswan_ike_rekey_second{name=\"${ike}\"}",
          "interval": "",
          "legendFormat": "IKE ID {{name}} {{uniqueid}}",
          "refId": "A"
        }
      ],
      "thresholds": [],
      "timeFrom": null,
      "timeRegions": [],
      "timeShift": null,
      "title": "Rekeying IKE",
      "tooltip": {
        "shared": true,
        "sort": 0,
        "value_type": "individual"
      },
      "type": "graph",
      "xaxis": {
        "buckets": null,
        "mode": "time",
        "name": null,
        "show": true,
        "values": []
      },
      "yaxes": [
        {
          "$$hashKey": "object:821",
          "format": "s",
          "label": null,
          "logBase": 1,
          "max": null,
          "min": null,
          "show": true
        },
        {
          "$$hashKey": "object:822",
          "format": "short",
          "label": null,
          "logBase": 1,
          "max": null,
          "min": null,
          "show": true
        }
      ],
      "yaxis": {
        "align": false,
        "alignLevel": null
      }
    },
    {
      "aliasColors": {},
      "bars": false,
      "dashLength": 10,
      "dashes": false,
      "datasource": null,
      "fieldConfig": {
        "defaults": {
          "custom": {}
        },
        "overrides": []
      },
      "fill": 1,
      "fillGradient": 0,
      "gridPos": {
        "h": 8,
        "w": 12,
        "x": 12,
        "y": 0
      },
      "hiddenSeries": false,
      "id": 7,
      "legend": {
        "avg": false,
        "current": false,
        "max": false,
        "min": false,
        "show": true,
        "total": false,
        "values": false
      },
      "lines": true,
      "linewidth": 1,
      "nullPointMode": "null",
      "options": {
        "alertThreshold": true
      },
      "percentage": false,
      "pluginVersion": "7.4.3",
      "pointradius": 2,
      "points": false,
      "renderer": "flot",
      "seriesOverrides": [],
      "spaceLength": 10,
      "stack": false,
      "steppedLine": false,
      "targets": [
        {
          "expr": "strongswan_sa_rekey_second{ike_name=\"${ike}\"}",
          "interval": "",
          "legendFormat": "Child ID {{child_name}} {{child_id}}",
          "refId": "A"
        }
      ],
      "thresholds": [],
      "timeFrom": null,
      "timeRegions": [],
      "timeShift": null,
      "title": "Rekeying Child",
      "tooltip": {
        "shared": true,
        "sort": 0,
        "value_type": "individual"
      },
      "type": "graph",
      "xaxis": {
        "buckets": null,
        "mode": "time",
        "name": null,
        "show": true,
        "values": []
      },
      "yaxes": [
        {
          "$$hashKey": "object:821",
          "format": "s",
          "label": null,
          "logBase": 1,
          "max": null,
          "min": null,
          "show": true
        },
        {
          "$$hashKey": "object:822",
          "format": "short",
          "label": null,
          "logBase": 1,
          "max": null,
          "min": null,
          "show": true
        }
      ],
      "yaxis": {
        "align": false,
        "alignLevel": null
      }
    },
    {
      "aliasColors": {},
      "bars": false,
      "dashLength": 10,
      "dashes": false,
      "datasource": null,
      "fieldConfig": {
        "defaults": {
          "custom": {}
        },
        "overrides": []
      },
      "fill": 1,
      "fillGradient": 0,
      "gridPos": {
        "h": 9,
        "w": 12,
        "x": 0,
        "y": 8
      },
      "hiddenSeries": false,
      "id": 2,
      "legend": {
        "avg": false,
        "current": false,
        "max": false,
        "min": false,
        "show": true,
        "total": false,
        "values": false
      },
      "lines": true,
      "linewidth": 1,
      "nullPointMode": "null",
      "options": {
        "alertThreshold": true
      },
      "percentage": false,
      "pluginVersion": "7.4.3",
      "pointradius": 2,
      "points": false,
      "renderer": "flot",
      "seriesOverrides": [],
      "spaceLength": 10,
      "stack": false,
      "steppedLine": false,
      "targets": [
        {
          "expr": "strongswan_ike_children{name=\"${ike}\"}",
          "interval": "",
          "legendFormat": "",
          "refId": "A"
        }
      ],
      "thresholds": [],
      "timeFrom": null,
      "timeRegions": [],
      "timeShift": null,
      "title": "Children of $ike",
      "tooltip": {
        "shared": true,
        "sort": 0,
        "value_type": "individual"
      },
      "type": "graph",
      "xaxis": {
        "buckets": null,
        "mode": "time",
        "name": null,
        "show": true,
        "values": []
      },
      "yaxes": [
        {
          "$$hashKey": "object:656",
          "format": "short",
          "label": null,
          "logBase": 1,
          "max": null,
          "min": null,
          "show": true
        },
        {
          "$$hashKey": "object:657",
          "format": "short",
          "label": null,
          "logBase": 1,
          "max": null,
          "min": null,
          "show": true
        }
      ],
      "yaxis": {
        "align": false,
        "alignLevel": null
      }
    },
    {
      "aliasColors": {},
      "bars": false,
      "dashLength": 10,
      "dashes": false,
      "datasource": null,
      "fieldConfig": {
        "defaults": {
          "custom": {}
        },
        "overrides": []
      },
      "fill": 1,
      "fillGradient": 0,
      "gridPos": {
        "h": 9,
        "w": 12,
        "x": 12,
        "y": 8
      },
      "hiddenSeries": false,
      "id": 4,
      "legend": {
        "avg": false,
        "current": false,
        "max": false,
        "min": false,
        "show": true,
        "total": false,
        "values": false
      },
      "lines": true,
      "linewidth": 1,
      "nullPointMode": "null",
      "options": {
        "alertThreshold": true
      },
      "percentage": false,
      "pluginVersion": "7.4.3",
      "pointradius": 2,
      "points": false,
      "renderer": "flot",
      "seriesOverrides": [],
      "spaceLength": 10,
      "stack": false,
      "steppedLine": false,
      "targets": [
        {
          "expr": "sum(increase(strongswan_sa_bytes_inbound{ike_name=\"${ike}\"}[1m])) by (child_name)",
          "interval": "",
          "legendFormat": "inbound {{child_name}}",
          "refId": "A"
        },
        {
          "expr": "sum(increase(strongswan_sa_bytes_outbound{ike_name=\"${ike}\"}[1m])) by (child_name)",
          "interval": "",
          "legendFormat": "outbound {{child_name}}",
          "refId": "B"
        }
      ],
      "thresholds": [],
      "timeFrom": null,
      "timeRegions": [],
      "timeShift": null,
      "title": "Traffic Monitor",
      "tooltip": {
        "shared": true,
        "sort": 0,
        "value_type": "individual"
      },
      "type": "graph",
      "xaxis": {
        "buckets": null,
        "mode": "time",
        "name": null,
        "show": true,
        "values": []
      },
      "yaxes": [
        {
          "$$hashKey": "object:713",
          "format": "binBps",
          "label": null,
          "logBase": 2,
          "max": null,
          "min": null,
          "show": true
        },
        {
          "$$hashKey": "object:714",
          "format": "short",
          "label": null,
          "logBase": 1,
          "max": null,
          "min": null,
          "show": true
        }
      ],
      "yaxis": {
        "align": false,
        "alignLevel": null
      }
    }
  ],
  "refresh": "10s",
  "schemaVersion": 27,
  "style": "dark",
  "tags": [],
  "templating": {
    "list": [
      {
        "allValue": null,
        "current": {
          "selected": true,
          "text": [
            "dev"
          ],
          "value": [
            "dev"
          ]
        },
        "datasource": "Prometheus",
        "definition": "label_values(strongswan_ike_state,  name)",
        "description": null,
        "error": null,
        "hide": 0,
        "includeAll": false,
        "label": null,
        "multi": false,
        "name": "ike",
        "options": [
          {
            "selected": true,
            "text": "dev",
            "value": "dev"
          }
        ],
        "query": "label_values(strongswan_ike_state,  name)",
        "refresh": 0,
        "regex": "",
        "skipUrlSync": false,
        "sort": 0,
        "tagValuesQuery": "",
        "tags": [],
        "tagsQuery": "",
        "type": "query",
        "useTags": false
      }
    ]
  },
  "time": {
    "from": "now-1h",
    "to": "now"
  },
  "timepicker": {},
  "timezone": "",
  "title": "IPSec Monitoring",
  "uid": "98mc5W8Gz",
  "version": 5
}This repository should be considered as Work in Progress, as there may be changes to the number of metrics.
This go-programm connects to a socket (unix socket or tcp socket) representing a vici connection. With this connection the strongswan system is queried at every scrape for different statistics.
This informations can be consumed by prometheus and displayed by any tool behind prometheus.