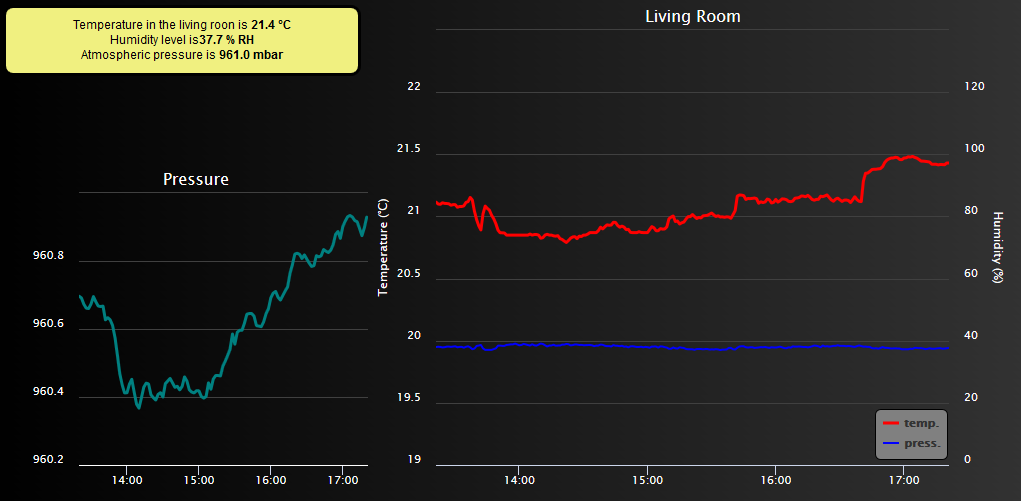
This PHP script will allow you to create your very own visualisation cloud to control Yoctopuce sensors. Basically you will be able to interactively build a user interface with graphs showing your Yoctopuce sensors data history.
- Copy all seven php files on your PHP server, preferably in a sub folder
- Create a data sub-folder, make sure the php server has write access to it
- With a web browser, Open your YoctoHub/VirtualHub configuration. in the "Outgoing callbacks" section, define a "Yocto-API" callback pointing to the index.php file you just copied on your server. Test the callback with the "test" button, you should get a message with "Done." at the end. If everything is fine, just save and close the configuration
- With your browser, open the URL pointing on your index.php and
add
?editat the end of the URL, this will make a edition menu appear, you can start to add a graph with "new..>chart".
For consultation only, just open the URL without the ?edit parameter
The application can handle different sets of sensors, just use add the parameter &feed=ArbitraryName on all URLs, including the one defined in the Hubs callback configuration
More detail about this application on our blog: www.yoctopuce.com/EN/article/a-yoctopuce-web-based-app-to-draw-sensors-graphs
This work uses the Highstock library from HighSoft. This outstanding library is free for private or non-commercial use, but take the time anyway to closely examine their license terms and conditions.
More info on : http://www.highcharts.com/
