Integral field units (IFUs) combine imaging and spectroscopic capabilities to acquire spatially resolved 2-dimensional spectroscopy in a single astronomical exposure.
The dataset produced with an IFU is a 3 dimensional object (RA, Dec, Energy) where a spectrum is available for each pixel of the image. While a growing number of instrument in optical/IR are IFUs (e.g. MUSE on VLT, MIRI on James Webb Telescope), CCD type detectors onboard X-ray telescope have provided spectro-imaging capabilities since the ASCA satellite in the 90s.
X-ray CCDs can measure the position, energy and time of arrival of individual photons providing list of events that can be binned to produce data cubes (RA, Dec, Energy). Due to the low photon statistics in the ASCA days and in the short exposures of the last generation of telescopes XMM-Newton and Chandra, the visualization of the data in 3D was not explored. After 20 years in operation and deep Mega-second observations in the archive of bright extended sources such as Supernova Remnants (SNR) or clusters of galaxies, it is now possible to explore datasets in their true 3D nature.
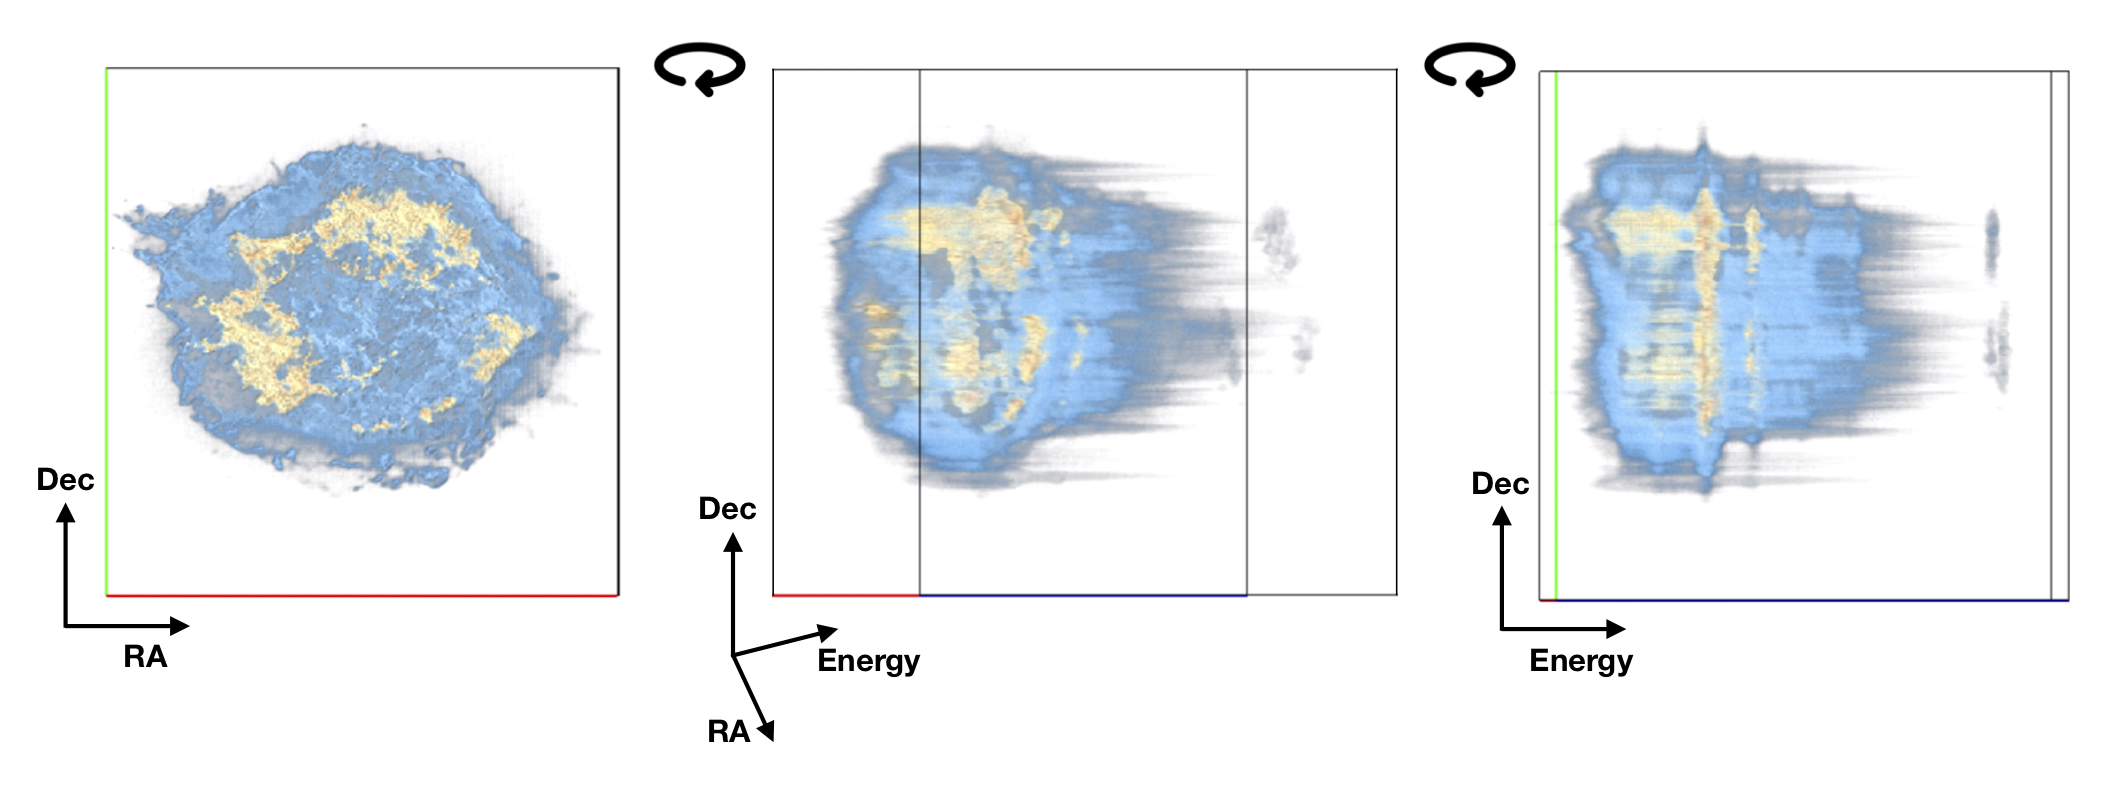
This is an example of the 1 Ms of Chandra observation of the Cassiopeia A SNR (see Chandra data archives). About 300 millions photons have been recorded in 1 Ms between 0.5 and 10 keV ! This extremly rich dataset provides unprecedented details about the spatial distribution and spectral properties of individual heavy elements producing during the supernova.
Shown below is a volume rendering of the 3D CasA data cube (RA, Dec, Energy). The colors (blue, yellow, and red shades) indicates a higher density i.e. brightness of X-ray photons. Three different viewing angles of the same cube are shown below (face-on, side, and edge-on). A movie where the camera rotates around the cube is available here.
The face-on image (left panel) shows the spatial distribution of the X-ray emission and is comparable to classical images. Looking at the cube edge-on reveals a different facets of CasA revealing the distribution of individual elements via their line emission (vertical lines), while horizontal lines indicate regions of strong continuum emission which is mostly synchrotron radiation from accelerated electrons at the shocks. At higher energies, three blobs of line emission reveal the non-uniform Fe K spatial distribution.
