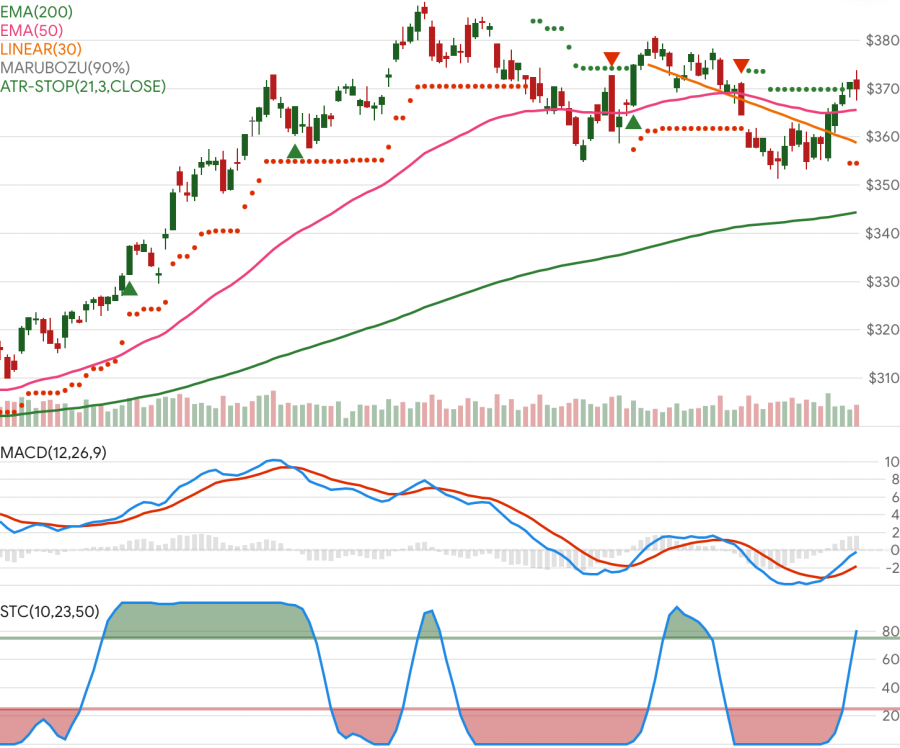
help wanted: maintain chart demo site
DaveSkender opened this issue · 1 comments
I'm looking for help with some light work to maintain the demo site. It's an Angular frontend with a .NET Web API backend. Mostly just copying code and modifying it to add any indicators that are available in the indicator library but not yet available in the demo chart + keeping up with new or modified ones.
No time pressure on this one, but some level of commitment is appreciated. Let me know if you're interested. This is relatively easy stuff, so newbies are welcome here; I'll still be involved, be available for pair programming, and help with code reviews + will be looking at new features over time. Ideas are also welcome.
How to add indicators (example):
-
add Controller for API, such as:
[HttpGet("EMA")]
public IActionResult GetEma(
    int lookbackPeriods)
{
    try
    {
        IEnumerable<Quote> quotes = FetchQuotes.Get();

        IEnumerable<EmaResult> results =
            quotes.GetEma(lookbackPeriods)
                  .TakeLast(limitLast);

        return Ok(results);
    }
    catch (ArgumentOutOfRangeException rex)
    {
        return BadRequest(rex.Message);
    }
}
-
Add indicator metadata that is used by the chart user interface:
// Exponential Moving Average
new IndicatorList
{
    Name = "Exponential Moving Average (EMA)",
    Uiid = "EMA",
    LegendTemplate = "EMA([P1])",
    Endpoint = $"{baseUrl}/EMA/",
    Category = "moving-average",
    ChartType = "overlay",
    Parameters = new List<IndicatorParamConfig>
    {
        new IndicatorParamConfig {
            DisplayName = "Lookback Periods",
            ParamName = "lookbackPeriods",
            DataType = "int",
            DefaultValue = 20,
            Minimum = 1,
            Maximum = 250
        }
    },
    Results = new List<IndicatorResultConfig>{
        new IndicatorResultConfig {
            DisplayName = "EMA",
            TooltipTemplate = "EMA([P1])",
            DataName = "ema",
            DataType = "number",
            LineType = "solid",
            DefaultColor = standardBlue
        }
    }
}
-
Make sure it works correctly:
Hi @DaveSkender I can try to add the following the three indicators to the charts and see how it looks:
