Severe memory leak when setUseEngineSocketByDefault(true)
knaccc opened this issue · 52 comments
I've included below the source code of a simple test that creates 100k localhost SSL connections.
If it is run without conscrypt, it uses approx 330MB of Linux res mem. With conscrypt, it uses approx 3.7GB res mem, despite Xmx being set to 512M.
I've tested this both on Ubuntu 18 and Centos 7, on two different machines. One machine is a Ubuntu VM with 2 virtual cores on an Apple laptop with 6 cores, and the other machine has dual Xeons, each with 8 cores. Both tests were with OpenJDK 14.0.1 as downloaded from https://jdk.java.net/14/ and with conscrypt-openjdk-2.4.0-linux-x86_64 from the maven repo.
(Note that this memory leak happens when testing with both conscrypt 2.4.0 and 2.2.1.)
To make the code run, a keystore must first be created using the command: keytool -genkey -keyalg EC -keystore keystore -groupname secp256r1 -alias localhost -keypass password -storepass password -dname "CN=localhost,OU=X,O=X,L=X,S=X,C=X"
The conscypt jar has to be available, which can be retrieved with wget https://repo1.maven.org/maven2/org/conscrypt/conscrypt-openjdk/2.4.0/conscrypt-openjdk-2.4.0-linux-x86_64.jar
The code is compiled using javac Main.java -cp conscrypt-openjdk-2.4.0-linux-x86_64.jar
The code is run using java -Xmx512M -cp conscrypt-openjdk-2.4.0-linux-x86_64.jar:. -Djavax.net.ssl.keyStore=keystore -Djavax.net.ssl.keyStorePassword=password -Djavax.net.ssl.trustStore=keystore -Djavax.net.ssl.trustStorePassword=password Main
The code, to be placed inside Main.java:
import org.conscrypt.Conscrypt;
import org.conscrypt.OpenSSLProvider;

import java.io.*;
import javax.net.*;
import javax.net.ssl.*;
import java.net.*;
import java.security.Security;
import java.util.Scanner;
import java.util.concurrent.ExecutorService;
import java.util.concurrent.Executors;
import java.util.concurrent.TimeUnit;
import java.util.concurrent.atomic.AtomicInteger;

public class Main {

  public static void main(String[] args) throws Exception {

    System.out.println("pid: " + ProcessHandle.current().pid());

    System.out.println("Use conscrypt? (y/n)");
    boolean useConscrypt = new Scanner(System.in).nextLine().toLowerCase().startsWith("y");

    if(useConscrypt) {
      Conscrypt.setUseEngineSocketByDefault(true);
      Security.insertProviderAt(new OpenSSLProvider(), 1);
    }

    int listenPort = 12345;

    ServerSocketFactory serverSocketFactory = SSLServerSocketFactory.getDefault();
    ServerSocket serverSocket = serverSocketFactory.createServerSocket(listenPort);

    new Thread(()->{
      try {
        while(true) {
          try(var socket = serverSocket.accept()) {
            try(var out = new PrintWriter(new BufferedWriter(new OutputStreamWriter(socket.getOutputStream())))) {
              out.println("Hello");
              out.flush();
            }
          }
        }
      } catch (IOException e) {
        e.printStackTrace();
      }
    }).start();


    SSLSocketFactory factory = (SSLSocketFactory) SSLSocketFactory.getDefault();

    int concurrentThreads = Runtime.getRuntime().availableProcessors();
    ExecutorService executor = Executors.newFixedThreadPool(concurrentThreads);

    var count = new AtomicInteger(0);
    var totalConnections = 100*1000;

    new Thread(()->{
      try {
        while(true) {
          Thread.sleep(1000);
          System.out.println("Count: " + count.get());
        }
      }
      catch (InterruptedException e) {}
    }).start();

    for(int i=0; i<totalConnections; i++) {
      executor.submit(() -> {
        try {
          SSLSocket socket = (SSLSocket) factory.createSocket("localhost", listenPort);
          socket.startHandshake();
          BufferedReader in = new BufferedReader(new InputStreamReader(socket.getInputStream()));
          while ((in.readLine()) != null);

          in.close();
          socket.close();
          count.incrementAndGet();
        }
        catch (IOException e) {
          e.printStackTrace();
        }
      });
    }

    executor.shutdown();
    executor.awaitTermination(Long.MAX_VALUE, TimeUnit.DAYS);

  }

}
Thanks in advance for any assistance.
Btw the same memory leak happens if the client sockets are created in a simple while loop instead of concurrently.
The following code will use more and more res mem until the machine runs out of physical memory (when using conscrypt), despite the Xmx512M flag being set.
E.g. after creating 1.2 million client sockets, non-conscrypt is using 360MB res mem.
After creating 330k client sockets with conscrypt, the res mem usage is approx 11GB, and memory usage will rise forever.
Simple loop code:
import org.conscrypt.Conscrypt;
import org.conscrypt.OpenSSLProvider;

import javax.net.ServerSocketFactory;
import javax.net.ssl.SSLServerSocketFactory;
import javax.net.ssl.SSLSocket;
import javax.net.ssl.SSLSocketFactory;
import java.io.*;
import java.net.ServerSocket;
import java.security.Security;
import java.util.Scanner;
import java.util.concurrent.atomic.AtomicInteger;

public class Main2 {

  public static void main(String[] args) throws Exception {

    System.out.println("pid: " + ProcessHandle.current().pid());

    System.out.println("Use conscrypt? (y/n)");
    boolean useConscrypt = new Scanner(System.in).nextLine().toLowerCase().startsWith("y");

    if(useConscrypt) {
      Conscrypt.setUseEngineSocketByDefault(true);
      Security.insertProviderAt(new OpenSSLProvider(), 1);
    }

    int listenPort = 12345;

    ServerSocketFactory serverSocketFactory = SSLServerSocketFactory.getDefault();
    ServerSocket serverSocket = serverSocketFactory.createServerSocket(listenPort);

    new Thread(()->{
      try {
        while(true) {
          try(var socket = serverSocket.accept()) {
            try(var out = new PrintWriter(new BufferedWriter(new OutputStreamWriter(socket.getOutputStream())))) {
              out.println("Hello");
              out.flush();
            }
          }
        }
      } catch (IOException e) {
        e.printStackTrace();
      }
    }).start();


    SSLSocketFactory factory = (SSLSocketFactory) SSLSocketFactory.getDefault();

    var count = new AtomicInteger(0);

    new Thread(()->{
      try {
        while(true) {
          Thread.sleep(1000);
          System.out.println("Count: " + count.get());
        }
      }
      catch (InterruptedException e) {}
    }).start();

    while(true) {
      try {
        SSLSocket socket = (SSLSocket) factory.createSocket("localhost", listenPort);
        socket.startHandshake();
        BufferedReader in = new BufferedReader(new InputStreamReader(socket.getInputStream()));
        while ((in.readLine()) != null);

        in.close();
        socket.close();
        count.incrementAndGet();
      }
      catch (IOException e) {
        e.printStackTrace();
      }
    }

  }

}
More tests: it makes no difference whether the keystore self-signed cert is created with -keyalg EC -groupname secp256r1 or with -keyalg RSA -keysize 2048.
After splitting the code up into a client process and a server process, I can also confirm that the memory leak occurs both for server sockets and client sockets. After 300k connections, the test showed that the conscrypt client was using 5.5G res mem and the server was using 4.5G res mem.
The split client/server code is as follows:
import org.conscrypt.Conscrypt;
import org.conscrypt.OpenSSLProvider;

import javax.net.ServerSocketFactory;
import javax.net.ssl.SSLServerSocketFactory;
import javax.net.ssl.SSLSocket;
import javax.net.ssl.SSLSocketFactory;
import java.io.*;
import java.net.ServerSocket;
import java.security.Security;
import java.util.Scanner;
import java.util.concurrent.atomic.AtomicInteger;

public class Main3 {

  public static void main(String[] args) throws Exception {

    System.out.println("pid: " + ProcessHandle.current().pid());

    System.out.println("Use conscrypt? (y/n)");
    boolean useConscrypt = new Scanner(System.in).nextLine().toLowerCase().startsWith("y");

    if(useConscrypt) {
      Conscrypt.setUseEngineSocketByDefault(true);
      Security.insertProviderAt(new OpenSSLProvider(), 1);
    }

    int listenPort = 12345;

    ServerSocketFactory serverSocketFactory = SSLServerSocketFactory.getDefault();
    ServerSocket serverSocket = serverSocketFactory.createServerSocket(listenPort);

    new Thread(()->{
      try {
        while(true) {
          try(var socket = serverSocket.accept()) {
            try(var out = new PrintWriter(new BufferedWriter(new OutputStreamWriter(socket.getOutputStream())))) {
              out.println("Hello");
              out.flush();
            }
          }
        }
      } catch (IOException e) {
        e.printStackTrace();
      }
    }).start();

  }

}
import org.conscrypt.Conscrypt;
import org.conscrypt.OpenSSLProvider;

import javax.net.ServerSocketFactory;
import javax.net.ssl.SSLServerSocketFactory;
import javax.net.ssl.SSLSocket;
import javax.net.ssl.SSLSocketFactory;
import java.io.*;
import java.net.ServerSocket;
import java.security.Security;
import java.util.Scanner;
import java.util.concurrent.atomic.AtomicInteger;

public class Main4 {

  public static void main(String[] args) throws Exception {

    System.out.println("pid: " + ProcessHandle.current().pid());

    System.out.println("Use conscrypt? (y/n)");
    boolean useConscrypt = new Scanner(System.in).nextLine().toLowerCase().startsWith("y");

    if(useConscrypt) {
      Conscrypt.setUseEngineSocketByDefault(true);
      Security.insertProviderAt(new OpenSSLProvider(), 1);
    }

    int listenPort = 12345;

    SSLSocketFactory factory = (SSLSocketFactory) SSLSocketFactory.getDefault();

    var count = new AtomicInteger(0);

    new Thread(()->{
      try {
        while(true) {
          Thread.sleep(1000);
          System.out.println("Count: " + count.get());
        }
      }
      catch (InterruptedException e) {}
    }).start();

    while(true) {
      try {
        SSLSocket socket = (SSLSocket) factory.createSocket("localhost", listenPort);
        socket.startHandshake();
        BufferedReader in = new BufferedReader(new InputStreamReader(socket.getInputStream()));
        while ((in.readLine()) != null);

        in.close();
        socket.close();
        count.incrementAndGet();
      }
      catch (IOException e) {
        e.printStackTrace();
      }
    }

  }

}
Update: Same memory leak happens under AdoptOpenJDK with the OpenJ9 VM (jdk-14.0.1+7_openj9-0.20.0) instead of the Hotspot VM.
Same leak also occurs when using OpenJDK 11 GA (build 11+28) from https://jdk.java.net/archive/
Setting MALLOC_ARENA_MAX=1 does not help (either with Hotspot on OpenJDK11, Hotspot on OpenJDK14 or OpenJ9 on AdoptOpenJDK14). (See https://devcenter.heroku.com/articles/tuning-glibc-memory-behavior).
I've tried using jcmd <pid> GC.class_histogram to look for object counts getting out of control, but things look fine.
When looking at pmap -x <pid>, you can see lots of chunks of 64MB RAM being allocated, I'm guessing in connection with JNI-related mallocs.
I also get the same leak when using Jetty with Conscrypt, and I have to restart Jetty approx every 24hours to avoid the machine from running out of memory.
Update: the memory leak goes away when the line Conscrypt.setUseEngineSocketByDefault(true) is removed. However, that means Conscrypt can only work without memory leaks with older JDK versions, since Conscrypt will only run on JDK13/14 when the line Conscrypt.setUseEngineSocketByDefault(true) is included.
The exception that happens on JDK13/14 when the line is not included is as follows:
java.net.SocketException: Socket is closed
        at org.conscrypt.NativeSsl.doHandshake(NativeSsl.java:404)
        at org.conscrypt.ConscryptFileDescriptorSocket.startHandshake(ConscryptFileDescriptorSocket.java:226)
        at Main.lambda$main$2(Main.java:71)
        at Main$$Lambda$54/0000000000000000.run(Unknown Source)
        at java.base/java.util.concurrent.Executors$RunnableAdapter.call(Executors.java:515)
        at java.base/java.util.concurrent.FutureTask.run(FutureTask.java:264)
        at java.base/java.util.concurrent.ThreadPoolExecutor.runWorker(ThreadPoolExecutor.java:1130)
        at org.conscrypt.NativeSsl.doHandshake(NativeSsl.java:404)      at java.base/java.util.concurrent.ThreadPoolExecutor$Worker.run(ThreadPoolExecutor.java:630)
        at java.base/java.lang.Thread.run(Thread.java:835)
I've made a little progress. I've written a thread-safe AllocatedBuffer pool. When 100k connections are generated in series, this reduces res mem from 3.3G to 2.3G. There is still therefore another resource leak somewhere.
There was no improvement when setting the -Djdk.nio.maxCachedBufferSize or -XX:MaxDirectMemorySize flags.
Buffer pool test code:
import org.conscrypt.AllocatedBuffer;
import org.conscrypt.BufferAllocator;
import org.conscrypt.Conscrypt;
import org.conscrypt.OpenSSLProvider;

import javax.net.ServerSocketFactory;
import javax.net.ssl.SSLServerSocket;
import javax.net.ssl.SSLServerSocketFactory;
import javax.net.ssl.SSLSocket;
import javax.net.ssl.SSLSocketFactory;
import java.io.*;
import java.net.ServerSocket;
import java.nio.ByteBuffer;
import java.security.Security;
import java.util.*;
import java.util.concurrent.*;
import java.util.concurrent.atomic.AtomicInteger;

public class Main5 {

  public static void main(String[] args) throws Exception {

    System.out.println("pid: " + ProcessHandle.current().pid());

    Scanner scanner = new Scanner(System.in);
    System.out.println("Use conscrypt? (y/n)");
    boolean useConscrypt = scanner.nextLine().toLowerCase().startsWith("y");

    if(useConscrypt) {

      System.out.println("Use buffer pool? (y/n)");
      boolean useBufferPool = scanner.nextLine().toLowerCase().startsWith("y");

      if(useBufferPool) {
        Conscrypt.setDefaultBufferAllocator(new BufferAllocator() {

          final ConcurrentMap<Integer, ConcurrentLinkedDeque<AllocatedBuffer>> pool = new ConcurrentHashMap<>();

          @Override
          public AllocatedBuffer allocateDirectBuffer(int capacity) {
            pool.putIfAbsent(capacity, new ConcurrentLinkedDeque<>());
            ConcurrentLinkedDeque<AllocatedBuffer> subPool = pool.get(capacity);

            AllocatedBuffer allocatedBuffer = subPool.pollFirst();
            if (allocatedBuffer != null) return allocatedBuffer;
            System.out.println("allocateDirect");
            return new AllocatedBuffer() {
              final ByteBuffer buffer = ByteBuffer.allocateDirect(capacity);

              @Override
              public ByteBuffer nioBuffer() {
                return buffer;
              }

              @Override
              public AllocatedBuffer release() {
                buffer.clear();
                subPool.push(this);
                return this;
              }
            };
          }
        });
      }
      Security.insertProviderAt(new OpenSSLProvider(), 1);
    }

    int listenPort = 12345;

    ServerSocketFactory serverSocketFactory = SSLServerSocketFactory.getDefault();
    ServerSocket serverSocket = serverSocketFactory.createServerSocket(listenPort);
    ((SSLServerSocket) serverSocket).setEnabledProtocols(new String[]{"TLSv1"});

    Thread listenThread = new Thread(()->{
      try {
        while(true) {
          try(var socket = serverSocket.accept()) {
            try(var out = new PrintWriter(new BufferedWriter(new OutputStreamWriter(socket.getOutputStream())))) {
              out.println("Hello");
              out.flush();
            }
          }
        }
      } catch (IOException e) {
        e.printStackTrace();
      }
    });
    listenThread.setDaemon(true);
    listenThread.start();


    SSLSocketFactory factory = (SSLSocketFactory) SSLSocketFactory.getDefault();

    var count = new AtomicInteger(0);

    Thread progressThread = new Thread(()->{
      try {
        while(true) {
          Thread.sleep(1000);
          System.out.println("Count: " + count.get());
        }
      }
      catch (InterruptedException e) {}
    });
    progressThread.setDaemon(true);
    progressThread.start();

    while(true) {
      try {
        try(SSLSocket socket = (SSLSocket) factory.createSocket("localhost", listenPort)) {
          socket.startHandshake();
          try(BufferedReader in = new BufferedReader(new InputStreamReader(socket.getInputStream()))) {
            while ((in.readLine()) != null);
          }
          count.incrementAndGet();
        }
      }
      catch (IOException e) {
        e.printStackTrace();
      }
    }

  }

}
Thanks for the detailed reproduction and apologies for the slow response.
Running (essentially) that code on MacOS, it fails by running out of file descriptors long before memory becomes an issue (about 2000 iterations). It seems to be leaking ~ 4 pipe fds each iteration, which suggests that the AppData native destructor isn't getting called for either the client or server socket. Which will obviously leak memory too and is altogether bad.
Would you mind checking whether you're seeing the same behaviour as well? Although I'm slightly surprised your environment has that many fds available...
With your code running, lsof -p <pid> | grep TCP should keep showing a small number (3 or 4) of TCP connections, but lsof -p <pid> | grep -c PIPE will show an ever increasing number of pipe fds if you're seeing the same thing.
Thanks!
@prbprbprb Thanks for looking into this, much appreciated.
Btw I'm using the Main5 code (from my previous post) for the following tests, because that allows me to easily enable and disable the AllocatedBuffer pool.
On Centos 7, the lsof -p <pid> | grep TCP command shows at most a couple of entires. When I do watch 'lsof -p <pid> | grep pipe | wc -l' I see a number that bounces up and down between about 50 and 500. It does not seem to grow, even after 100k connections. This behavior occurs whether I have the buffer pool enabled or not. (Note that "pipe" must be grep'd for on Linux, rather than "PIPE").
I then tested on MacOS (10.15.4), and I found exactly the same situation. I do also see the process memory usage grow forever on MacOS, as queried using the command ps -o rss <pid>.
Maybe you're getting an fd leak because you're using a more recent development version of Conscrypt, rather than the latest 2.4.0 release?
bounces up and down between about 50 and 500
Yeah, looks like there are two ways the pipe resources can get released. They're supposed to get released when an engine-based socket is closed, via freeIfDone but that clearly isn't happening in this case and should hopefully be easy to debug. They also get released by the NativeSsl finalizer, so (speculation) it looks like on MacOS those objects aren't being GCed fast enough to prevent running out of file descriptors. On the minus side, that means this isn't your memory leak either but once I fix this I can go looking for that.
maybe [...] you're using a more recent development version
Actually no, I'm working from home due to the current global unpleasantness, so the path of least resistance for me to reproduce and debug a little was local IntelliJ and the 2.4.0 uber jar :)
I'll switch back to remote Linux/Android though as we need to squish this on all platforms, especially as the default socket implementation in the Android 11 preview releases is the engine one - so your help here is very much appreciated!
FWIW the number of open fds stabilises on Android too, bounces between 60ish and 150ish
It may not be all that useful, but I thought I'd mention:
On Linux, I dumped the memory of the Java process after about 100k connections had been completed, using gcore -a -o conscrypt.dump <pid>. I then did strings conscrypt.dump.<pid> | sort | uniq -c | sort -n and discovered that there were no more than a couple thousand occurrences of any particular string in that dump, EXCEPT the string localhost which occurred approximately 100k times.
I then did a hex edit of the memory dump and searched for occurrences of that localhost string to see what was being stored in memory so much. Unfortunately it was mostly blank space, random nonsense, and nothing consistent. Here is an example: (don't forget to scroll to the right side of the text below)
00F078E4   00 00 00 00  00 00 00 00  00 00 00 00  00 00 00 00  00 00 00 00  00 00 00 00  00 00 00 00  00 00 00 00  00 00 00 00  00 00 00 00  00 00 00 00  00 00 00 00  00 00 00 00  ....................................................
00F07918   00 00 00 00  00 00 00 00  00 00 00 00  00 00 00 00  00 00 00 00  00 00 00 00  00 00 00 00  00 00 00 00  00 00 00 00  00 00 00 00  00 00 00 00  00 00 00 00  00 00 00 00  ....................................................
00F0794C   00 00 00 00  00 00 00 00  00 00 00 00  00 00 00 00  00 00 00 00  00 00 00 00  00 00 00 00  00 00 00 00  00 00 00 00  00 00 00 00  00 00 00 00  00 00 00 00  00 00 00 00  ....................................................
00F07980   00 00 00 00  00 00 00 00  00 00 00 00  00 00 00 00  00 00 00 00  10 44 00 00  00 00 00 00  11 44 00 00  00 00 00 00  00 44 00 00  00 00 00 00  16 03 01 00  30 43 4E 68  .....................D.......D.......D..........0CNh
00F079B4   C9 A4 CB D4  E4 53 71 61  E5 A2 CA 02  C9 57 81 E9  4F 02 8A 32  E0 53 28 AF  1E 4F D0 5E  8B 0B E0 21  E5 A2 13 C8  AD B7 F1 88  72 8D B8 85  B9 E9 81 E9  49 AA CF 23  .....Sqa.....W..O..2.S(..O.^...!........r.......I..#
00F079E8   6A 9B BB 57  28 AC 53 3B  06 A7 16 D8  A1 AD EE 65  00 22 13 01  13 02 13 03  C0 2B C0 2C  CC A9 C0 2F  C0 30 CC A8  C0 09 C0 0A  C0 13 C0 14  00 9C 00 9D  00 2F 00 35  j..W(.S;.......e.".......+.,.../.0.............../.5
00F07A1C   01 00 00 8B  00 00 00 0E  00 0C 00 00  09 6C 6F 63  61 6C 68 6F  73 74 00 17  00 00 FF 01  00 01 00 00  0A 00 08 00  06 00 1D 00  17 00 18 00  0B 00 02 01  00 00 05 00  .............localhost..............................
00F07A50   05 01 00 00  00 00 00 0D  00 14 00 12  04 03 08 04  04 01 05 03  08 05 05 01  08 06 06 01  02 01 00 33  00 26 00 24  00 1D 00 20  83 AE B0 A4  64 4E AE 23  FB 9F 66 E3  ...............................3.&.$... ....dN.#..f.
00F07A84   44 A7 4B 8B  3F 1D 94 F0  93 39 7A 41  18 33 ED 60  12 3A 7B 2F  00 2D 00 02  01 01 00 2B  00 09 08 03  04 03 03 03  02 03 01 00  00 00 00 00  00 00 00 00  00 00 00 00  D.K.?....9zA.3.`.:{/.-.....+........................
00F07AB8   00 00 00 00  00 00 00 00  00 00 00 00  00 00 00 00  00 00 00 00  00 00 00 00  00 00 00 00  00 00 00 00  00 00 00 00  00 00 00 00  00 00 00 00  00 00 00 00  00 00 00 00  ....................................................
00F07AEC   00 00 00 00  00 00 00 00  00 00 00 00  00 00 00 00  00 00 00 00  00 00 00 00  00 00 00 00  00 00 00 00  00 00 00 00  00 00 00 00  00 00 00 00  00 00 00 00  00 00 00 00  ....................................................
00F07B20   00 00 00 00  00 00 00 00  00 00 00 00  00 00 00 00  00 00 00 00  00 00 00 00  00 00 00 00  00 00 00 00  00 00 00 00  00 00 00 00  00 00 00 00  00 00 00 00  00 00 00 00  ....................................................
00F07B54   00 00 00 00  00 00 00 00  00 00 00 00  00 00 00 00  00 00 00 00  00 00 00 00  00 00 00 00  00 00 00 00  00 00 00 00  00 00 00 00  00 00 00 00  00 00 00 00  00 00 00 00  ....................................................
00F07B88   00 00 00 00  00 00 00 00  00 00 00 00  00 00 00 00  00 00 00 00  00 00 00 00  00 00 00 00  00 00 00 00  00 00 00 00  00 00 00 00  00 00 00 00  00 00 00 00  00 00 00 00  ....................................................
One guess is that localhost is one of the parameters to a JNI call that is not being cleared out of memory.
There are some patterns in the hex
D.......D..........0..a...PV...p.)1]c.............bg..W..f}8.....6......0C.P..3.N.K.f..L3...".......+.,.../.0.............../.5.............localhost.............................................................3.&.$... .*.....X..j.)*"C._........(p.....-.....+
D.......D..........0o..-MrP.H8.<...^..8.x...h.H....9....U..`O..+.-......0C.P..3.N.K.f..L3...".......+.,.../.0.............../.5.............localhost.............................................................3.&.$... .z..=C(...:.n.../..{D.hS4.xz./\O.-.....+
D.......D..........0p.-../.1..p........k#.........B...}.w.8...Q.a.0w....0C.P..3.N.K.f..L3...".......+.,.../.0.............../.5.............localhost.............................................................3.&.$... mu..y.<]..oK.$E.L|=...@RS.}......-.....+
D.......D..........0...P#.......>.lnFI..0U...ZQ.k....J......FV\F...;....0C.P..3.N.K.f..L3...".......+.,.../.0.............../.5.............localhost.............................................................3.&.$... ....^3....3aF.....~......?.n...V.-.....+
Aha, some googling has turned up the following:
Notice in the hex, there is a sequence C0 2B C0 2C CC A9 C0 2F C0 30 CC A8 C0 09 C0 0A C0 13 C0 14 00 9C 00 9D 00 2F 00 35, which corresponds to what looks like +.,.../.0.............../.5 in ascii.
These are TLS cipher suites. See e.g. https://security.stackexchange.com/questions/166556/ssl-tls-cipher-suites-order-for-windows-2016-hosted-https-sites and https://www.ibm.com/support/knowledgecenter/en/SSLTBW_2.2.0/com.ibm.zos.v2r2.gska100/csdcwh.htm
[C02B]  TLS_ECDHE_ECDSA_WITH_AES_128_GCM_SHA256
[C02C]  TLS_ECDHE_ECDSA_WITH_AES_256_GCM_SHA384
[CCA9]  TLS_ECDHE_ECDSA_WITH_CHACHA20_POLY1305_SHA256
[C02F]  TLS_ECDHE_RSA_WITH_AES_128_GCM_SHA256
[C030]  TLS_ECDHE_RSA_WITH_AES_256_GCM_SHA384
[CCA8]  TLS_ECDHE_RSA_WITH_CHACHA20_POLY1305_SHA256
[C009] TLS_ECDHE_ECDSA_WITH_AES_128_CBC_SHA
[C00A] TLS_ECDHE_ECDSA_WITH_AES_256_CBC_SHA
[C013]  TLS1_CK_ECDHE_RSA_WITH_AES_128_CBC_SHA
[C014]  TLS1_CK_ECDHE_RSA_WITH_AES_256_CBC_SHA
[009C]  TLS_RSA_WITH_AES_128_GCM_SHA256
[009D]  TLS_RSA_WITH_AES_256_GCM_SHA384
[002F]  TLS_RSA_AES_128_SHA
[0035]  TLS_RSA_AES_256_SHA
So it looks like the 100k repetition in memory is the contents of a buffer used for the TLS handshake. This solves the question of why 30 39 (the hex of the port number 12345) is not part of the data - "localhost" is specified in the handshake for SNI, and the port number is not necessary for that purpose.
Note that this is part of the ClientHello from the client. I'm not sure, but I don't think there are 100k copies of the ServerHello in memory, since I searched for the certificate serial number sent by the server, and only see that a few hundred times in the data. It's possible though that some parts of the server reponse are part of the memory leak, and other parts (like the certificate number) aren't part of the leak.
#842 didn't get me closer on this...
Using IntelliJ's memory profiler (which is pretty basic), I see your test app creating about 250 new Strings (and their associate byte arrays) for each 500 iterations. These mostly seem to be the "Hello" being read by the client and the hostname as it's being parsed by java.net.Socket.
Not sure why these aren't being GCed correctly, but both socket implementations behave the same for me. I'll dig into it on Linux tomorrow and see if it behaves differently. I do see a few larger byte arrays than this that might be the kind of thing you're seeing, but IntellIJ can't track their creation...
Just an idea: maybe do some cheap stdout allocation tracking using the custom BufferAllocator code and make sure all the allocations are returned? If they don't match up in numbers, you can log a stack trace of where they're allocated and dig into why they're not released elsewhere.
I've written a new test that varies the amount of data sent by the client and server, and measures the res mem usage after a specified number of iterations.
The results are as follows:
Performing 10k iterations with conscrypt and buffer pooling enabled, -Xmx=32m:
| client tx (KB) | server tx (KB) | res mem (MB) | time (s) |
|---|---|---|---|
| 1 | 1 | 344 | 8 |
| 100 | 1 | 397 | 15 |
| 1 | 100 | 396 | 441 |
| 100 | 100 | 430 | 446 |
Performing 10k iterations with conscrypt and buffer pooling enabled, -Xmx=64m:
| client tx (KB) | server tx (KB) | res mem (MB) | time (s) |
|---|---|---|---|
| 1 | 1 | 375 | 8 |
| 10 | 1 | 415 | 9 |
| 100 | 1 | 423 | 16 |
| 1000 | 1 | 397 | 85 |
| 10000 | 1 | 446 | 626 |
Then I tested with conscrypt disabled, with only 1k iterations this time (due to pure Java being slow), -Xmx=32m:
| client tx (KB) | server tx (KB) | res mem (MB) | time (s) |
|---|---|---|---|
| 1 | 1 | 105 | 50 |
| 100 | 1 | 101 | 52 |
| 1 | 100 | 100 | 95 |
| 100 | 100 | 102 | 97 |
The biggest question raised by this result is: with Conscrypt enabled, why does it take 30x longer for the server to transmit 100kb than the client (441s vs 15s)?
Note that I tried repeating the tests, reversing the order of transmission so that the server reads first instead of writing first, and the results were exactly the same (both in conscrypt and non-conscrypt tests).
The source code for this test is as follows:
import org.conscrypt.AllocatedBuffer;
import org.conscrypt.BufferAllocator;
import org.conscrypt.Conscrypt;
import org.conscrypt.OpenSSLProvider;

import javax.net.ServerSocketFactory;
import javax.net.ssl.SSLServerSocket;
import javax.net.ssl.SSLServerSocketFactory;
import javax.net.ssl.SSLSocket;
import javax.net.ssl.SSLSocketFactory;
import java.io.*;
import java.net.ServerSocket;
import java.nio.ByteBuffer;
import java.security.SecureRandom;
import java.security.Security;
import java.util.Date;
import java.util.Random;
import java.util.Scanner;
import java.util.concurrent.ConcurrentHashMap;
import java.util.concurrent.ConcurrentLinkedDeque;
import java.util.concurrent.ConcurrentMap;
import java.util.concurrent.atomic.AtomicInteger;

public class Main6 {

  private static Random prng = new SecureRandom();
  public static byte[] randomBytes(int len) {
    byte[] r = new byte[len];
    prng.nextBytes(r);
    return r;
  }

  public static void main(String[] args) throws Exception {

    System.out.println("pid: " + ProcessHandle.current().pid());

    Scanner scanner = new Scanner(System.in);

    System.out.println("Iterations?");
    int iterations = Integer.parseInt(scanner.nextLine());

    System.out.println("Client payload (KB)?");
    byte[] clientPayload = randomBytes(Integer.parseInt(scanner.nextLine())*1024);

    System.out.println("Server payload (KB)?");
    byte[] serverPayload = randomBytes(Integer.parseInt(scanner.nextLine())*1024);

    System.out.println("Use conscrypt? (y/n)");
    boolean useConscrypt = scanner.nextLine().toLowerCase().startsWith("y");

    if(useConscrypt) {

      System.out.println("Use buffer pool? (y/n)");
      boolean useBufferPool = scanner.nextLine().toLowerCase().startsWith("y");

      if(useBufferPool) {
        Conscrypt.setDefaultBufferAllocator(new BufferAllocator() {

          final ConcurrentMap<Integer, ConcurrentLinkedDeque<AllocatedBuffer>> pool = new ConcurrentHashMap<>();

          @Override
          public AllocatedBuffer allocateDirectBuffer(int capacity) {
            pool.putIfAbsent(capacity, new ConcurrentLinkedDeque<>());
            ConcurrentLinkedDeque<AllocatedBuffer> subPool = pool.get(capacity);

            AllocatedBuffer allocatedBuffer = subPool.pollFirst();
            if (allocatedBuffer != null) return allocatedBuffer;
            System.out.println("allocateDirect");
            return new AllocatedBuffer() {
              final ByteBuffer buffer = ByteBuffer.allocateDirect(capacity);

              @Override
              public ByteBuffer nioBuffer() {
                return buffer;
              }

              @Override
              public AllocatedBuffer release() {
                buffer.clear();
                subPool.push(this);
                return this;
              }
            };
          }
        });
      }
      Security.insertProviderAt(new OpenSSLProvider(), 1);
    }

    long startMs = new Date().getTime();

    int listenPort = 12345;

    ServerSocketFactory serverSocketFactory = SSLServerSocketFactory.getDefault();
    ServerSocket serverSocket = serverSocketFactory.createServerSocket(listenPort);

    Thread listenThread = new Thread(()->{
      try {
        while(true) {
          try(var socket = serverSocket.accept()) {
            var out = new DataOutputStream(new BufferedOutputStream(socket.getOutputStream()));
            var in = new DataInputStream(new BufferedInputStream(socket.getInputStream()));
            out.write(serverPayload);
            out.flush();
            in.readNBytes(clientPayload.length);
          }
        }
      } catch (IOException e) {
        e.printStackTrace();
      }
    });
    listenThread.setDaemon(true);
    listenThread.start();


    SSLSocketFactory factory = (SSLSocketFactory) SSLSocketFactory.getDefault();

    var count = new AtomicInteger(0);

    Thread progressThread = new Thread(()->{
      try {
        while(true) {
          Thread.sleep(1000);
          System.out.println("Count: " + count.get());
        }
      }
      catch (InterruptedException e) {}
    });
    progressThread.setDaemon(true);
    progressThread.start();

    while(true) {
      try {
        try(SSLSocket socket = (SSLSocket) factory.createSocket("localhost", listenPort)) {
          socket.startHandshake();
          var in = new DataInputStream(new BufferedInputStream(socket.getInputStream()));
          var out = new DataOutputStream(new BufferedOutputStream(socket.getOutputStream()));
          in.readNBytes(serverPayload.length);
          out.write(clientPayload);
          out.flush();
          count.incrementAndGet();
          if(count.get()>=iterations) {

            System.out.println("Iterations: " + iterations);
            System.out.println("Client payload (KB): " + (clientPayload.length/1024));
            System.out.println("Server payload (KB): " + (serverPayload.length/1024));
            System.out.println("Duration (seconds): " + ((new Date().getTime() - startMs)/1000));
            Process p = Runtime.getRuntime().exec("ps -o rss " + ProcessHandle.current().pid());
            Scanner s = new Scanner(p.getInputStream()).useDelimiter("\\A");
            s.nextLine();
            System.out.println("Res mem (MB): " + (Integer.parseInt(s.nextLine())/1024));
            System.exit(0);
          }
        }
      }
      catch (IOException e) {
        e.printStackTrace();
      }
    }

  }

}
@prbprbprb Btw I tried building your latest code from your copy of this repository, using the method I describe here #736 (comment) (taking care to swap out the docker image's conscrypt repo with yours).
When I produced the conscrypt-openjdk-2.5.0-SNAPSHOT-linux-x86_64.jar file and attempted to run code against it, I got this exception:
Exception in thread "main" Exception in thread "Thread-0" java.lang.ExceptionInInitializerError
        at java.base/sun.security.ssl.SignatureScheme.<clinit>(SignatureScheme.java:59)
        at java.base/sun.security.ssl.SSLSessionImpl.<clinit>(SSLSessionImpl.java:828)
        at java.base/sun.security.ssl.TransportContext.<init>(TransportContext.java:133)
        at java.base/sun.security.ssl.TransportContext.<init>(TransportContext.java:103)
        at java.base/sun.security.ssl.SSLSocketImpl.<init>(SSLSocketImpl.java:142)
        at java.base/sun.security.ssl.SSLSocketFactoryImpl.createSocket(SSLSocketFactoryImpl.java:88)
        at Main6.main(Main6.java:136)
Caused by: java.security.InvalidParameterException: unhandled field class java.security.spec.ECFieldF2m
        at org.conscrypt.OpenSSLECGroupContext.getInstance(OpenSSLECGroupContext.java:98)
        at org.conscrypt.ECParameters.engineInit(ECParameters.java:51)
        at java.base/java.security.AlgorithmParameters.init(AlgorithmParameters.java:293)
        at java.base/sun.security.ssl.NamedGroup.<init>(NamedGroup.java:270)
        at java.base/sun.security.ssl.NamedGroup.<clinit>(NamedGroup.java:57)
        ... 7 more
java.lang.NoClassDefFoundError: Could not initialize class sun.security.ssl.SSLSessionImpl
        at java.base/sun.security.ssl.TransportContext.<init>(TransportContext.java:133)
        at java.base/sun.security.ssl.TransportContext.<init>(TransportContext.java:115)
        at java.base/sun.security.ssl.SSLSocketImpl.<init>(SSLSocketImpl.java:125)
        at java.base/sun.security.ssl.SSLServerSocketImpl.accept(SSLServerSocketImpl.java:272)
        at Main6.lambda$main$0(Main6.java:102)
        at java.base/java.lang.Thread.run(Thread.java:832)
Am I doing something wrong, or is your repo in a temporarily non-working state? Please let me know if there is anything that it would be helpful for me to test. Perhaps I'm misinterpreting your comments in this thread - I'm not clear about whether you've so far been able to reproduce the memory leak I'm describing.
Conscrypt doesn't support ECField2m. It only supports ECFieldFp. Maybe you initialized with a certificate using an EC key of a field using secp256k1 instead of secp256r1?
@kruton Thanks for your idea. I'm definitely using -groupname secp256r1. I then tried with an RSA keystore and I strangely got exactly the same exception. The keystore creation command I used was keytool -genkey -keyalg RSA -keysize 2048 -keystore keystore-rsa -alias localhost -keypass password -storepass password -dname "CN=localhost,OU=X,O=X,L=X,S=X,C=X".
It all worked with Conscrypt 2.4.0, so I assume something must have broken with 2.5.0-SNAPSHOT.
cheap stdout allocation tracking using the custom BufferAllocator code
Btw the test code above (the Main6 class) prints an stdout message when any new AllocatedBuffer is created in the pool, and only a very small number of them are ever created (even with 100k iterations in the loop of the test code), proving that they are being reused correctly. Therefore the memory leak must not be related to AllocatedBuffers that are not garbage collected.
@prbprbprb Whoa, your latest changes have fixed the memory leak!(it's fixed for my test code in this thread, but not when I try it with a heavily used Jetty instance).
I was having trouble building either the latest version of this repo or your personal fork of this repo (because those result in the ECFieldF2m exception documented above), but I used the hack below to copy in your ConscryptEngineSocket.close() fix:
git clone https://github.com/google/conscrypt.git
cd conscrypt/
git checkout 0cc406690cd3a19e9cacfa4be341719e25826ee0
docker build -t conscrypt-deploy release
containerId=$(docker run -td --rm=true conscrypt-deploy)
docker exec -ti $containerId bash
yum -y install gcc-c++
rm -fr conscrypt
git clone https://github.com/google/conscrypt.git
cd conscrypt/
git checkout 0cc406690cd3a19e9cacfa4be341719e25826ee0
rm -f common/src/main/java/org/conscrypt/ConscryptEngine.java common/src/main/java/org/conscrypt/ConscryptEngineSocket.java openjdk/src/test/java/org/conscrypt/SSLUtilsTest.java
wget --directory-prefix=common/src/main/java/org/conscrypt https://raw.githubusercontent.com/prbprbprb/conscrypt/8ecb28927bff36be38a8eaa082531e27c68982af/common/src/main/java/org/conscrypt/ConscryptEngine.java
wget --directory-prefix=common/src/main/java/org/conscrypt https://raw.githubusercontent.com/prbprbprb/conscrypt/8ecb28927bff36be38a8eaa082531e27c68982af/common/src/main/java/org/conscrypt/ConscryptEngineSocket.java
wget --directory-prefix=openjdk/src/test/java/org/conscrypt https://raw.githubusercontent.com/prbprbprb/conscrypt/8ecb28927bff36be38a8eaa082531e27c68982af/openjdk/src/test/java/org/conscrypt/SSLUtilsTest.java
./gradlew conscrypt-openjdk:build
exit
docker cp $containerId:/conscrypt/openjdk/build/libs/conscrypt-openjdk-2.5.0-SNAPSHOT-linux-x86_64.jar ./
docker stop $containerId
Using the jar built using this procedure, the memory leak is completely gone, for the test cases I've posted in this thread. Thanks!
Note: I've double-checked that there IS the memory leak with the wget commands above omitted, but there is NO leak when the wgets are used to replace those 3 java source files with your recent commit.
Edit: Although the leak seems to have disappeared using this test code, my Jetty instance that uses this 2.5.0-SNAPSHOT is still seeing res mem usage rise by a GB every hour until the machine runs out of physical memory
Update: I've tried using jemalloc instead of glibc with java, and that does not help.
A promising angle is that jemalloc can be used to narrow down the memory leak, as described here: https://technology.blog.gov.uk/2015/12/11/using-jemalloc-to-get-to-the-bottom-of-a-memory-leak/
The only problem is that the conscrypt jar I'm using does not have boringssl debug symbols, so the jemalloc profiling output is not useful. If someone could provide instructions for building conscrypt with a version of boringssl with debug symbols, that might be a way to unlock some progress.
Update:
Thanks, SPECTACULAR improvement in performance with Conscrypt v2.5.0!
Performing 10k iterations with conscrypt and buffer pooling enabled, -Xmx=32m: (Using Main6.java code above):
| client tx (KB) | server tx (KB) | res mem (MB) BEFORE | res mem (MB) AFTER | time (s) BEFORE | time (s) AFTER |
|---|---|---|---|---|---|
| 1 | 1 | 344 | 130 | 8 | 10 |
| 100 | 1 | 397 | 217 | 15 | 10 |
| 1 | 100 | 396 | 182 | 441 | 12 |
| 100 | 100 | 430 | 178 | 446 | 14 |
Unfortunately though, the memory leak is not fixed. Two different jetty servers I have running with Conscrypt 2.5.0 are still using up all available memory until all physical memory is consumed.
I tested Conscrypt 2.5.0 with my Main5.java code above, and that does not reveal the memory leak. My production servers can go months without jetty restarts without Conscrypt, but need daily jetty restarts with Conscrypt. I'm not sure what's going wrong, I'll update this thread if I can find a way of providing a reproducible test case.
@knaccc great news on the speed improvement.
As for helping your debug efforts, follow the existing setup instructions, but change the code build type in the cmake command line from Release to Debug and for gradlew to add the -Pnostrip=true argument:
pushd $BORINGSSL_HOME/build64
cmake -DCMAKE_POSITION_INDEPENDENT_CODE=TRUE -DCMAKE_BUILD_TYPE=Debug -DCMAKE_ASM_FLAGS=-Wa,--noexecstack -GNinja ..
ninja
popd
./gradlew assemble -Pnostrip=true
Check with:
nm ./openjdk/build/libs/conscrypt_openjdk_jni/shared/libconscrypt_openjdk_jni.so
@kruton Thanks, I was able to build boringssl with debug symbols, and the nm command confirmed this. However, for the memory hogging functions, jeprof was still unable to display a function name. Either this means that the bloated function is not a conscrypt function, or there is something about the way that the jvm loads the library that prevents jeprof from correlating the function name to the debug symbols. I'll keep investigating. I built a docker image that attempts to load test a freshly installed jetty with conscrypt, but that does not trigger the memory leak. There must be something different about the production servers that I've not figured out yet.
Interesting. Maybe try editing openjdk/build.gradle and add "-g" right after the -O compilation arguments in both places.
@kruton Thanks, I tried that, but looks like that still doesn't allow jeprof to see the debug symbols.
Here is my exact build process:
git clone https://github.com/google/conscrypt
cd conscrypt
git checkout 2.5.0
docker build -t conscrypt-deploy release
containerId=$(docker run -td --rm=true conscrypt-deploy)
docker exec -ti $containerId bash
yum -y install gcc-c++
cd /usr/src
rm -fr boringssl
git clone https://boringssl.googlesource.com/boringssl/
cd boringssl/
mkdir build64
cd build64
cmake -DCMAKE_POSITION_INDEPENDENT_CODE=TRUE \
      -DCMAKE_BUILD_TYPE=Debug \
      -DCMAKE_ASM_FLAGS=-Wa,--noexecstack \
      -GNinja ..
ninja
cd /
rm -fr conscrypt
git clone https://github.com/google/conscrypt
cd conscrypt
git checkout 2.5.0
echo "nostrip=true" >> gradle.properties
sed -i 's/"-O3",/"-O3","-g",/g' openjdk/build.gradle
./gradlew conscrypt-openjdk:build
exit
docker cp $containerId:/conscrypt/openjdk/build/libs/conscrypt-openjdk-2.5.0-linux-x86_64.jar ./
mv conscrypt-openjdk-2.5.0-linux-x86_64.jar conscrypt-openjdk-2.5.0-debug-linux-x86_64.jar
docker stop $containerId
(Note that if I do not do yum -y install gcc-c++ in the script above, the gradle build will fail with the error Could not find C++ compiler 'g++' in system path)
To verify that debug symbols are present, I do:
unzip conscrypt-openjdk-2.5.0-debug-linux-x86_64.jar
nm META-INF/native/libconscrypt_openjdk_jni-linux-x86_64.so
And the output seems to show a symbol for every hex address. E.g. the end of the nm output is:
00000000001d3cf0 t x509_digest_sign_algorithm
00000000001d3ed0 t x509_digest_verify_init
00000000004a75f8 d x509_dir_lookup
00000000004a7648 d x509_file_lookup
0000000000193610 t x509_name_canon
0000000000193db0 t x509_name_encode
0000000000192fc0 t x509_name_ex_d2i
0000000000192f20 t x509_name_ex_free
0000000000193330 t x509_name_ex_i2d
0000000000192e10 t x509_name_ex_new
00000000004a16a8 d x509_name_ff
00000000001836c0 t x509_object_cmp
0000000000184320 t x509_object_idx_cnt
00000000001d6440 t x509_print_rsa_pss_params
00000000001d5c50 t x509_rsa_ctx_to_pss
00000000001d6030 t x509_rsa_pss_to_ctx
000000000018c3c0 t x509_verify_param_zero
00000000001a42b0 t x509v3_bytes_to_hex
000000000023e220 r x509v3_bytes_to_hex.hexdig
00000000001a0430 t x509v3_cache_extensions
00000000001a43f0 t x509v3_hex_to_bytes
00000000001a4d10 t x509v3_looks_like_dns_name
00000000001a46e0 t x509v3_name_cmp
00000000001a13e0 t xp_cmp
00000000004a8e18 b xptable
00000000001a1400 t xptable_free
00000000004a7350 d xstandard
I then test conscrypt using my Main5.java code above, by doing the following:
keytool -genkey -keyalg EC -keystore keystore -groupname secp256r1 -alias localhost -keypass password -storepass password -dname "CN=localhost,OU=X,O=X,L=X,S=X,C=X"

javac -cp conscrypt-openjdk-2.5.0-debug-linux-x86_64.jar:. Main5.java

export LD_PRELOAD=$LD_PRELOAD:/usr/lib/x86_64-linux-gnu/libjemalloc.so
export MALLOC_CONF=prof:true,lg_prof_interval:30,lg_prof_sample:17

java -Xmx64M -cp conscrypt-openjdk-2.5.0-debug-linux-x86_64.jar:. -Djavax.net.ssl.keyStore=keystore -Djavax.net.ssl.keyStorePassword=password -Djavax.net.ssl.trustStore=keystore -Djavax.net.ssl.trustStorePassword=password Main5

jeprof --show_bytes --gif /opt/jdk/bin/java jeprof*.heap > app-profiling.gif
When I do the above, for my Main5 class, I see this:

This doesn't seem to reference any boringssl native functions. I'm guessing this is because jeprof sees no memory leak (because there is no memory leak with my Main5 code with conscrypt, but there is a memory leak for jetty with conscrypt).
However, on the Jetty instance, where there is a memory leak, I see this:
It is that 0x00007f380493f813 function that is the memory leak. When I run Jetty without conscrypt, I don't see that function or any other JNI/hex function names in the jeprof output. The jetty jeprof output without conscrypt (where there is no memory leak, even if the process is left running for months) looks like this:
@kruton Big progress update:
I noticed the memory leak function address changes on each restart of the Jetty w/conscrypt process, e.g. on 3 different occasions the location varied as follows:
0x00007f380493f813
0x00007f7b3b43f813
0x00007faf1d23f813
This seems to be because the conscrypt shared library is randomly loaded into different memory locations on each run.
When investigating the most recent leak location 0x00007faf1d23f813, I noticed that if I did:
cat /proc/2481594/maps | grep conscryptthen output was:
7faf1d0d7000-7faf1d36c000 r-xp 00000000 09:02 20208410 /tmp/libconscrypt_openjdk_jni-linux-x86_6415985905566290000.so (deleted)
7faf1d36c000-7faf1d56c000 ---p 00295000 09:02 20208410 /tmp/libconscrypt_openjdk_jni-linux-x86_6415985905566290000.so (deleted)
7faf1d56c000-7faf1d57c000 r--p 00295000 09:02 20208410 /tmp/libconscrypt_openjdk_jni-linux-x86_6415985905566290000.so (deleted)
7faf1d57c000-7faf1d57f000 rw-p 002a5000 09:02 20208410 /tmp/libconscrypt_openjdk_jni-linux-x86_6415985905566290000.so (deleted)
thus confirming that the memory leak address is related to the conscrypt shared library. Since it says (deleted), that explains why jemalloc/jeprof was unable to load shared symbols. This is confirmed when I try gdb --pid <jetty pid>, which says:
warning: Could not load shared library symbols for /tmp/libconscrypt_openjdk_jni-linux-x86_6415985905566290000.so
I then dumped the 7faf1d0d7000-7faf1d36c000 region from memory by running gdb --pid <jetty pid> and then using the gdb command dump memory /tmp/dump.bin 0x7faf1d0d7000 0x7faf1d36c000.
I was able to then confirm that this memory dump is identical to the META-INF/native/libconscrypt_openjdk_jni-linux-x86_64.so file from the conscrypt jar.
By calculating 0x00007faf1d23f813 - 0x00007faf1d0d7000 = 0x00168813, we now finally know that the memory leak as reported by jemalloc/jeprof is the address 0x00168813 in META-INF/native/libconscrypt_openjdk_jni-linux-x86_64.so.
The sorted nm listing shows:
0000000000168740 t OPENSSL_malloc
0000000000168870 t __asan_poison_memory_region
0000000000168880 t OPENSSL_free
Therefore the memory leak at location 0168813 seems to correlate with the 0168740 t OPENSSL_malloc function, which seems to make sense.
Now, we can examine the jeprof diagram again and subtract 0x00007faf1d0d7000 from every hex address in the diagram to correlate the conscrypt function.
The diagram with correlated conscrypt function symbols is:
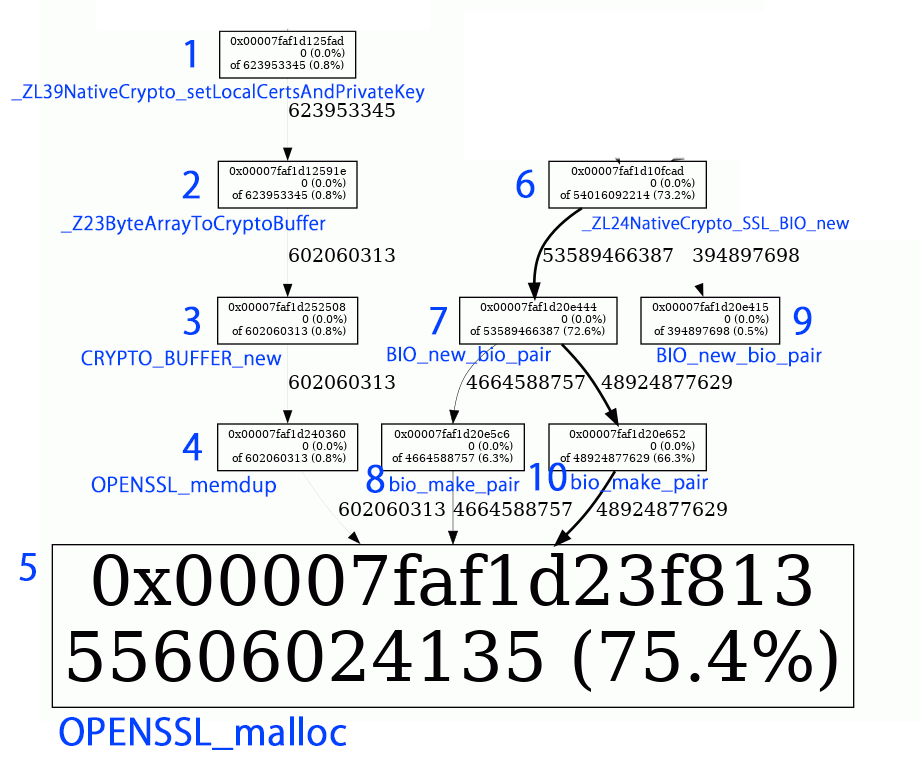
 1) 0x0004efad -> 000000000004ee40 t _ZL39NativeCrypto_setLocalCertsAndPrivateKeyP7JNIEnv_P7_jclasslP8_jobjectP13_jobjectArrayS4_
 2) 0x0004e91e -> 000000000004e8d0 T _Z23ByteArrayToCryptoBufferP7JNIEnv_P11_jbyteArrayP21crypto_buffer_pool_st
 3) 0x0017b508 -> 000000000017b420 t CRYPTO_BUFFER_new
 4) 0x00169360 -> 0000000000169330 t OPENSSL_memdup
 5) 0x00168813 -> 0000000000168740 t OPENSSL_malloc
 6) 0x00038cad -> 0000000000038c70 t _ZL24NativeCrypto_SSL_BIO_newP7JNIEnv_P7_jclasslP8_jobject
 7) 0x00137444 -> 00000000001373e0 t BIO_new_bio_pair
 8) 0x001375c6 -> 00000000001374c0 t bio_make_pair
 9) 0x00137415 -> 00000000001373e0 t BIO_new_bio_pair
10) 0x00137652 -> 00000000001374c0 t bio_make_pair
Hopefully these function calls mean something interesting to you. I'd guess that items 1), 2) and 6) are of particular interest, since those relate to direct JNI invocations. I also assume that the line width of the diagram arrows are indicating that the most common path is 6) _ZL24NativeCrypto_SSL_BIO_newP7JNIEnv_P7_jclasslP8_jobject -> 7) BIO_new_bio_pair -> 10) bio_make_pair -> 5) OPENSSL_malloc.
Just a thought: From looking at the conscrypt code, I think this memory leak could be due to BioWrapper.close() not always being called. And perhaps the reason this leak only shows up in production is because only in production is it the case that SSL connections are not terminated cleanly, thus not causing BioWrapper.close() to always be called?
Maybe the problem is that it is sometimes the case that pendingInboundCleartextBytes() != 0, on isInboundDone() or pendingOutboundEncryptedBytes() != 0 on isOutboundDone(), thus preventing memory from being freed.
I notice that there is a drainOutgoingQueue() attempt followed by a reattempt to close and free the socket, but there is no equivalent to attempt to clear the pendingInboundCleartextBytes and then retry the closing and freeing of the socket.
Maybe the answer is to complete the // TODO: Close SSL sockets using a background thread so they close gracefully. mentioned here.
Another update: Two weeks ago, I removed conscrypt from my production Jetty instances (for the purposes of serving incoming requests). However, one of the Jetty instances still uses conscrypt to make outgoing connections to retrieve external content.
Before: Both Jetty instances needed restarting every 24hrs or so due to the memory leak.
After: The Jetty instance that does not use conscrypt at all has been running for 2 weeks with no memory leak. However, the other Jetty instance that does not use conscrypt for incoming connections but does use conscrypt for outgoing connections now has a slow memory leak that causes it to need to be restarted every 7 days or so.
Bottom line: It looks like the memory leak applies both to conscrypt server sockets and client sockets.
This should make it easier to reproduce the issue, since it can be reproduced purely by making lots of outgoing connections to a broad variety of different web sites.
If it helps with memory profiling, here is code that will attempt to connect to as many different domains as possible (retrieving max. 1 url per domain, to prevent hammering any particular web site).
It spawns 200 threads, starts at wikipedia, and branches outwards to locate as many different websites as it can to connect to.
Note that this is a much slower memory leak than the memory leak that happens when conscrypt is used for accepting incoming connections to Jetty.
import org.conscrypt.OpenSSLProvider;

import java.io.BufferedReader;
import java.io.InputStreamReader;
import java.net.HttpURLConnection;
import java.net.URL;
import java.security.Security;
import java.util.*;
import java.util.concurrent.ConcurrentLinkedQueue;
import java.util.regex.Matcher;
import java.util.regex.Pattern;

public class Main11 {

  private static ArrayList<String> extractUrlsFromString(String content) {
    ArrayList<String> result = new ArrayList<>();
    String regex = "https://[-a-zA-Z0-9+&@#/%?=~_|!:,.;]*[-a-zA-Z0-9+&@#/%=~_|]";
    Pattern p = Pattern.compile(regex);
    Matcher m = p.matcher(content);
    while (m.find()) result.add(m.group());
    return result;
  }

  public static String extractDomainFromUrl(String href) {
    href = href.trim().substring(href.indexOf("://") + "://".length());
    if(href.indexOf('#')!=-1) href = href.substring(0, href.indexOf('#'));
    if(href.indexOf('/')!=-1) href = href.substring(0, href.indexOf('/'));
    if(href.contains(":")) href = href.substring(0, href.indexOf(":"));
    if(href.contains("?")) href = href.substring(0, href.indexOf("?"));
    if(href.contains("\"")) href = href.substring(0, href.indexOf("\""));
    href = href.trim();
    return href.toLowerCase();
  }

  private static String getUrlContent(String url) {
    try {
      int maxLines = 200;
      URL urlObj = new URL(url);
      HttpURLConnection conn = (HttpURLConnection) urlObj.openConnection();
      conn.setConnectTimeout(2000);
      conn.setReadTimeout(2000);
      conn.setAllowUserInteraction(false);
      conn.setRequestMethod("GET");
      conn.setUseCaches(false);
      conn.setDoInput(true);
      conn.setDoOutput(true);
      conn.connect();
      int statusCode = conn.getResponseCode();
      BufferedReader br = new BufferedReader(new InputStreamReader(statusCode == 200 ? conn.getInputStream() : conn.getErrorStream(), "UTF-8"));
      StringBuilder sb = new StringBuilder();
      String line;
      int c=0;
      while ((line = br.readLine()) != null) {
        sb.append(line);
        sb.append('\n');
        c++;
        if(c>maxLines) break;
      }
      br.close();
      return sb.toString();
    }
    catch (Exception e) {
      return "";
    }
  }

  public static void main(String[] args) throws Exception {

    System.out.println("pid: " + ProcessHandle.current().pid());

    Scanner scanner = new Scanner(System.in);

    System.out.println("Use conscrypt? (y/n)");
    boolean useConscrypt = scanner.nextLine().toLowerCase().startsWith("y");

    if(useConscrypt) Security.insertProviderAt(new OpenSSLProvider(), 1);

    Set<String> domainsVisited = Collections.synchronizedSet(new HashSet<>());

    Thread progressThread = new Thread(()->{
      while(true) {
        try {
          Thread.sleep(1000);
          Process p = Runtime.getRuntime().exec("ps -o rss " + ProcessHandle.current().pid());
          Scanner s = new Scanner(p.getInputStream()).useDelimiter("\\A");
          s.nextLine();
          System.out.println("Domains visited: " + domainsVisited.size() + ", Res mem (MB): " + (Integer.parseInt(s.nextLine().trim()) / 1024));
          p.destroy();
        }
        catch (Exception e) {
          e.printStackTrace();
        }
      }
    });
    progressThread.setDaemon(true);
    progressThread.start();

    var queue = new ConcurrentLinkedQueue<String>();
    queue.add("https://en.wikipedia.org/wiki/United_States");

    int threads = 200;
    for(int i=0; i<threads; i++) {
      new Thread(() -> {
        while (true) {
          try {
            String url = queue.poll();
            if(url==null) {
              Thread.sleep(1000);
            }
            else {
              boolean retrieve = false;
              {
                String domain = extractDomainFromUrl(url);
                synchronized (domainsVisited) {
                  if(!domainsVisited.contains(domain)) {
                    retrieve = true;
                    domainsVisited.add(domain);
                  }
                }
              }
              if(retrieve) {
                String content = getUrlContent(url);
                if(queue.size()<10000) {
                  extractUrlsFromString(content).stream()
                    .filter(u -> !u.contains("wikipedia.org") && !u.toLowerCase().contains(".pdf") && !u.toLowerCase().contains(".jpg") && !u.toLowerCase().contains(".gif") && !u.toLowerCase().contains(".png") && !u.toLowerCase().contains(".zip"))
                    .forEach(u -> {
                      String d = extractDomainFromUrl(u);
                      synchronized (domainsVisited) {
                        if (!domainsVisited.contains(d)) queue.add(u);
                      }
                  });
                }
              }
            }
          }
          catch (Exception e) {
            e.printStackTrace();
          }
        }
      }).start();
    }

  }

}Also would be worth setting -Dorg.conscrypt.native.deleteLibAfterLoading=false to help with symbol fetching.
Thanks for the test program, @knaccc. I ran it and looked at the jeprof output which confirmed your suspicions above. It appears as though the networkBio is only closed in some cases. I created #893 which seems like the logical fix. I'll let @prbprbprb check it out.
Here are my steps for posterity:
./gradlew assemble -Pnostrip=true
javac -cp openjdk/build/libs/conscrypt-openjdk-2.5.0-SNAPSHOT-linux-x86_64.jar Main10.java
export MALLOC_CONF=prof:true,lg_prof_interval:30,lg_prof_sample:17
LD_PRELOAD=/usr/lib/x86_64-linux-gnu/libjemalloc.so java -cp .:openjdk/build/libs/conscrypt-openjdk-2.5.0-SNAPSHOT.jar -Djava.library.path=$PWD/openjdk/build/libs/conscrypt_openjdk_jni/shared -Xmx512m Main10
Answer "y" to the question and let it run for a little bit.
jeprof --show_bytes --gif $JAVA_HOME/bin/java $(ls -1tr jeprof.*.heap | tail -1) > output.gif
@kruton Thanks, btw your -Dorg.conscrypt.native.deleteLibAfterLoading=false makes the jeprof diagram work for me.
I see you're still working on your fix-bio-leak branch - please let me know when it's ready and I'll try it on my Jetty instance.
I see you're still working on your fix-bio-leak branch - please let me know when it's ready and I'll try it on my Jetty instance.
Yeah, I realized that I was redirecting stderr so I missed some problems my initial patch caused. It would try to double-close the BIO sometimes. It also uncovered trying to use the ssl without locking it. I think it's ready to try out now.
@kruton I've been running your patch since Saturday, and I think your changes have made a very significant improvement. Unfortunately, I think a slow leak still persists.
I have one Jetty instance with -Xmx=4G (that only uses conscrypt for incoming connections), and it's currently using 5.6G res mem. This is a huge improvement. Previously this instance would have exceeded 20GB res mem within a couple of days. I'll keep it running for several days to see if there is a slow leak or if there is no leak at all.
The second Jetty instance with -Xmx=3G and which uses conscrypt both for incoming and outgoing connections started to exceed 10G res mem, but is experiencing a "slow" leak and not a fast leak. At this point I restarted the instance and used jeprof on it, and the output is as follows:

Here are the exact steps I took to build Conscrypt 2.5.1 using your patch. Note that in order for it to build, I had to use BoringSSL commit 48cb69f8bd5606933e1844460551a4bc140622c0. Btw is there a record of the BoringSSL commit that is used with each Conscrypt release? I'm never sure which commit to use.
git clone https://github.com/google/conscrypt
cd conscrypt
git checkout 2.5.1
docker build -t conscrypt-deploy release
containerId=$(docker run -td --rm=true conscrypt-deploy)
docker exec -ti $containerId bash
yum -y install gcc-c++
cd /usr/src
rm -fr boringssl
git clone https://boringssl.googlesource.com/boringssl/
cd boringssl/
git checkout 48cb69f8bd5606933e1844460551a4bc140622c0
mkdir build64
cd build64
cmake -DCMAKE_POSITION_INDEPENDENT_CODE=TRUE \
      -DCMAKE_BUILD_TYPE=Debug \
      -DCMAKE_ASM_FLAGS=-Wa,--noexecstack \
      -GNinja ..
ninja
cd /
rm -fr conscrypt
git clone https://github.com/google/conscrypt
cd conscrypt
git checkout 2.5.1
rm -f common/src/main/java/org/conscrypt/ConscryptEngine.java
rm -f common/src/main/java/org/conscrypt/NativeSsl.java
wget --directory-prefix=common/src/main/java/org/conscrypt https://raw.githubusercontent.com/google/conscrypt/30f9218ccc9eaae776220401dbe08c1f1d6bebad/common/src/main/java/org/conscrypt/ConscryptEngine.java
wget --directory-prefix=common/src/main/java/org/conscrypt https://raw.githubusercontent.com/google/conscrypt/30f9218ccc9eaae776220401dbe08c1f1d6bebad/common/src/main/java/org/conscrypt/NativeSsl.java

echo "nostrip=true" >> gradle.properties
sed -i 's/"-O3",/"-O3","-g",/g' openjdk/build.gradle
./gradlew conscrypt-openjdk:build
exit
docker cp $containerId:/conscrypt/openjdk/build/libs/conscrypt-openjdk-2.5.1-linux-x86_64.jar ./
docker stop $containerIdUpdate: My production jetty server (using conscrypt for incoming connections only) with Xmx=4G is bouncing between 6G and 7G res mem usage, and has been running for 2 weeks. I'm fairly confident you've therefore fixed the memory leak for server sockets.
My other production jetty server (using conscrypt for both incoming and outgoing connections) with Xmx=3G will exceed 12G res mem in just a couple of days, depending on the extent to which it makes outgoing connections. I think that there is therefore still a memory leak for client sockets.
I started looking into this under the assumption that the main issue was fixed in Conscrypt 2.5.1 (even though use engine socket is now the default). My assumption was that there is a TLS Client leak in Conscrypt remaining and it would show up with a simple sustained load script. Before adding profiling tools, or Jetty into the mix I wanted to see an actual leak in a working correct entirely self contained program.
So this certainly won't catch any of the following cases
- Bug in jetty framework or HTTPS calling code
- Bug in particular JDK versions (I'm running with 15.0.1 just by default)
- Leak due to profiling approach or custom builds of Conscrypt/BoringSSL
- Leak due to failure cases - handled cleanly (correctly) or uncleanly (leaving sockets open?)
To be honest, with a simple self contained program I'm not seeing an obvious client leak. Non heap memory is growing at 1 byte per 12 sockets. It's hard to know if this is just JVM growth as there is a lot of accounting going on in the JVM. Could just be some regular JVM native structures.
At this point I could either
- Try different scenarios (bad connections)
- Try with profiling and custom conscrypt builds.
But I thought I'd ask for advice from anyone still seeing this for client cases, what specific scenarios and environments can you still replicate the problem with?
Bytes per request since 10 seconds after JVM launch

Pastebin for the Intellij kotlin load script https://pastebin.com/Ctff1Ddj
This should run (almost immediately) out of the up to date versions of Intellij or Android Studio without a gradle project etc.
@yschimke Thanks for looking into this. I could not replicate the memory leak with a simple loopback test, which is why I wrote Main11.java. Main11 will start at wikipedia and follow links outward to as many different domains as possible, so that it encounters a wide variety of TLS implementations/configurations.
Note that it will take few hours for the memory leak to show. My server that uses conscrypt to make outbound connections leaks about 10GB a week (so I just restart the process once a week, and that's a workable solution).
I started looking into this under the assumption that the main issue was fixed in Conscrypt 2.5.1
The server socket leak was fixed by #893 which is not yet merged, as far as I can see.
I'm very happy to deploy #942 to my server and leave it running for a week, to see if I get the leak. I just need to know which boringssl commit to use when building (I use the build method I documented here: #835 (comment) )
@knaccc Thanks for the context, really helpful. After applying the PR fixes, do you think it's definitely a Conscrypt leak (incorrectly dealing with varied and bad servers etc in the wild) vs a bug in the web crawler behaviour in Main11 or generally JVM HTTPSUrlConnection or Jetty in the original problem statement.
If we suspect it's a bug with varied TLS connections, then a useful mid-point would be your script producing a known list of 10k hostnames to make round robin connections to. And see whether we see the leak.
It doesn't look like Main11 is designed to handle errors cleanly though. br is only closed in the successful case. Are we expecting that good GC performance should cause the memory to be reclaimed within the space of the week even though it's possible native allocations, which don't tie back to GC pressure?
do you think it's definitely a Conscrypt leak
Yes, because if I simply remove Conscrypt as an OpenSSLProvider on the server, there is no longer a memory leak. Additionally, you will see earlier in this thread that I've used jemalloc to demonstrate that the leak is as a result of calls to native code (OPENSSL_malloc) rather than Java object leaks.
It doesn't look like Main11 is designed to handle errors cleanly though
FYI my real-world code doesn't look anything like Main11. Instead, it retrieves images from a list of specified web pages. That code uses Apache HTTPClient, and in turn will use Conscrypt if it is registered as a provider. It has Xmx set to 3GB, so garbage collection should have kicked in long before it exceeded 10GB of res mem.
a useful mid-point would be your script producing a known list of 10k hostnames
It's possible that the leak happens due to unexpected connection issues, or a variety of uncommon circumstances that may only show themselves in the real world. It's annoying that the leak is so slow, which makes it much harder to iteratively narrow down a list.
Btw I tried to build using the procedure documented here, except with git clone https://github.com/prbprbprb/conscrypt and then git checkout bio_close. However, that build failed with a bunch of Java compilation errors. Whenever it's ready to build and pass the tests, please let me know and I'll build the jar and deploy it to my server to see if it solves the client socket leak. Please also let me know which boringssl commit that I should use.
@prbprbprb is the cleanest way to get a built jar from the github PR artifacts?
#942 -> https://github.com/google/conscrypt/suites/1705327032/artifacts/32133416
It's possible that the leak happens due to unexpected connection issues, or a variety of uncommon circumstances that may only show themselves in the real world
I suspect it's exactly that, e.g. some unexpected exception order breaking resource release, e.g. ssl is closed but networkBio hasn't been released. #942 should address that a bit more than #893.
However, that build failed with a bunch of Java compilation errors
Yeah, 2.5.1 won't build against the latest BoringSSL due to changes. Rather than try and build against a patched 2.5.1 I'd suggest patching the master branch and building against that. There isn't anything else since 2.5.1 that should break you (famous last words). e.g.
git checkout master
wget https://github.com/google/conscrypt/pull/942.patch
git apply 942.patch
is the cleanest way to get a built jar from the github PR artifacts?
Should be, when they work! (Windows and MacOS both currently broken), I haven't actually tried it myself though. Looking at the one you linked, it doesn't look like the uber jar is built but everything else seems to be in there.
If you want to stick to 2.5.1 I can probably get you the exact BoringSSL hash it was built against, I'll just need to bring our Windows build VM up. Note to self: we should document this hash with the release in future.
@prbprbprb I tried this:
git clone https://github.com/google/conscrypt
cd conscrypt
git checkout master
docker build -t conscrypt-deploy release
containerId=$(docker run -td --rm=true conscrypt-deploy)
docker exec -ti $containerId bash
cd /
rm -fr conscrypt
git clone https://github.com/google/conscrypt
cd conscrypt
git checkout master
wget https://github.com/google/conscrypt/pull/942.patch
git apply 942.patch
./gradlew conscrypt-openjdk:build
and it failed with:
> Task :conscrypt-openjdk:compileConscrypt_openjdk_jniSharedLibraryConscrypt_openjdk_jniCpp FAILED
Am I doing something wrong?
Should be, when they work! (Windows and MacOS both currently broken), I haven't actually tried it myself though. Looking at the one you linked, it doesn't look like the uber jar is built but everything else seems to be in there.
I'm going to focus on this first actually. I'd rather spend the time once getting clean CI builds off PRs, than running manual steps. I'm still catching up with Conscrypt development here, so consider anything I'm working on as a sideline.
Any update on this?
@pparth Not from me, not sure if anyone else is active on this at the moment. But if you do want to dig in you should be able to grab builds now from CI rather than building yourself with docker etc.

This is a chart of hourly recorded memory usage of a Jetty web server over a period of 470 hours, starting from the time when the Jetty process was first launched. The JVM Xmx is set to 3GB, and it's running on Ubuntu 20.04 LTS.
The web server uses Conscrypt both for incoming and outgoing connections, including using Conscrypt for outgoing TLS JDBC connections (by installing Conscrypt as the default security provider).
It is using the CI build based on commit 52f3cf1 (January 28, 2021).
You can see that suddenly, in the last few hours, there was a 2.6 GB spike in res mem usage (from about 8.3GB to 10.9GB).
This coincided with a database upgrade, which involved the DB being shut down twice (each time for about 10 minutes). This would have meant that new JDBC connections via Conscrypt could not have been made to the DB.
Logs show that approx. 1700 Socket fail to connect to host:[redacted].com, port:[redacted]. Connection refused exceptions occurred during the DB downtime. The JDBC connection pool reported a few dozen Broken pipe/Connection is closed/Connection was killed exceptions.
It's possible that the leak is due to existing outgoing JDBC connections being suddenly dropped, or due to new outgoing JDBC connections failing to be established.
It's also possible that the leak was caused by the server accepting lots of incoming HTTPS requests which were blocking due to the JDBC connection pool locking up as it waited to re-establish connections to the DB.
Note that several hours have passed since the DB downtime happened, and although the Jetty server has gone back to normal, and is able to serve HTTPS connections and communicate with the DB via JDBC, its res mem footprint has stayed permanently high.
I was able to produce a working test case that demonstrates a memory leak when a socket fails to connect. I've documented it here in a fresh issue, so that people don't have to read through this very long thread.
Nice work. I'd focused on real world scenarios which mostly had successful connections.
This is a chart of hourly recorded memory usage of a Jetty web server over a period of 470 hours, starting from the time when the Jetty process was first launched. The JVM Xmx is set to 3GB, and it's running on Ubuntu 20.04 LTS.
The web server uses Conscrypt both for incoming and outgoing connections, including using Conscrypt for outgoing TLS JDBC connections (by installing Conscrypt as the default security provider).
It is using the CI build based on commit 52f3cf1 (January 28, 2021).
You can see that suddenly, in the last few hours, there was a 2.6 GB spike in res mem usage (from about 8.3GB to 10.9GB).
This coincided with a database upgrade, which involved the DB being shut down twice (each time for about 10 minutes). This would have meant that new JDBC connections via Conscrypt could not have been made to the DB.
Logs show that approx. 1700
Socket fail to connect to host:[redacted].com, port:[redacted]. Connection refusedexceptions occurred during the DB downtime. The JDBC connection pool reported a few dozenBroken pipe/Connection is closed/Connection was killedexceptions.It's possible that the leak is due to existing outgoing JDBC connections being suddenly dropped, or due to new outgoing JDBC connections failing to be established.
It's also possible that the leak was caused by the server accepting lots of incoming HTTPS requests which were blocking due to the JDBC connection pool locking up as it waited to re-establish connections to the DB.
Note that several hours have passed since the DB downtime happened, and although the Jetty server has gone back to normal, and is able to serve HTTPS connections and communicate with the DB via JDBC, its res mem footprint has stayed permanently high.
Sorry for the late join in.
We also noticed this happening in production. Our services send only out going connections and usually the memory usage spikes when the targets timeout the http request or fail to connect in general.
While testing I also noticed a weird trend which might be or might not be related, that the memory usage and especially the build up of "leaked memory" is much lower on Oracle JDK opposed to AdoptOpenJDK (Both 11).
This could be a coincidence but this is a pattern we observed where the AdoptOpenJDK instances would need to be restarted or get OOM killed every 10-15hours where as the JVM ones would be able to run for a couple of days without much trouble (still leaking memory ofc)
I have setup a proper test environment with as much similar test conditions as possible and will report back if that wasn't just a fluke in our observations