Farming screen not updating
Closed this issue · 17 comments
Describe the bug
Firstly, thanks a lot for the great project and for keeping maintaining it.
After upgrade to 0.8.4 the Farming screen is not reloading plots. The total number of total plots shown on the home page is 9921, while the total number on the farming page is 9901. Please refer to the screenshots attached.
System setup:
- OS: CentOS Stream release 8
- Docker version: 20.10.10
- Machinaris branch: main
- Machinaris version number 0.8.4
Config
Two machines: one operating as full-node (server platform with 24 HDDs onboard) and the other one as harvester (server platform with 12 HHDs onboard and an external storage with 60 HDDs attached.
Docker-compose of both is attached.
2022-10_docker-compose_harverster.yml.txt
2022-10_docker-compose_fullnode.yml.txt


Greetings! So let's check a few things before we reset the plots status table in Machinaris (in case of file corruption).
- Do you see any duplicate, invalid, or keyless plots listed on the Farming | Warnings page?
- When you get a shell into the Machinaris container, do you see any errors by:
grep -i PLOT STATUS /root/.chia/machinaris/logs/apisrv.log? - What does
chia farm summaryat the Chia CLI show in the container, particularly compared to the counts on the Farming page. Use the Search box in top-right to filter by hostname etc to see sub-counts.
Finally, assuming the plots status database has become corrupted on disk, let's rebuild it:
cd /machinaris
./scripts/stop_machinaris.sh
rm -f /root/.chia/machinaris/dbs/plots.db
./scripts/start_machinaris.sh
This can be done inside the container without restarting it. Chia farming services are unaffected, this only restarts the Machinaris web server and rebuilds the missing plots table. Please allow at least one full hour for the Farming page to start showing plots in the table again, particularly from your harvester(s).
Hope this helps!
Thanks for the quick response!
So, here we go.
-
I do see exactly a hundred of invalid plots, which is a bit strange, by the way. But the point is that all of those invalid plot are located on the second machine, which is acting as a harvester.
The way I initially spotted the issue on the farming page was as follows. I have a number of plots on the fullnode machine, which were plotted at the very beginnig of Chia, i.e. solo plots. Currently I am replotting to replace the solo ones with the portable ones. To check the progress (among other methods) I used to input "solo" in the search box on the farming page and the number was decreasing over time. Until I upgraded to 0.8.4. Since then the number of solo plots got stuck, while I know for sure that the replotting process is progresing successfully. -
Not sure how to interpret the results, so I've attached the output.
apisrv.log -
The output is exactly the same as on the home and the summary pages (9921), but different from the farming page (9901).
Output attached.
chia farm summary.txt
Lastly I've tried to rebuild the plots status database and waited for a while, however now I don't see any plots on the farming page at all. But the 100 invalid plots on the second machine are still in place.
Hi, is this still an ongoing issue? The Warnings page is updated every hour so any temporarily duplicate plots will be removed as warnings within an hour. If the warning persists for over an hour, then perhaps you should look into it.
Also, please give the machinaris:test image a try to see if the problem recurs for you there, in the upcoming v0.8.5 release. Your feedback is appreciated. Details on the release streams on the wiki.
Hi there!
Yes, the issue still remains. After the attempt to rebuild the plots database I still don't see any plots under the Plots tab on the farming page. However there are still 100 plots shown as Invalid under the Warnings tab.
At the same time the re-plotting process is progressing well and the count of plots is updated on the summary and home pages - 9937 plots in total as of writing.
Sorry to hear that, please try the log search I suggested earlier to see if we can determine the source of the problem.
grep -i 'PLOT STATUS' /root/.chia/machinaris/logs/apisrv.log
Also, let's try to clear both the plots and warnings databases to see if that helps.
cd /machinaris
./scripts/stop_machinaris.sh
rm -f /root/.chia/machinaris/dbs/plots.db
rm -f /root/.chia/machinaris/dbs/warnings.db
./scripts/start_machinaris.sh
Then allow an hour for a full accounting of plots to roll in from your various Machinaris workers. Check the Farming page afterwards. Please let me know what you find.
Searching apisrv.log exactly for 'PLOT STATUS' (in single quotes) provides no output.
I've cleared both databases and will report on the results later.
Hmm, a complete absence of PLOT STATUS in the log indicates that plot status is completely disabled for some reason. Here's what such a log check shows on my system, with output every few minutes:
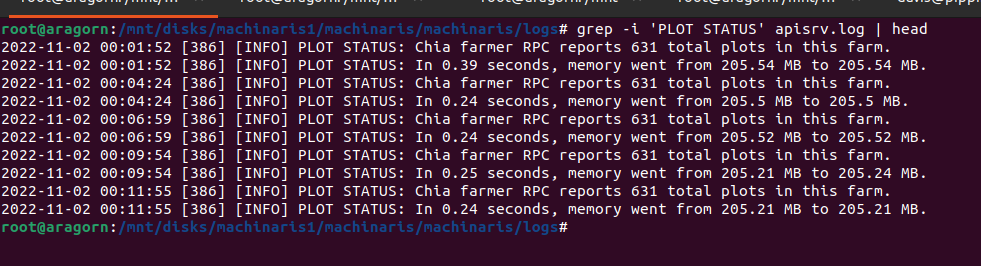
I now recommend you stop and start the entire Machinaris docker container as the start/stop script seems to not work on your system for some reason.
Execute the following on the host, not in-container:
cd ~/machinaris
docker compose stop
rm ~/.machinaris/machinaris/dbs/plots.db
rm ~/.machinaris/machinaris/dbs/warnings.db
docker compose rm -f
sed -i 's/machinaris:latest/machinaris:test/g' docker-compose.yml
docker compose pull
docker compose up -d machinaris
OK, so I've removed the DBs, amended the docker-compose.yml and pulled the test machinaris.
Started up successfully, but the issue is still there.
And still no output on PLOT STATUS:

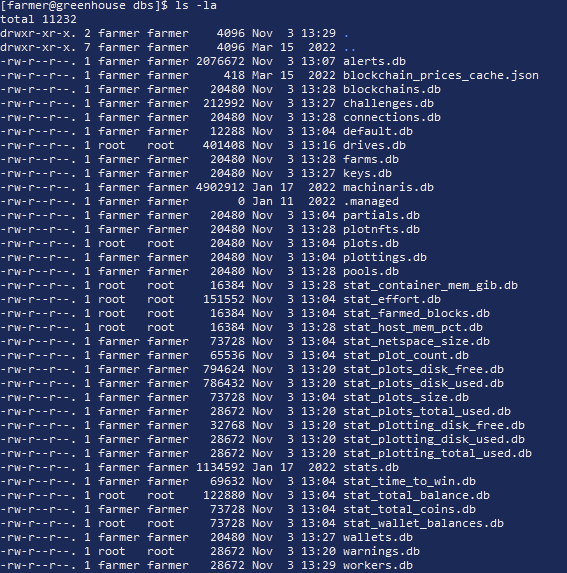
plots.db and warnings.db have been re-created automatically at 13:04 (when the container was created and started).
warnings.db was then updated at 13:28, however the plots.db is still empty (see screenshot below).
Of course as a result the list of plots is still empty, however the 100 invalid plots appeared again on the warning page.
Hi, since the duplicate plot warning keeps re-appearing, I would recommend you deal with the issue of duplicate plots (across your farm). Then see what happens.
If the problem still persists after that, the next best step to get this solved is a complete log dump after fresh restart of the container + 15 minutes. This will require you to upload your entire apisrv.log so I can see all possible messages that might lead to the cause.
The alternative that I have done for other users is to have an interactive support session using a tool such as Team Viewer. This allows me to quickly see the situation. If interested in this option, drop into the Machinaris Discord.
Either way, I think we've troubleshoot as far as we can without full log dumps and/or an interactive session.
Hi!
Apologies. As I mentioned earlier, these are not "Duplicate" plots, but "Invalid Plots".
The strange thing is that the number of Invalid plots is rather large (100) and they are all located on the second machine, which is harvester. I haven't done anything to plots on that machine for months already and I haven't ever observed any "BAD" plots on the Farming screen previously.
I can still go ahead and remove those though...
Alternatively I can suggest to stop machinaris on the second machine, where the Invalid plots are located and see what happens.

Understood. The 100 is a limit I put in place when Chia RPC reported a very large number of problematic plots. This way I don't try to display many thousands, all probably having the same problem. I wouldn't delete the plots, just try simplifying the problem case by stopping your harvester for a while as you suggest. Good luck. I'll be in the Discord if you need more interactive assistance.
Hi there!
Well, I've stopped the container on the harvester and the fullnode, removed the plots and warnings DBs on the fullnode and restarted the container on the fullnode.
No result. Still the same story, but no warnings this time.
I guess, an interactive session would be great. What is your timezone and preferred timing (I am now located in Turkey, but am basically flexible in terms of timing).
Hi. Sorry to hear this is still happening on your install. I am in Mountain Standard time in Canada. Available now, please join the Discord and we can use the General voice channel. For screenshare, probably Team Viewer.
Hi. I am new to discord, just joined and tried to send a message. Not sure if it reached you. Apologies, I am somewhat late, but if you are available, we could try with the remote assistance. Thanks a lot!
Hi, I haven't heard back from you here or on Discord so will be closing this soon.
Nice to meet you and thanks for the screenshare today. In summary, we found a malformed /root/.chia/plotman/status.json cache file (holds plot check state) which had broken the status_plots upload of plot listing to the Farming page. Removing this cache got the Farming page listing plots again.
I'll harden the code to prevent the issue when presented with malformed status files in the next release. You'll let me know if the problem occurs again. cat /root/.chia/plotman/status.json | jq shows format errors for example.