| Details | |
|---|---|
| Target OS: | Ubuntu* 18.04 LTS |
| Time to complete: | 3 hours |
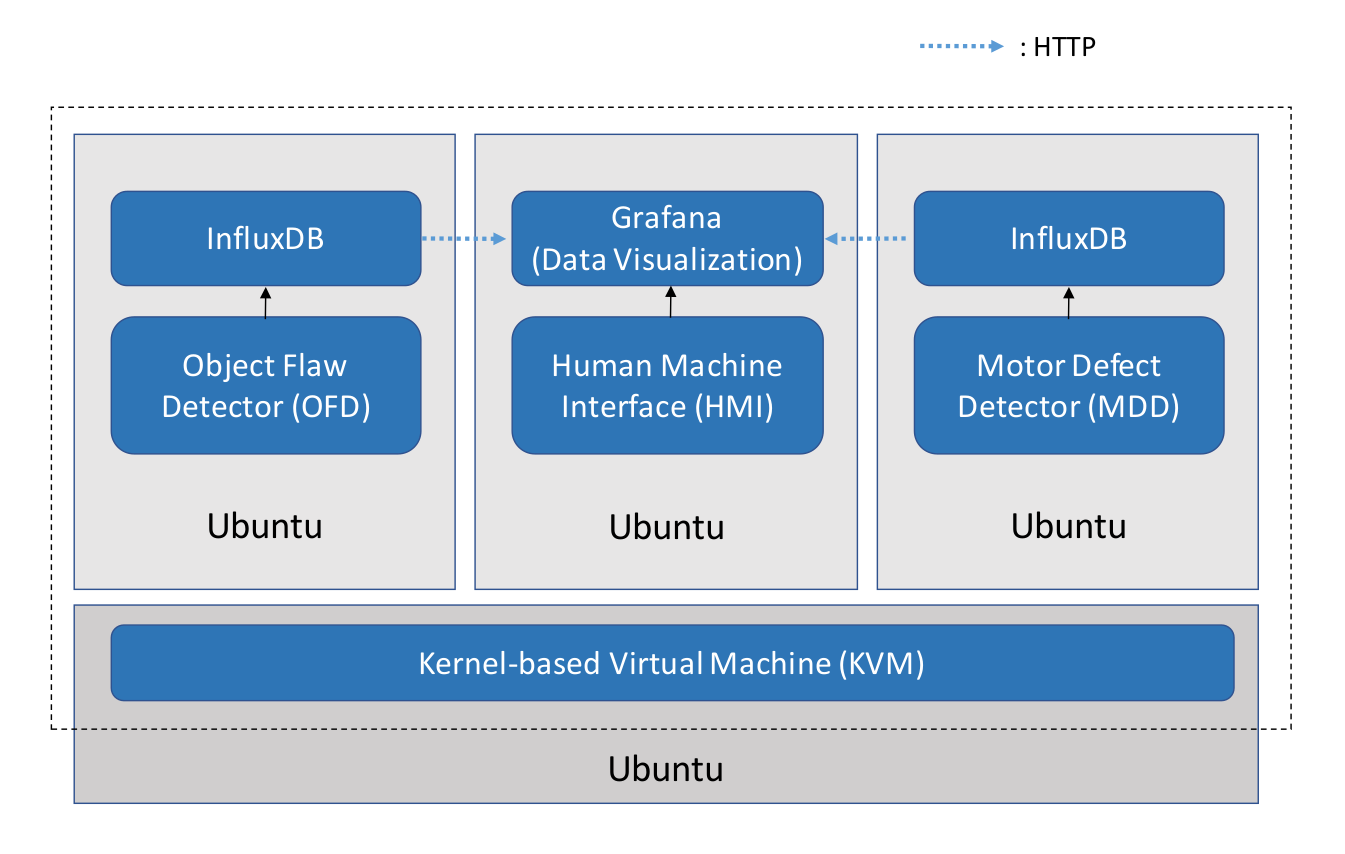
Factories use existing PLCs to control equipment and may use several different devices for the human machine interface (HMI), data ingestion, and computer vision application. This reference implementation demonstrates how all these workloads can run independently on one system. A Kernel-based virtual machine (KVM) on a host system runs multiple virtual machines (VMs) or guests. The object flaw detector and the motor defect detector applications are deployed on these virtual machines. Data visualization occurs on Grafana* on the third virtual machine. For a high level overview of workload consolidation see the Workload Consolidation in Industrial IoT article.
- Ubuntu 18.04
- InfluxDB* v1.7.1
- Grafana* v5.3.2
In this application, KVM creates three guest VMs on a host machine. Each virtual machine runs with Ubuntu 18.04 as the operating system. The first machine, named OFD, runs the object flaw detector application. The object flaw detector application detects anomalies on the objects moving on a conveyer belt and stores this data locally on InfluxDB. The second machine, named MDD, hosts the motor defect detector application which also stores the data locally on InfluxDB. Data visualization occurs on Grafana* on the third virtual machine, HMI, using data from OFD and MDD InfluxDB.
-
Ensure that virtualization is enabled in BIOS using the command:
kvm-okIf the output of the above command is
INFO: /dev/kvm exists
KVM acceleration can be used
then the virtualization is enabled. If not and the output contains
INFO: KVM (vmx) is disabled by your BIOS
HINT: Enter your BIOS setup and enable Virtualization Technology (VT),
  and then hard poweroff/poweron your system
then enter the BIOS and enable the virtualization.
-
Install the required packages:
sudo apt-get install qemu-kvm libvirt-bin ubuntu-vm-builder virt-manager bridge-utils -
Add your username to the libvirtd group:
sudo adduser `id -un` libvirtd -
Reboot the system to make your user an effective member of libvirtd user group.
-
To create virtual machine with Ubuntu 18.04 as a guest operating system, download 64-bit PC desktop ubuntu image from Ubuntu 18.04 LTS.
-
Create a directory for storage pool:
mkdir $HOME/kvm-poolIt will create a directory named kvm-pool in HOME directory.
-
Open virt-manager:
virt-manager -
To create virtual machine for object flaw detector application (OFD):
-
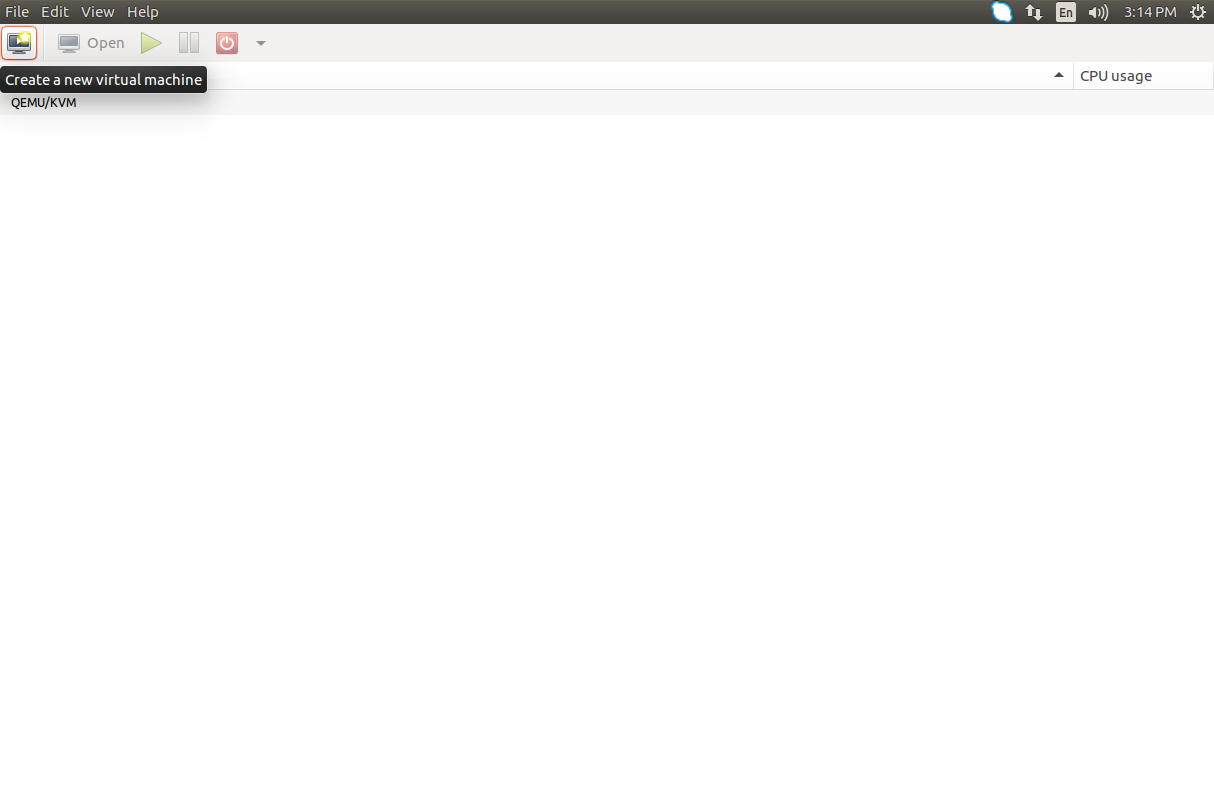
Go to File > New Virtual Machine. It will open a new dialogue window.
-
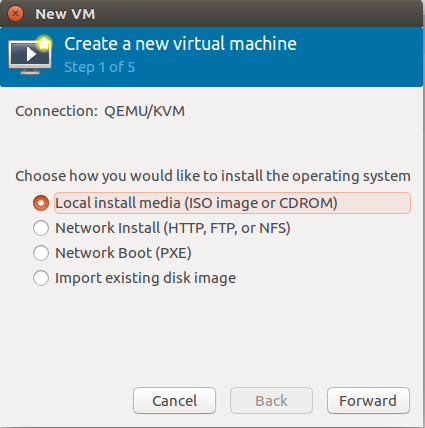
Select Local Install Media and then click on Forward button.
-
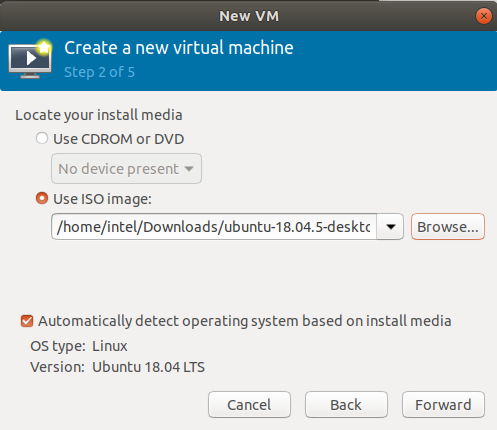
Under Locate your install media, select Use ISO image and click on Browse button. This will open Choose Storage Volume window.
-
Click on Browse Local button present at the bottom of the window and browse to the Ubuntu ISO image downloaded earlier. Click on Forward button.
-
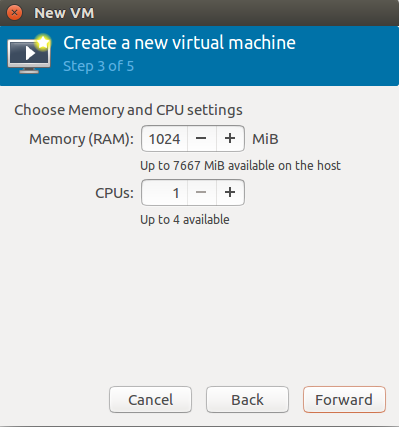
In the next window set Memory(RAM) to 1024 MiB and CPUs to 4, then click on Forward Button. You may need to increase the memory(RAM) of the VM to 4096 MiB temporarily when compiling the code samples and change back to 1024 MiB after.
-
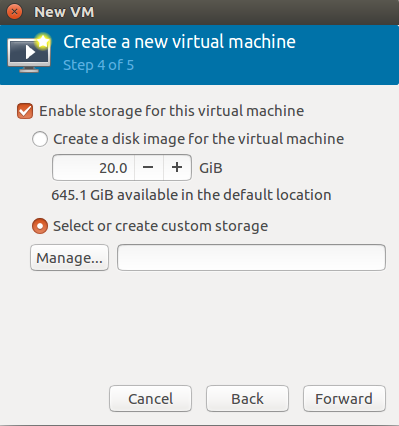
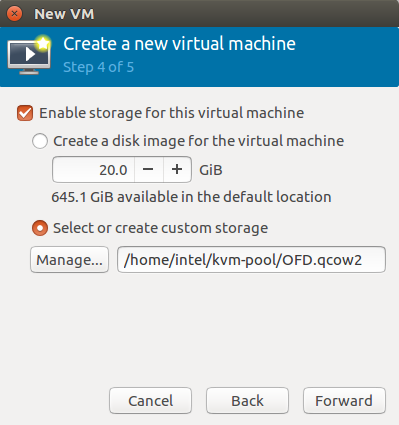
Choose Select or create custom storage and click on Manage....
-
Click on the Green + button present on the bottom left on Choose Storage Volume window, which will open Add a new Storage pool window.
-
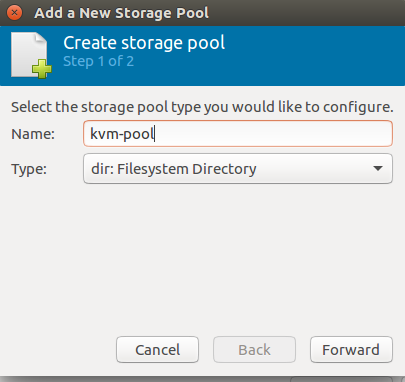
Select dir: Filesystem Directory type and give kvm-pool as the name of the storage pool. Click on Forward button.
-
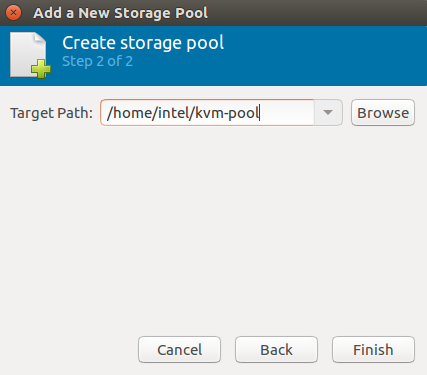
Click on Browse button and browse to the kvm-pool directory which was created in step 6. It will be the target path.
-
Click on Finish. It will open Choose Storage Volume window again. The new storage pool created i.e. kvm-pool will appear on the left panel.
-
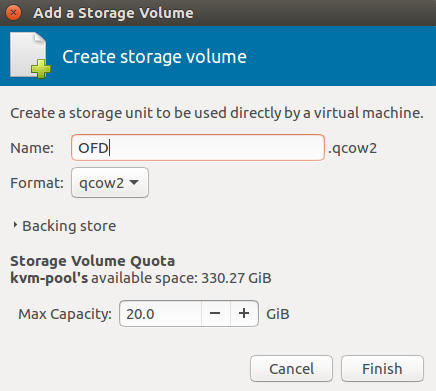
To create the storage volume for OFD, select the kvm-pool from left panel. Click on the Green + button present on the right panel beside Volumes. It opens Add a Storage Volume window.
-
Give OFD as the storage volume name and 20 GB as the max capacity, then click on the Finish button.
-
Select OFD.qcow2 storage volume from kvm-pool storage pool in Choose Storage Volume and click on the Choose Volume button.
-
In New VM window, click on the Forward button.
-
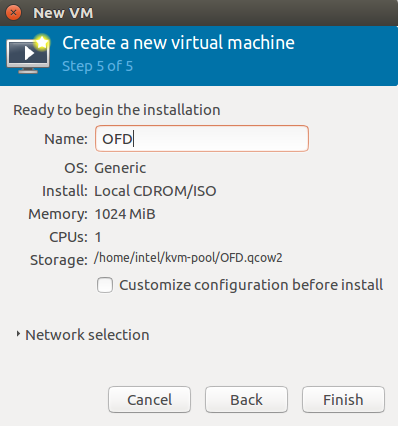
In the next window, name the virtual machine as OFD and click on the Finish button. It will start a new virtual machine.
-
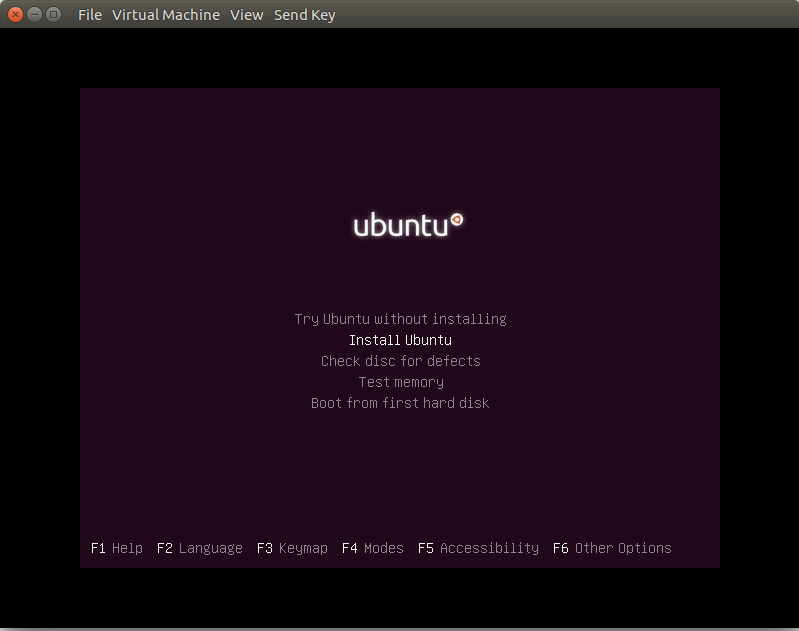
The final step of creating the virtual machine is to install Ubuntu. Follow the steps given in the below link to install Ubuntu:
https://tutorials.ubuntu.com/tutorial/tutorial-install-ubuntu-desktop#2.
-
-
Similarly, create two new VMs for the Motor Defect Detector (MDD) and Human Machine Interface (HMI) applications. Create the storage volume for MDD and HMI in the kvm-pool storage pool created in the previous step.
-
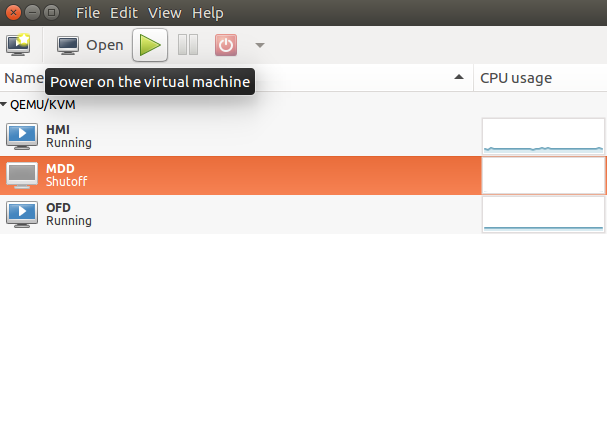
To turn on the virtual machine, select the machine from virtual machine manager and click on green play icon present on the top menu. Double click on the machine name to open the VM window.
-
For the OFD machine, get the source code of the OFD application from the GitHub* repository.
-
Follow the object flaw detector readme to run the application. Skip the steps for installing Grafana and creating the dashboard in grafana for data visualization.
-
For the MDD machine, get the motor defect detector code from the GitHub* repository.
-
Follow the motor defect detector readme to run the application for testing the Bearing Data Set. Skip the steps for installing Grafana and creating the dashboard in Grafana for data visualization.
-
On the third machine, i.e. HMI machine, install Grafana:
wget https://s3-us-west-2.amazonaws.com/grafana-releases/release/grafana_5.3.2_amd64.deb sudo apt-get install -y adduser libfontconfig sudo dpkg -i grafana_5.3.2_amd64.deb -
In the HMI Machine, visualize the data on Grafana for the OFD and MDD applications by following the steps given below:
-
Download the workload-consolidation repository in HMI from the GitHub* repository.
-
Run the Grafana server:
sudo /bin/systemctl start grafana-server -
Open a browser, go to http://localhost:3000.
-
Log in with user as admin and password as admin.
-
Click on Configuration icon present on the left panel.
-
Click on + Add data source button and provide the inputs below.
Add data source from OFD:
- Name: obj_flaw_database
- Type: InfluxDB
- URL: http://<OFD_machine_ip_address>:8086
- Database: obj_flaw_database
- Click on “Save and Test”
Click on Back button present on bottom and then click on Add data source.
Add data source from MDD for data set "1st_test":- Name: Predictions_testset1
- Type: InfluxDB
- URL: http://<MDD_machine_ip_address>:8086
- Database: Predictions_testset1
- Click on “Save and Test”
Click on Back button present on bottom and then click on Add data source.
Add data source from MDD for data set "2nd_test":- Name: Predictions_testset2
- Type: InfluxDB
- URL: http://<MDD_machine_ip_address>:8086
- Database: Predictions_testset2
- Click on “Save and Test”
-
Click on the + icon present on the left side of the browser, select import.
-
Click on the Upload.json File button.
-
Browse and select the file "motor_1_and_product_flaw_detector.json" present in Workload Consolidation directory.
-
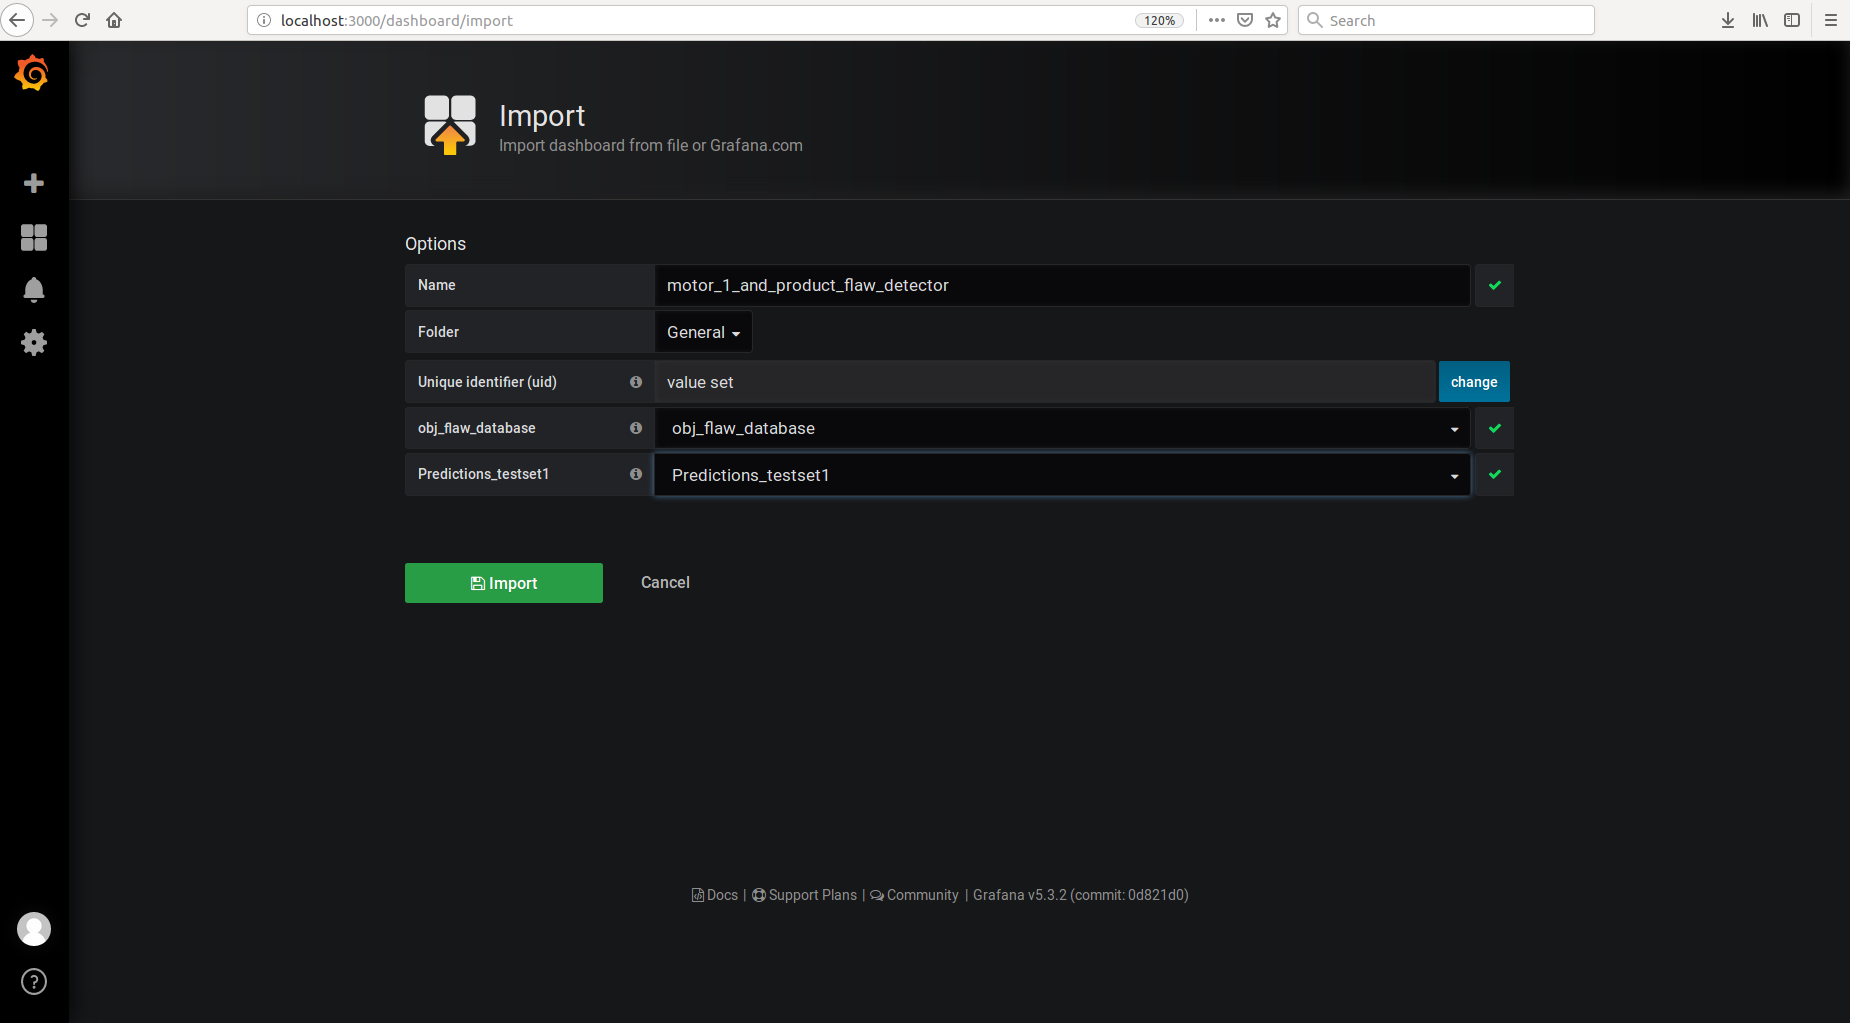
Give the name as "motor_1_and_product_flaw_detector".
-
Select "obj_flaw_database" data source in the obj_flaw_database field under options and "Predictions_testset1" data source in the Predictions_testset1 field.
-
Click on import to create a dashboard that visualizes the result of the object flaw detector and the result of data set "1st_test" from the MDD application.
-
Similarly, import "motor_2_and_product_flaw_detector.json" present in the workload-consolidation directory and name it as "motor_2_and_product_flaw_detector". Select "obj_flaw_database" data source in the obj_flaw_database field under options and "Predictions_testset2" data source in the Predictions_testset2 field.
-
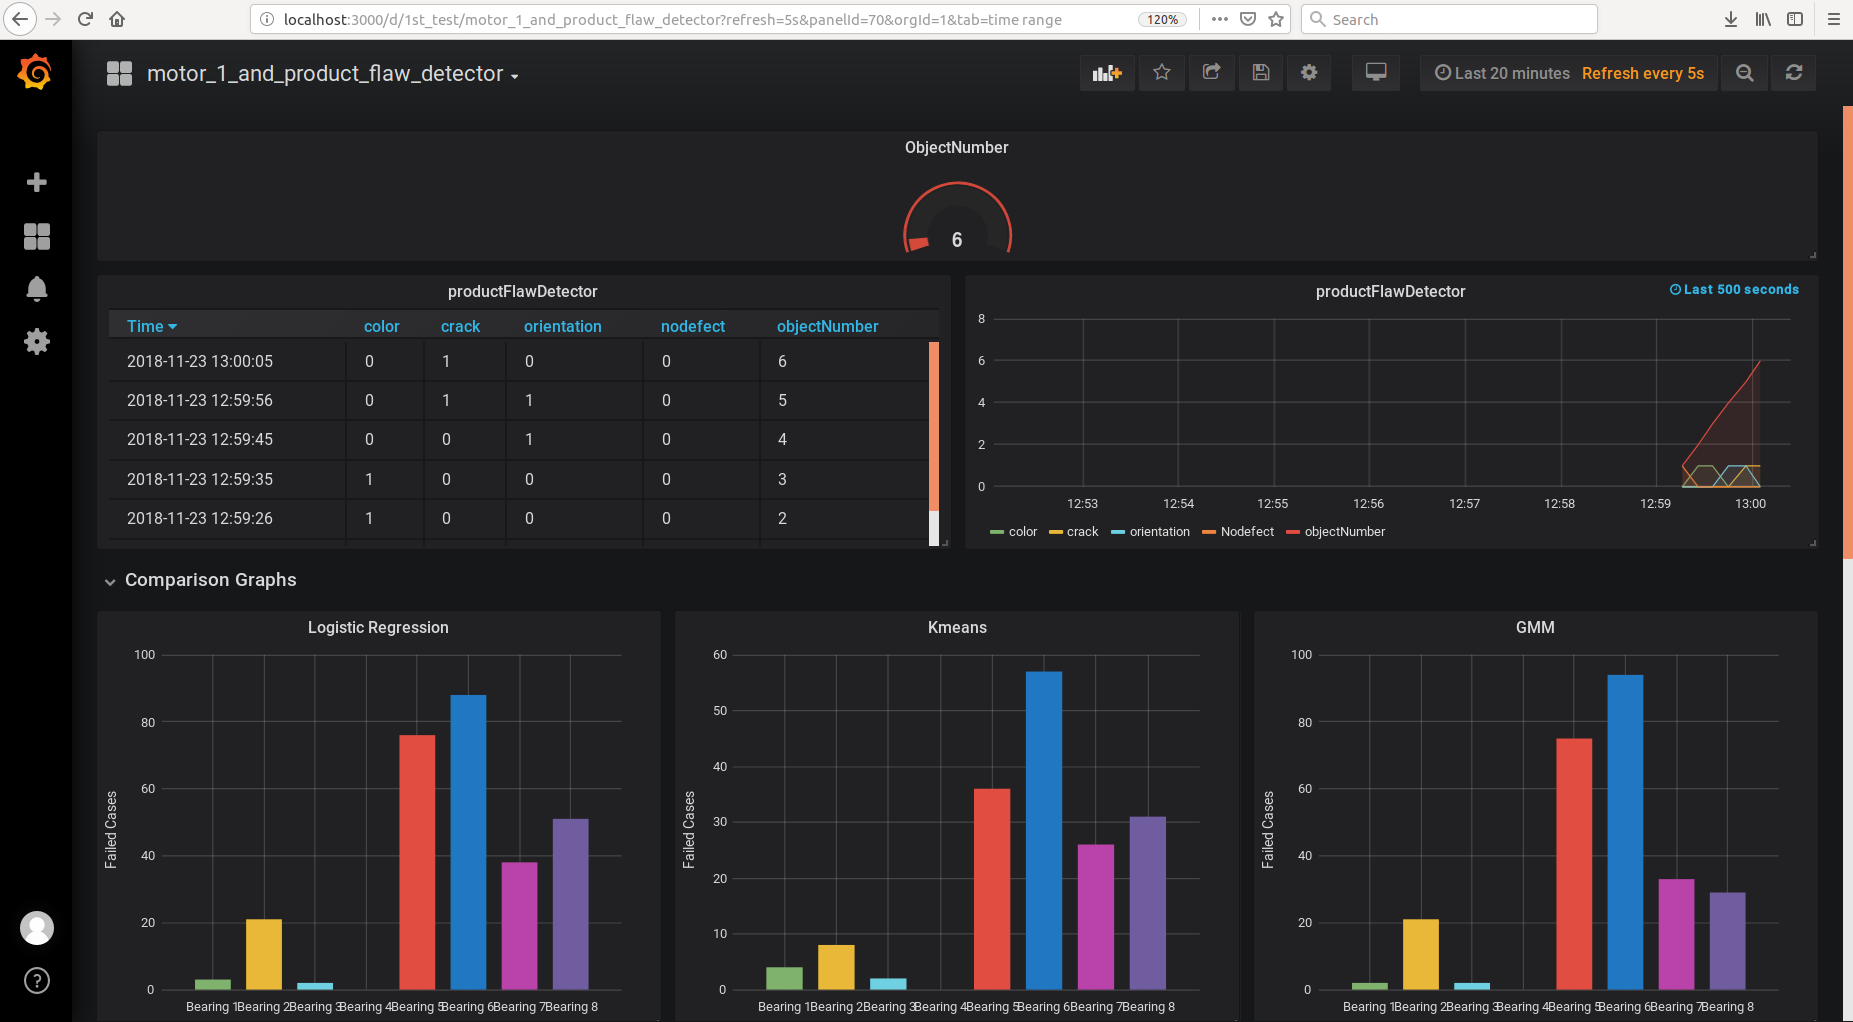
It will create a dashboard that visualizes the result of the object flaw detector and the result of data set "2nd_test" from the MDD application.
-
-
Run the motor defect detector application on MDD machine and the object flaw detector application on OFD machine. In the third machine, HMI, visualization of the data from two applications can be seen on the dashboard created in the previous step.
NOTE:
- The results of object flaw detector and data set "1st_test" in motor defect detector are visualized on the dashboard named "motor_1_and_product_flaw_detector".
- The results of object flaw detector and data set "2nd_test" in motor defect detector are visualized on the dashboard named "motor_2_and_product_flaw_detector".
